 Open Access Article
Simple and rapid monitoring of doxorubicin using streptavidin-modified microparticle-based time-resolved fluorescence immunoassay†
Junyu Lianga,
Zhigao Zhanga,
Hui Zhaob,
Shanhe Wanc,
Xiangming Zhaia,
Jianwei Zhoud,
Rongliang Lianga,
Qiaoting Denga,
Yingsong Wu*a and
Guanfeng Lin *e
*e
aInstitute of Antibody Engineering, School of Laboratory Medicine and Biotechnology, Southern Medical University, Guangzhou, China. E-mail: wg@smu.edu.cn; Fax: +86-20-37247604; Tel: +86-20-62789355
bDepartment of Plastic and Aesthetic Surgery, Third Affiliated Hospital, Sun Yat-Sen University, Guangzhou, China
cGuangdong Provincial Key Laboratory of New Drug Screening, School of Pharmaceutical Science, Southern Medical University, Guangzhou, China
dGuangzhou Darui Biotechnology Co. LTD, Guangzhou, China
eExperimental Center of Teaching and Scientific Research, School of Laboratory Medicine and Biotechnology, Southern Medical University, Guangzhou, China. E-mail: lingf@smu.edu.cn; Fax: +86-20-37247604; Tel: +86-20-62789356
First published on 25th April 2018
Abstract
Developing a simple analytical method suitable for therapeutic drug monitoring in a clinical setting is key to establishing guidelines on accurate dose administration and the advancement of precision medicine. We devised a simple rapid analytical method through the combination of streptavidin-modified microparticles and a time-resolved fluorescence immunoassay for therapeutic drug monitoring. The analytical performance of this method was investigated and validated using clinical samples. By determination of doxorubicin concentration, the proposed assay has shown a satisfactory linear range of detection (3.8–3000 ng mL−1) with a limit of detection of 3.8 ng mL−1 and an IC50 of 903.9 ng mL−1. The intra and inter-assay coefficients of variation were 4.12–5.72% and 5.48–6.91%, respectively, and the recovery was acceptable. The applicability of the proposed assay was assessed by comparing the determined results with those measured by LC-MS/MS, presenting a satisfactory correlation (R2 = 0.9868). The proposed assay, which shows satisfactory analytical performance, has great potential for application in the field of TDM in the future.
1. Introduction
Cancer is a leading cause of death worldwide. An estimated 4.2 million new cancer cases and 2.8 million cancer deaths occurred in China in 2015.1,2 In the next few years, the global cancer burden will continue to rise owing to increasing cancer diagnoses because of the aging population and increased susceptibility to cancers. Consequently, the demand for chemotherapy treatments will increase to at least twice that of the current level over the next 10 years. It is certain that chemotherapy will remain an essential treatment for cancer patients. However, most of the commonly used anticancer drugs have some disadvantages that limit their use, such as: (i) a narrow therapeutic window requiring more rigid drug administration to balance anti-cancer efficacy and side effects; (ii) high individual variability in drug metabolism and distribution making it difficult to achieve effective therapeutic concentration; (iii) no available practical guidance or suitable parameters to evaluate the clinical efficacy and a lack of standardized regimes for long-term application; (iv) dose-dependent side effects.3Inaccurate clinical dosing of anticancer drugs prevails throughout the world, and the situation in China is particularly severe. Therapeutic drug monitoring (TDM), first proposed in the 1980s, which involves the measurement and interpretation of systemic drug concentrations in biological fluids and the individualization of drug dosage or schedules to maximize therapeutic effects and minimize toxicity,4 has been applied in antibiotics,5 antiepileptics,6 antipsychotics,7 and anticancer agents for decades.8 TDM of anticancer drugs has been discussed for many cases,9,10 and findings have shown that TDM of anticancer drugs helped to make timely dose adjustments during the period of chemotherapy. It was also indicated that human intervention in dosing management elevated clinical efficacy by minimizing side effects and enhancing precise individualized administration. In the push for precision medicine and personalized treatment, establishing guidelines for individualized dosing is imperative and urgently needed to achieve precision medicine under the guidance of drug monitoring.
Doxorubicin (DOX, Adriamycin), a typical anthracycline antibiotic, is widely used for treating various cancers, in particular breast, ovarian, leukemia, prostate, brain and lung cancers.11 In addition, DOX is one of the frontline drugs currently used for adjuvant chemotherapy treatment of advanced breast cancer. However, long-term clinical use of DOX is hampered by its multidirectional cytotoxic effects, with cardiotoxicity being the most prominent. Although the current evidence is insufficient to mandate TDM of DOX in routine practice,12 many cases have indicated that TDM of DOX in biological fluids can reduce side effects and optimize clinical efficacy.3,9,10,13,14 To date, a number of analytical methods such as high performance liquid chromatography (HPLC),15 high performance liquid chromatography mass spectroscopy/mass spectroscopy (LC-MS/MS) alone16,17 or combined with capillary electrophoresis (CE)18 or optical LED imaging, fluorescence spectroscopy,19,20 electrochemical sensors21 and bioluminescent sensors,22 have been developed for determination of DOX in biological samples. However, all these analytical methods are inappropriate for TDM of DOX chemotherapy in daily clinical practice. The methods have their individual merits, however most of them are not available or practical for daily use in a clinical laboratory owing to the high capital cost and high technical requirements. In addition, most of them require expensive detection equipment and a professional operator.
As a widely used testing technology for daily clinical practice, TRFIA is an ultrasensitive tool that has been shown to be highly specific and sensitive in many cases of clinical diagnosis. With its favorable high precision, it is widely used in different quantitative detections and generally recognized in the field of laboratory medicine. The lanthanide chelates applied in TRFIA have exceptionally large Stokes shift (>200 nm), decay time (>500 ns) and quantum yield, which make it possible to eliminate background interference from nonspecific fluorescence. Europium is one of the most frequently used lanthanide chelates and it was used here to label the competitive antigen. Magnetic microparticle-based TRFIA is a development of general TRFIA that has been reported for different applications such as cancer,23,24 infectious disease,25,26 and prenatal screening27 and fits well in routine detection owing to advantages such as high precision, ultra-sensitivity, and its simple automated procedure. In addition, magnetic microparticles have high specific surface area and can be rapidly collected and separated from superfluous analytes in a magnetic field, shortening reaction time by increasing the fluid exchange and automation of the washing and separation process.
Herein, we established a promising TRFIA detection system using magnetic microparticles as a carrier for streptavidin (SA). Taking advantage of the versatile biotin-streptavidin system (BSAS),28 a classical signal amplified system, which has been widely used in biomedical detection, we were able to improve the sensitivity of the detection as SA-MPs could bind more antibodies through the strong biotin–streptavidin interaction.29 Thus, we have developed a novel TRFIA determination system, which was applied in TDM and was validated for daily detection in routine TDM. The study involved measurement of parameters such as sensitivity, precision, recovery, linearity, and feasibility.
2. Materials and methods
2.1 Ethics
All experiments were performed in compliance with relevant laws and followed by institutional guidelines of Southern medical university (Guangzhou, China). The BALB/c mice used in this study were obtained from the Experimental Animal Center, Southern Medical University (Guangzhou, China). This study was approved and registered (Grant No. 44002100013613) by the laboratory animal welfare and ethics committee of Southern Medical University (Guangzhou, China). The care and use of the animals conformed to the Institutional Animal Ethics Committee guidelines. The experimental materials and solutions used are listed in the ESI.†2.2 Preparation of DOX-conjugate immunogen and coating antigen
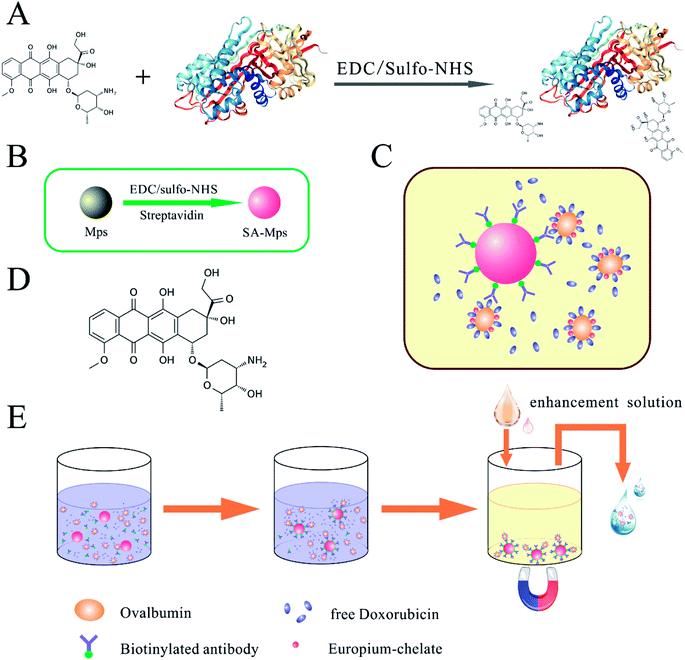
For immunization and preparation of anti-DOX antibody, conjugation to the carrier protein KLH was required. 20 mg of KLH were dissolved in binding buffer to give a final concentration of 20 mg mL−1 and 1 mg of DOX in PBS (0.1 M, pH 7.2) was added to give a final concentration of 5 mg mL−1 in two 2 mL centrifuge tubes. After adding 100 μL of conjugating reagent A and 120 μL of conjugating reagent B to the KLH solution, we uniformly mixed and rotated the mixture for 30 min at RT for activation of the carboxyl groups. The activated protein solution was centrifuged at 14![[thin space (1/6-em)]](https://www.rsc.org/images/entities/char_2009.gif) 000 rpm for 20 min at 4 °C, and the supernatant was collected, dialyzed and concentrated to 50 mg mL−1. DOX solution was subsequently added to the collected solution, and the mixture was gently rotated overnight at RT and dialyzed against PBS (0.01 M, pH 7.2) for 48 h. Competitive antigens were designed to use OVA or HSA as a carrier protein and were prepared using a similar method. A graphic illustration of the coupling procedure is shown in Fig. 1A. The conjugated immunogen and competitive antigen were identified by SDS-PAGE and ultraviolet-visible spectroscopy (UV-VIS), then lyophilized and stored at −20 °C in the dark before use.
000 rpm for 20 min at 4 °C, and the supernatant was collected, dialyzed and concentrated to 50 mg mL−1. DOX solution was subsequently added to the collected solution, and the mixture was gently rotated overnight at RT and dialyzed against PBS (0.01 M, pH 7.2) for 48 h. Competitive antigens were designed to use OVA or HSA as a carrier protein and were prepared using a similar method. A graphic illustration of the coupling procedure is shown in Fig. 1A. The conjugated immunogen and competitive antigen were identified by SDS-PAGE and ultraviolet-visible spectroscopy (UV-VIS), then lyophilized and stored at −20 °C in the dark before use.
2.3 Preparation of anti-doxorubicin antibody
Six 6 week-old female BALB/c mice were subcutaneously immunized with 200 μg of DOX-KLH conjugate in Freund's complete adjuvant. Immunization was repeated with the same dose two further times for reinforcement at 3 week intervals. The previously prepared DOX–OVA conjugated antigen was coated in 96-well plates with 600 ng per well in coating buffer at 4 °C overnight, then blocked with gelatin blocking buffer at 4 °C overnight, lyophilized and stored at 4 °C before use. The titer of anti-DOX serum was tested using ELISA in series dilutions along with a negative control and a blank control. The antibody was then obtained from positive serum and purified using saturated ammonium sulfate precipitation and filtration chromatography and stored at −20 °C for further use.2.4 Synthesis of SA-MPs
Streptavidin-modified microparticles (SA-MPs) were synthesized by optimization of a previously reported technique (Fig. 1B).23 The carboxyl-modified MPs (CmMPs) were washed five times with binding buffer before activation of the carboxyl groups. 50 μL of fresh conjugating reagent A and 80 μL of conjugating reagent B were then added to a suspension of 10 mg of CmMPs, with a concentration of 100 mg mL−1 (10.0 × 10⁹ mL−1 in sterilized water) in a total volume of 1 mL of binding buffer, and rotated end-over-end for 30 min at RT. Activated CmMPs were then removed from the magnetic field and washed three times to remove excess reagents. Subsequently, 500 μg of purified streptavidin in 1 mL binding buffer was added to the activated CmMPs and vertically mixed, gently rotating overnight at 25 °C. After washing three times with stock buffer to remove excess, the SA-MPs were blocked with stock buffer for 2 h at RT, then stored in the same solution at 4 °C until use.2.5 Biotinylation of antibody
The biotinylation was carried out according to the product instructions for sulfo-NHS-LC-Biotin. 500 μg of anti-DOX polyclonal antibody previously acquired from antiserum, was added to 25-fold molar excess of sulfo-NHS-LC-Biotin solution in a total volume of 0.5 mL, and the mixture was gently mixed for 1 h in the dark at RT. After the reaction, the mixture was dialyzed to remove the excess sulfo-NHS-LC-Biotin. Both previous and subsequent buffer exchange was performed using a 50KD-ultrafiltration tube (Amicon Ultra-0.5, Millipore) by washing 6–8 times with PBS buffer (pH 7.4). The purified biotinylated antibody was added to 0.1% BSA and 0.1% sodium azide and stored at 4 °C, away from light.2.6 Preparation of lanthanide-labeled competitive antigen
The DOX–OVA conjugate was prepared as described in the previous section and used as the competitive antigen of DOX in this analytical method. Following an established approach for the synthesis of Eu3+ chelate-labeling, first, 500 μg of purified DOX–OVA conjugate was redissolved in 200 μL of labeling buffer. Ultrafiltration tubes (Amicon Ultra-0.5, 10KD, Millipore) were then used to wash 6 times with labeling buffer while centrifuging at 9500 rpm for 6 min, the sample was recovered and centrifuged at 3000 rpm for 3 min to collect the proteins after the last wash. 100 μg of DTTA-Eu3+ chelate was then added to the DOX–OVA conjugate solution. After complete mixing, the mixture was incubated gently for 18–20 h at RT away from light. On the following day, excess Eu3+-chelates were separated from the target labeled protein on a Sephadex G-50 column (1.5 cm × 40 cm). The synthesized and purified Eu3+ labeled DOX–OVA antigens were kept stable for 12 months by adding 0.1% BSA as a stabilizer.2.7 Standard, quality control, and clinical serum samples
DOX was dissolved in DI water at a concentration of 200 μg mL−1 to give a working solution. DOX standards with seven concentrations were prepared by diluting the working solution with standard buffer to give standards with the following concentrations: 0, 50, 100, 250, 500, 750, 1500, and 3000 ng mL−1. Quality Control samples (QCs) were prepared in low, medium, and high concentrations, by spiking 10 mL of blank serum with DOX working solution to give final concentrations of 100, 500, and 1000 ng mL−1, respectively. Thirty-two clinical serum samples containing doxorubicin from cancer patients under adjuvant therapy were generously provided by Nan-fang Hospital (Guangzhou, China). Twenty cases of blank serum samples and blank urine samples from healthy volunteers were also collected and tested. Negative samples were then pooled as blank solvent to assess the matrix effect. Verbal informed consents were obtained by all participants.2.8 Assay procedures
We performed this novel SA-MP-based TRFIA method using an indirect competitive inhibition method for determination of doxorubicin in human serum or urine. Schematic illustration of SA-MP-based TRFIA is provided in Fig. 1. Before the test, some preliminary treatments were carried out as follows: 96-well plates were blocked with blocking buffer containing 5% BSA at 4 °C overnight, lyophilized the following day and stored at 4 °C until use. SA-MPs were diluted with stock solution to a concentration of 500 μg mL−1 as a working solution. In the determination of DOX concentration, homogenic SA-MPs were added to the blocked 96-well plate, 25 μL per well, followed by biotinylated anti-DOX antibody diluted solution, 50 μL per well, at a dilution ratio of 1/2000 for serum samples and 1/4000 for calibrations. A series of standards or test samples were then added, 25 μL per well. Finally, Eu3+ labeled DOX–HSA was diluted to a ratio of 1/400 and the diluted solution was added (50 μL per well). Then the mixture was incubated under vibration at 37 °C for 1 h. During the process of detection, all dilutions were prepared with assay buffer. The assay was carried out in triplicate.2.9 Validation of the proposed model
The mean and standard deviations (SD) of the fluorescence measurements were calculated at the zero point (0 ng mL−1) on the standard curves for 10 duplicates. Sensitivity was calculated as the concentration corresponding to the value of mean − 2 × SD, as determined via the standard curve. After determining the background response produced by nonspecific binding by the SA-MP-based TRFIA method, three spiked amounts of DOX (100, 500, and 1000 ng) were added to the known samples (25.2, 516.5, and 1020.1 ng mL−1), and the recovery was calculated as the ratio of each observed value to its expected value ((OV/EV) × 100%). The intra- and inter-assay precisions were determined from measurements obtained by analyzing three QC samples including low (QC-1, 100 ng mL−1), medium (QC-2, 500 ng mL−1) and high (QC-3, 1000 ng mL−1) concentration. This assay was carried out ten times for the intra-assay and in triplicate for the inter-assay. Analogues that are structurally related to DOX, including epirubicin (EPI) and daunorubicin (DAU), were tested for cross-reactivity. In this case, other anticancer drugs subsequently used or used in combination including 5-fluorouracil (5-FU), paclitaxel (PTX), docetaxel (DTX) and cisplatin (Pt) were also tested.2.10 Statistics
Data analysis was performed using Statistical Product and Service Solutions (SPSS) software (version 20.0, SPSS Inc., Chicago, IL). A two-tailed test was applied for statistical analysis in all tests with alpha level set at α = 0.05. A P value of less than 5% (P < 0.05) was considered statistically significant. The dose–response curve under double-logarithm fit using Origin Pro7.5 (GE, Piscataway, NJ, USA) was log(Y) = B + A × log(X), specifically, log(Y) = [(B/B0)/(1 − B/B0)], where B is the corresponding fluorescence value (FV), B0 is the FV of the zero-point, and X is the concentration of DOX in the test samples.2.11 LC-MS/MS procedure
The LC-MS/MS method was based on several previous reports16,30,31 with slight adjustments, using DAU as an internal standard (IS). The working solution was diluted into working standards (0, 1, 10, 50, 100, 500, and 1000 ng mL−1). Each standard sample was spiked with IS to give a final concentration of 200 ng mL−1. An extraction procedure previously shown to have satisfactory recovery, was used to extract DOX from the serum samples15 (see details in ESI†). Mass analysis was performed on API 3200 triple quadrupole tandem mass spectrometers following HPLC separation. The results were analyzed by ABI Analyst® Software.3. Results
3.1 Identification of synthetic antigens
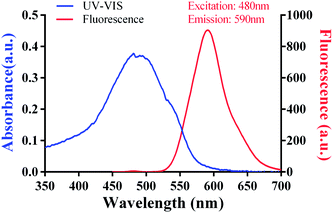
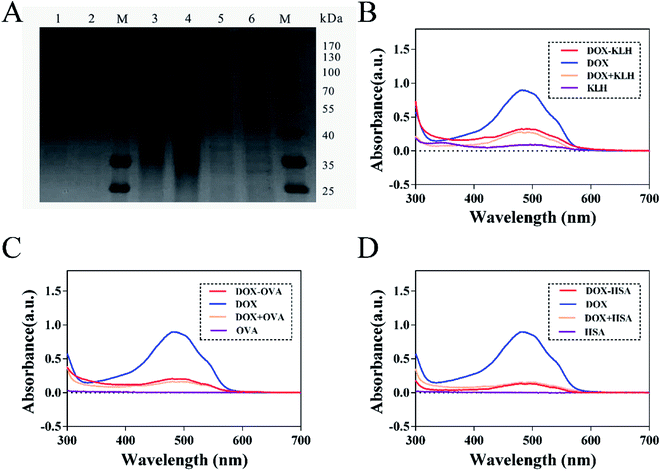
The fluorescence characteristics and UV-VIS spectrum of doxorubicin are shown in Fig. 2 and its molecular structure is shown in Fig. 1D. The maximum absorption of DOX is at 495 nm and the excitation and emission wavelengths were at 495 and 595 nm, respectively. The purified DOX-conjugated antigens were identified by SDS-PAGE (Fig. 3A) and UV-VIS spectroscopy (Fig. 3B–D) using blank carrier proteins as a blank control, which indicated a satisfactory coupling. Because the DOX–KLH conjugate was too large to run SDS-PAGE and MALDI-TOF MS, it was fully purified by dialysis and characterized by UV-VIS spectroscopy, identifying the characteristic UV absorption of DOX. Both the DOX–OVA conjugate and DOX–HSA conjugate were presented with two protein bands, with one band in line with the corresponding blank carrier protein and the other one below the blank carrier protein, indicating the existence of both linked product and unlinked carrier protein. This result indicated that the conjugation of tens of DOX molecules might alter the hydrophobicity of the surface and interfere with the surface-charges of the protein complex, speeding up their electrophoretic rate. UV-VIS spectroscopy of all three drug-conjugated proteins showed that the protein complexes gained the characteristic absorption peak of DOX at 495 nm. Unlinked protein carriers set as blank controls showed no absorbance at 495 nm. The molar coupling ratio of DOX/carrier protein was calculated with the following formula (Conc. is an abbreviation of concentration)The molar coupling ratio of DOX/KLH was calculated to be 1/42. The molar coupling ratios of DOX/OVA and DOX/HSA were 1/10 and 1/12, respectively.
3.2 Identification of antibody
The titer of anti-DOX serum was tested by ELISA (Table 1) and the serum of mouse I was purified for further use. We found the anti-DOX antibody prepared had high cross-reactivity (CR) to its isomer, EPI, and other anthracyclines, and little CR to other common combination drugs (Table 2). The CR to EPI was 97.7% with an IC50 of 899.5 ng mL−1 and the CR to DAU was 107.5% with an IC50 of 840.6 ng mL−1. Since anthracyclines are applied singly in clinical use, the detection of DOX would not be affected by its CR with other anthracyclines. For better analytical performance and specificity, we would screen monoclonal antibody, which is specific to DOX, and scale-up the preparation.| Dilutions | ODa (450 nm) | |||||
|---|---|---|---|---|---|---|
| I | II | III | IV | V | VI | |
| a OD: optical density.b I–VI: ID of BALB/c mice. | ||||||
| 1/1000 | 3.021 | 2.677 | 1.699 | 2.899 | 1.811 | 2.567 |
| 1/2000 | 2.425 | 1.344 | 0.924 | 1.674 | 1.021 | 1.429 |
| 1/4000 | 1.875 | 0.782 | 0.482 | 1.033 | 0.622 | 0.986 |
| 1/8000 | 0.877 | 0.53 | 0.202 | 0.577 | 0.321 | 0.603 |
1/16![[thin space (1/6-em)]](https://www.rsc.org/images/entities/char_2009.gif) 000 000 |
0.325 | 0.238 | 0.182 | 0.312 | 0.233 | 0.344 |
1/32![[thin space (1/6-em)]](https://www.rsc.org/images/entities/char_2009.gif) 000 000 |
0.193 | 0.199 | 0.191 | 0.206 | 0.197 | 0.188 |
| Negative control | 0.198 | 0.201 | 0.192 | 0.191 | 0.187 | 0.205 |
| Blank control | 0.051 | 0.049 | 0.053 | 0.05 | 0.058 | 0.047 |
3.3 Optimization experiments
The coupling ratio of SA was calculated to be 67% according to the following formula:| Coupling ratio = ((supernatant protein concentration (μg mL−1)) × volume (mL)/500) × 100% |
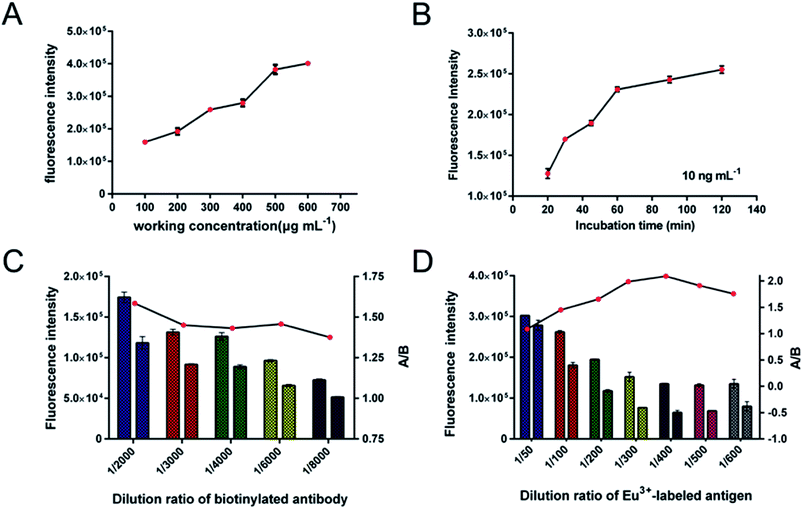
The optimum reaction conditions for the proposed SA-MP-based TRFIA method for determination of DOX in human samples were investigated to optimize performance. In this case, we devised several experiments to find the most suitable reaction conditions, including working concentration of SA-MPs applied, incubation time, and dilution ratio of biotinylated anti-DOX antibody and Eu3+-labeled competitive antigen. All optimum reaction conditions were chosen based on appropriate fluorescence value (FV) and the highest FV ratio of A/B (A – 250 ng mL−1, B – 1500 ng mL−1). To ensure the sensitivity, a low concentration of DOX standard sample (QC-1, 100 ng mL−1) and excess biotinylated anti-DOX antibody and Eu3+-labeled antigen, were applied in a two-step reaction. The reaction volume of SA-MPs was fixed at 25 μL. The sensitivity was investigated with working concentrations of SA-MPs (100, 200, 300, 400, 500, and 600 μg mL−1) and tested following incubation for 60 min, and the results are shown in Fig. 4A, indicating that the best working concentration of SA-MPs was 500 μg mL−1. The assay was tested at different incubation time points using 500 μg mL−1 SA-MPs as a working concentration with excess antibody and Eu3+-labeled antigen in a one-step reaction. The results showed that the optimum incubation time was 60 min (Fig. 4B). The optimum dilution ratio of biotinylated anti-DOX antibody and Eu3+-labeled antigen were also investigated using a series of diluted spiked serum samples. The results were plotted as a multiple bar chart (Fig. 4C and D) and the optimum dilution ratios of biotinylated anti-DOX antibody and Eu3+-labeled antigen for serum samples were found to be 1/2000 and 1/400, respectively.
3.4 Dilution curve and matrix effect
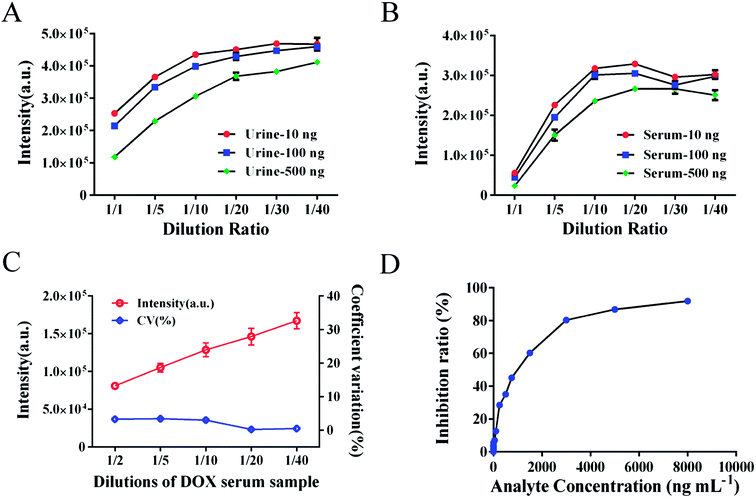
The suitable dilution ratio of DOX-spiked urine or serum samples was investigated (Fig. 5A and B). Based on the dilution curve, dilutions from 1/5 to 1/10 were a suitable choice for good stability and a reduced matrix effect. To avoid the interference of the matrix effect, the dilution ratio of biotinylated anti-DOX antibody for calibration standards in standard buffer was also investigated by comparing the intensity of standards in spiked serum samples. The dilutions of antibody were 1/2000 in serum samples and 1/4000 in standard buffer. However, the matrix effect in urine samples remains an unsolved problem for large variations in detection, the elimination of which requires further investigation.3.5 Analytical performance
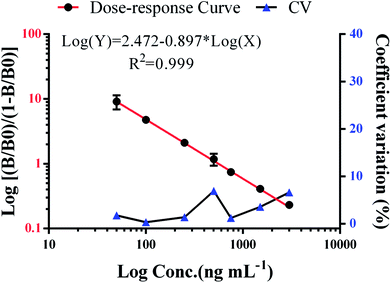
We have demonstrated a novel analytical method, which is rapid, applicable, and was successfully validated using clinical serum samples. The presented method combines the convenience and efficiency of captured carrier SA-MPs and the benefits of a time-resolved fluorescence immunoassay. The analytical performance of the SA-MP-based TRFIA was demonstrated by a wide detection range, ultra-sensitivity, and satisfactory precision and recovery. Actual clinical serum samples containing DOX were diluted from 1/2 to 1/40 and the dilution curve in Fig. 5C shows satisfactory linearity and little variation. The inhibition curve of free DOX is shown in Fig. 5D with an IC50 value of 903.9 ng mL−1. Dose–response curve of spiked standard samples is given in Fig. 6 with an R2 value of 0.999. The analytical sensitivity of this proposed method was 3.8 ng mL−1 and the linear range of detection was from 3.8 to 3000 ng mL−1, which covers the quantification requirements of routine drug monitoring. The intra- and inter-assay coefficients of variation were 4.12–5.72% and 5.48–6.91%, respectively (Table 3). The recovery was from 94.3% to 108.3% (Table 4). The performance of the proposed method satisfied the reagent requirements.| Samples | Concentration (ng mL−1) | Mean ± SD (ng mL−1) | CV (%) | |
|---|---|---|---|---|
| a CV: coefficient variation. | ||||
| Intra-assay (*10) | QC-1 | 100 | 99.80 ± 4.11 | 4.12 |
| QC-2 | 500 | 507.08 ± 28.59 | 5.63 | |
| QC-3 | 1000 | 1015.82 ± 58.14 | 5.72 | |
| Inter-assay (*5) | QC-1 | 100 | 106.40 ± 7.35 | 6.91 |
| QC-2 | 500 | 512.82 ± 28.10 | 5.48 | |
| QC-3 | 1000 | 984.64 ± 64.17 | 6.51 | |
| Samples (ng mL−1) | Spiked DOX (ng) | Value (ng mL−1) | Recovery (%) | |
|---|---|---|---|---|
| Expected | Observed | |||
| Sample A | ||||
| 25.2 | 100 | 125.2 | 131.6 | 105.1 |
| 500 | 525.2 | 495.3 | 94.3 | |
| 1000 | 1025.2 | 1064.7 | 103.8 | |
![[thin space (1/6-em)]](https://www.rsc.org/images/entities/char_2009.gif) |
||||
| Sample B | ||||
| 516.5 | 100 | 616.5 | 582.1 | 94.4 |
| 500 | 1016.5 | 1057.5 | 104 | |
| 1000 | 1516.5 | 1476.3 | 97.3 | |
![[thin space (1/6-em)]](https://www.rsc.org/images/entities/char_2009.gif) |
||||
| Sample C | ||||
| 320.1 | 100 | 420.1 | 453.9 | 108 |
| 500 | 820.1 | 780.5 | 95.1 | |
| 1000 | 1320.1 | 1367.4 | 103.5 | |
3.6 Comparison with LC-MS/MS assay
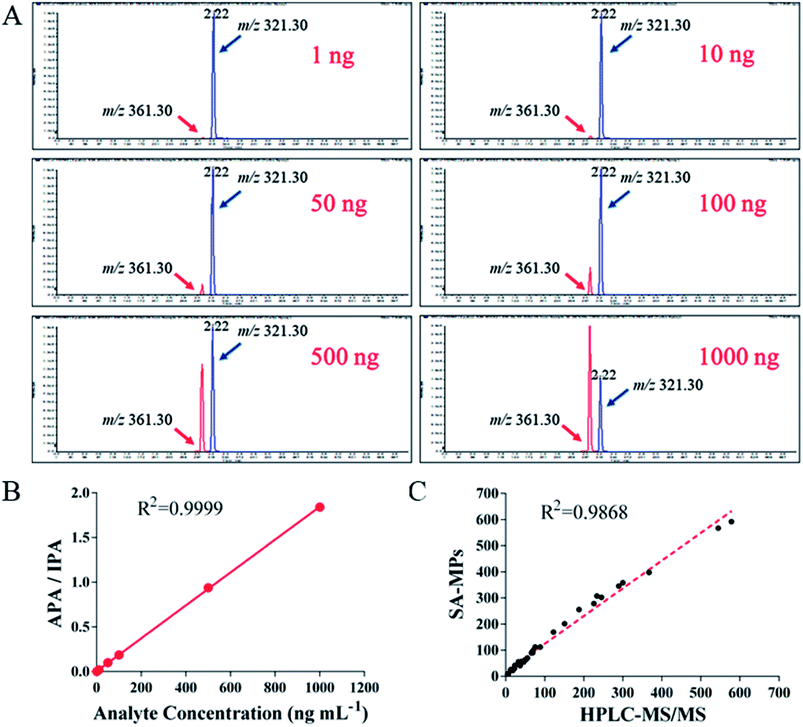
Clinical serum samples were analyzed using SA-MP-based TRFIA and LC-MS/MS simultaneously. All data were plotted and the correlation between the concentrations detected by the two methods is presented in Fig. 7. The peak for the quantified ion of calibration with m/z value of 361.30 is given in Fig. 7A, and the peak of the IS product ion is also given with an m/z value of 321.30 (Table 5). The LC-MS/MS calibration curve is presented in Fig. 7B, with the ratio of analyte peak area/IS peak area on the y-axis and the analyte concentration on the x-axis with an R2 value of 0.9999. The linear correlation between the two methods was good (R2 = 0.9868, Fig. 7C). The results indicated the SA-MP-based TRFIA has satisfactory analytical performance and is comparable with the LC-MS/MS method for determination of DOX concentration in human serum samples. However, the application in urine samples was limited by fluctuations in the acidity or alkalinity causing large variations during the assay. It is possible that this pH interference could be attenuated by sample dilution, however this requires further investigation for confirmation.| Compounds | Doxorubicin | Daunorubicin |
|---|---|---|
| a a – Quantified ion, b – qualified ion. | ||
| Mass | 544 | 528 |
| Product ion | 361a | 321 |
| 397b | ||
4. Discussion
Many of the available analytical methods capable of high sensitivity have other disadvantages making them inappropriate for use in routine TDM. Currently, mass spectrometry remains the most reliable and precise analytical method for quantification of chemicals in many fields. However, LC-MS/MS is still used mostly in scientific research and its application in clinical testing is limited by its involved sample treatment. It also requires demanding technical training and expensive equipment, which impedes its application in fundamental hospitals. In contrast, magnetic microparticle-based immunoassays are simple and can be easily developed into an automated detection platform, thereby bringing significant convenience to routine practice and limiting the variability resulting from manual operation in a clinical laboratory. There are several immunoassays based on enzyme-linked immunosorbent assay (ELISA) or immune turbidimetry being used in detection of anticancer drugs, which are well-developed but time-consuming, and have short detection range, insufficient precision, and unsatisfactory analytical sensitivity.32 Compared with ELISA, TRFIA has clear advantages such as a wide detection range and high sensitivity.33 Many pharmacokinetics reports indicate that the concentration of DOX after infusion could be 1000 ng mL−1 or even higher,34–37 which challenges the applicability of ELISA. Pleasingly, the developed SA-MP-based TRFIA is a refinement of traditional TRFIA23 and presents excellent performance in detection of DOX. In this study, the large determination range of target drug possible with the analytical method, satisfies the demand of quantifying all target concentrations. Electrochemical immunoassay is also referenced as its high sensitivity and simple equipment. Many modified electrochemical immunoassays using different labels such as [Ru(bpy)3]3+,38,39 gold nanoparticles (AuNPs)40,41 and quantum dots42 or label-free electrochemical immunosensor43,44 have been developed at the research level. However, it is not likely to be performed multiple labelling which limits the use of simultaneous detection of multiple biomarkers. In this aspect, our developed SA-MP-based TRFIA can be further applied in simultaneous detections.By virtue of its simplicity and excellent analytical performance, this developed analytical method could be used for real-time drug monitoring in the clinic to reduce the burden on clinical workers and the harm caused by unnecessary dosing of cancer patients. With facile screening, doses can be adjusted accordingly to keep the concentration within the target range through real-time monitoring of the drug concentration in targeted biological fluids, and estimating specific drug metabolism and tolerance in individuals in specific situations. This could contribute to the optimization and expansion of precision medicine in chemotherapy, which has significant promise for future application.
As a simple and automated analytical technology, our developed SA-MP-based TRFIA is expected to help in achieving the popularization of TDM because we can provide objective reference data for clinical practitioners to rapidly make individual dosage adjustments for patients. These useful data can also assist medical staff in analyzing individual pharmacokinetic differences among groups with different traits based on gender, age, somatotype, and even genotype. However, there remain many reasons why TDM has not been fully implemented in daily clinical practice. Primarily these involve the challenge of establishing the safe range of appropriate target drug concentration and therapeutic indices for different populations, and the combination strategies of multiple drugs in clinical use, which further increases the complexity in the refinement of guidelines.
To address the former, we have developed an efficient analytical method for TDM of anticancer drugs. Based on this novel analytical method, we envision a blueprint to clarify the individual factors, both at the genetic level and overall physical level, that play an important role in the metabolism of anticancer drugs, by collecting and analyzing more clinical data and metabolic differences. We would then help to establish a general TDM guideline for further application to achieve precision personalized medicine.
Moreover, since many chemotherapy drugs are co-used in treatment, it would be possible for us to further develop a reagent for simultaneous determination of two drugs or simultaneous monitoring of one particular drug and its relevant biomarkers, reflecting the toxicity caused by this drug. Dual-labeling has been applied in various fields and is convenient for the detection of multiple biomarkers in in vitro diagnostics. Europium chelate is the most frequently used label in TRFIA, followed by samarium chelate and terbium chelate. By using different labels such as europium chelate and samarium chelate that have advantages such as narrow emission spectra and lack of fluorescence spectra overlap between one another, we would be able to devise ultrasensitive simultaneous determination.
5. Conclusions
In this study, we have developed a simple, rapid, and ultrasensitive analytical method that was applied in the field of TDM for anticancer drugs. Using the example of DOX, we have successfully developed an effective analytical method for real-time TDM of anticancer drugs in human biological fluids, via the combination of versatile easily separated SA-MPs and the demonstrated consistency of time-resolved fluorescence immunoassay. This analytical method has significant potential in the application of future TDM. The extension of the assay to the simultaneous detection of multiple drug combinations or monitor-required biomarkers is currently under investigation.Conflicts of interest
None.Abbreviations
| TDM | Therapeutic drug monitoring |
| DOX | Doxorubicin hydrochloride |
| CmMPs | Carboxyl-modified magnetic microparticles |
| SA-MPs | Streptavidin-modified magnetic microparticles |
| TRFIA | Time-resolved fluorescence immunoassay |
| BSAS | Biotin-streptavidin system |
| LC-MS/MS | Liquid chromatography tandem mass spectrometry |
| MES | 4-Morpholineethanesulfonic acid |
| sulfo-NHS | N-Hydroxysulfosuccinimide |
| EDC | 1-Ethyl-3-(3-dimethylaminopropyl) carbodiimide hydrochloride |
| KLH | Keyhole limpet hemocyanin |
| HSA | Human serum albumin |
| SA | Streptavidin |
| OVA | Ovalbumin |
| BSA | Bovine serum albumin |
| RT | Room temperature |
Acknowledgements
The authors are grateful to the support of The National Natural Science Foundation of China [Grant No. 81702072 and No. 21575058] and China Postdoctoral Science Foundation [Grant No. 2016M600662].References
- W. Chen, R. Zheng, P. D. Baade, S. Zhang, H. Zeng, F. Bray, A. Jemal, X. Q. Yu and J. He, CA: Cancer J. Clin, 2016, 66, 115–132 CrossRef PubMed.
- R. L. Siegel, K. D. Miller and A. Jemal, Ca-Cancer J. Clin., 2016, 66, 7–30 CrossRef PubMed.
- A. J. Galpin and W. E. Evans, Clin. Chem., 1993, 39, 2419–2430 CAS.
- M. J. Moore and C. Erlichman, Clin. Pharmacokinet., 1987, 13, 205–227 CrossRef CAS PubMed.
- T. Tangden, V. Ramos Martin, T. W. Felton, E. I. Nielsen, S. Marchand, R. J. Bruggemann, J. B. Bulitta, M. Bassetti, U. Theuretzbacher, B. T. Tsuji, D. W. Wareham, L. E. Friberg, J. J. De Waele, V. H. Tam, J. A. Roberts, t. P. Infection Section for the European Society of Intensive Care Medicine, M. Pharmacodynamics Study Group of the European Society of Clinical, t. I. S. o. A.-I. P. Infectious Diseases and M. the Critically Ill Patients Study Group of European Society of Clinical and D. Infectious, Intensive Care Med., 2017, 43, 1021–1032 CrossRef CAS PubMed.
- S. C. van Dijkman, S. G. Wicha, M. Danhof and O. E. Della Pasqua, Clin. Pharmacol. Ther., 2018, 103, 663–673 CrossRef PubMed.
- J. W. Newcomer and M. J. Sernyak, J. Clin. Psychiatry, 2007, 68, e17 CrossRef PubMed.
- N. Widmer, C. Bardin, E. Chatelut, A. Paci, J. Beijnen, D. Levêque, G. Veal and A. Astier, Eur. J. Cancer, 2014, 50, 2020–2036 CrossRef CAS PubMed.
- Y. Y. Hon and W. E. Evans, Clin. Chem., 1998, 44, 388–400 CAS.
- A. Paci, G. Veal, C. Bardin, D. Levêque, N. Widmer, J. Beijnen, A. Astier and E. Chatelut, Eur. J. Cancer, 2014, 50, 2010–2019 CrossRef CAS PubMed.
- S. C. Piscitelli, K. A. Rodvold, D. A. Rushing and D. A. Tewksbury, Clin. Pharmacol. Ther., 1993, 53, 555–561 CrossRef CAS PubMed.
- B. E. Levis, P. F. Binkley and C. L. Shapiro, Lancet Oncol., 2017, 18, e445–e456 CrossRef CAS PubMed.
- B. Gao, S. Yeap, A. Clements, B. Balakrishnar, M. Wong and H. Gurney, J. Clin. Oncol., 2012, 30, 4017–4025 CrossRef CAS PubMed.
- A. Rousseau and P. Marquet, Fundam. Clin. Pharmacol., 2002, 16, 253–262 CrossRef CAS PubMed.
- S. R. Urva, B. S. Shin, V. C. Yang and J. P. Balthasar, J. Chromatogr. B: Anal. Technol. Biomed. Life Sci., 2009, 877, 837–841 CrossRef CAS PubMed.
- S. Ibsen, Y. Su, J. Norton, E. Zahavy, T. Hayashi, S. Adams, W. Wrasidlo and S. Esener, J. Mass Spectrom., 2013, 48, 768–773 CrossRef CAS PubMed.
- C. Sottani, G. Tranfo, M. Bettinelli, P. Faranda, M. Spagnoli and C. Minoia, Rapid Commun. Mass Spectrom., 2004, 18, 2426–2436 CrossRef CAS PubMed.
- J. B. Katzenmeyer, C. V. Eddy and E. A. Arriaga, Anal. Chem., 2010, 82, 8113–8120 CrossRef CAS PubMed.
- E. I. El-Kimary and A. F. El-Yazbi, Spectrochim. Acta, Part A, 2016, 163, 145–153 CrossRef CAS PubMed.
- Y. Liu and B. Danielsson, Anal. Chim. Acta, 2007, 587, 47–51 CrossRef CAS PubMed.
- E. Haghshenas, T. Madrakian and A. Afkhami, Anal. Bioanal. Chem., 2016, 408, 2577–2586 CrossRef CAS PubMed.
- R. Griss, A. Schena, L. Reymond, L. Patiny, D. Werner, C. E. Tinberg, D. Baker and K. Johnsson, Nat. Chem. Biol., 2014, 10, 598–603 CrossRef CAS PubMed.
- J. Y. Hou, T. C. Liu, G. F. Lin, Z. X. Li, L. P. Zou, M. Li and Y. S. Wu, Anal. Chim. Acta, 2012, 734, 93–98 CrossRef CAS PubMed.
- G. Lin, H. Zhao, T. Liu, J. Hou, Z. Ren, W. Huang, W. Dong and Y. Wu, RSC Adv., 2014, 4, 55229–55236 RSC.
- Z. Q. Ren, T. C. Liu, J. Y. Hou, M. J. Chen, Z. H. Chen, G. F. Lin and Y. S. Wu, Luminescence, 2014, 29, 591–597 CrossRef CAS PubMed.
- J. W. Zhou, L. M. Lei, Q. N. Liang, T. C. Liu, G. F. Lin, Z. N. Dong, R. L. Liang, Z. H. Chen and Y. S. Wu, Clin. Biochem., 2015, 48, 603–608 CrossRef CAS PubMed.
- J. Y. Hou, T. C. Liu, Z. Q. Ren, M. J. Chen, G. F. Lin and Y. S. Wu, Analyst, 2013, 138, 3697–3704 RSC.
- E. P. Diamandis and T. K. Christopoulos, Clin. Chem., 1991, 37, 625–636 CAS.
- X. Dai, H. Xu, X. Zhang, W. Zhu, H. Gu and M. Wei, Mater. Sci. Eng., C, 2014, 34, 422–428 CrossRef CAS PubMed.
- C. Sottani, G. Poggi, F. Melchiorre, B. Montagna and C. Minoia, J. Chromatogr. B: Anal. Technol. Biomed. Life Sci., 2013, 915–916, 71–78 CrossRef CAS PubMed.
- W. Ma, J. Wang, Q. Guo and P. Tu, J. Chromatogr. B: Anal. Technol. Biomed. Life Sci., 2015, 1007, 18–22 CrossRef CAS PubMed.
- Z. Chao, M. Tan, M. K. Paudel, S. Sakamoto, L. Ma, K. Sasaki-Tabata, H. Tanaka, Y. Shoyama, L. Xuan and S. Morimoto, J. Nat. Med., 2013, 67, 512–518 CrossRef CAS PubMed.
- X. Pei, B. Zhang, J. Tang, B. Liu, W. Lai and D. Tang, Anal. Chim. Acta, 2013, 758, 1–18 CrossRef CAS PubMed.
- P. A. Thompson, G. L. Rosner, K. K. Matthay, T. B. Moore, L. R. Bomgaars, K. J. Ellis, J. Renbarger and S. L. Berg, Cancer Chemother. Pharmacol., 2009, 64, 243–251 CrossRef CAS PubMed.
- S. Callies, D. P. de Alwis, J. G. Wright, A. Sandler, M. Burgess and L. Aarons, Cancer Chemother. Pharmacol., 2003, 51, 107–118 CAS.
- N. E. Kontny, G. Wurthwein, B. Joachim, A. V. Boddy, M. Krischke, U. Fuhr, P. A. Thompson, M. Jorger, J. H. Schellens and G. Hempel, Cancer Chemother. Pharmacol., 2013, 71, 749–763 CrossRef CAS PubMed.
- K. Kunarajah, S. Hennig, R. L. G. Norris, M. Lobb, B. G. Charles, R. Pinkerton and A. S. Moore, Cancer Chemother. Pharmacol., 2017, 80, 15–25 CrossRef CAS PubMed.
- Q. Zhang, X. Chen, F. Tu and C. Yao, Biosens. Bioelectron., 2014, 59, 377–383 CrossRef CAS PubMed.
- Z. L. Ge, T. M. Song, Z. Chen, W. R. Guo, H. P. Xie and L. Xie, Anal. Chim. Acta, 2015, 862, 24–32 CrossRef CAS PubMed.
- H. Tang, J. Chen, L. Nie, Y. Kuang and S. Yao, Biosens. Bioelectron., 2007, 22, 1061–1067 CrossRef CAS PubMed.
- Y. Zhou, Z. Xu, M. Wang, X. Meng and H. Yin, Electrochim. Acta, 2013, 96, 66–73 CrossRef CAS.
- M. Li, Y. Zheng, W. Liang, Y. Yuan, Y. Chai and R. Yuan, Chem. Commun., 2016, 52, 8138–8141 RSC.
- Q. Zhou, G. Li, Y. Zhang, M. Zhu, Y. Wan and Y. Shen, Anal. Chem., 2016, 88, 9830–9836 CrossRef CAS PubMed.
- H. Tang, J. Chen, L. Nie, Y. Kuang and S. Yao, Biosens. Bioelectron., 2007, 22, 1061–1067 CrossRef CAS PubMed.
Footnote |
| † Electronic supplementary information (ESI) available. See DOI: 10.1039/c8ra01807c |
| This journal is © The Royal Society of Chemistry 2018 |

