 Open Access Article
Estimation of the tensile modulus of polymer carbon nanotube nanocomposites containing filler networks and interphase regions by development of the Kolarik model
Shenggui Chen*a,
Mohsen Sarafbidabadb,
Yasser Zare c and
Kyong Yop Rhee*d
aSchool of Mechanical Engineering, Dongguan University of Technology, Dongguan, 523808, China. E-mail: segi-11@163.com
bDepartment of Biomedical Engineering, Faculty of Engineering, University of Isfahan, Isfahan, Iran
cYoung Researchers and Elites Club, Science and Research Branch, Islamic Azad University, Tehran, Iran
dDepartment of Mechanical Engineering, College of Engineering, Kyung Hee University, Yongin 446-701, Republic of Korea. E-mail: rheeky@khu.ac.kr
First published on 29th June 2018
Abstract
In this paper, the Kolarik model for the tensile modulus of co-continuous blends based on cross-orthogonal skeleton structures is simplified and developed for polymer/carbon nanotube (CNT) nanocomposites assuming continuous CNT networks in the polymer matrix and the reinforcing and percolating efficiencies of the interphase. For this purpose, the Ouali model for the modulus of nanocomposites above the percolation threshold is linked with the Kolarik model and the interphase percolation is considered with the excluded volume of the nanoparticles. In addition, the simplified Kolarik model is developed with the interphase as a new phase surrounding the nanofiller. A good agreement between the experimental data and the predictions is observed in the samples containing interphases and filler networks, while the developed model cannot estimate the modulus in the absence of interphases and network structures. The developed model demonstrates the effects of all the parameters on the modulus. The interphase parameters more significantly affect the modulus compared to the concentration and modulus of the filler, demonstrating the importance of the interphase properties.
1 Introduction
A large amount of effort has been deployed to develop high-performance polymer nanocomposites for the benefit of nanotechnology, including the combination of nano-reinforcements with polymer matrices.1–5 Widespread research on polymer nanocomposites has been conducted to suggest novel materials for various applications. Carbon nanotubes (CNTs) have attracted much attention as innovative nanofillers for polymer nanocomposites since their discovery in 1991.6–9 CNTs consist of a single or several graphite layers with diameters of 1–100 nm and lengths of about 5 to a few tens of microns. Also, they show Young’s moduli of around 1000 GPa as well as tensile strengths of 10–50 GPa.10 So, CNTs exhibit extraordinary physical properties such as high aspect ratios (length per diameter) and large surface areas as well as excellent mechanical performance which properly justifies their addition to polymer matrices. However, the advantages of CNTs are realised in polymer nanocomposites when they are uniformly dispersed in the polymer matrix, because they seriously tend to aggregate/agglomerate during processing.11Besides the outstanding mechanical performance of polymer/CNT nanocomposites (PCNTs), the electrical conductivity of these materials is also attractive. Polymers are commonly insulating, limiting their application in various fields such as electronics, sensors, etc.12,13 Conductivity is obtained in nanocomposites above a determinate filler concentration known as the percolation threshold.14,15 At percolation, a conducting network forms in the polymer matrix, which transfers electrons and creates the conductivity. As a result, obtaining a smaller percolation threshold is important in PCNTs. In addition, a percolation threshold was also observed in the mechanical properties of polymer nanocomposites, named as mechanical percolation. Some authors have interpreted the high levels of modulus in reinforced composites and nanocomposites by mechanical percolation.16–18 Since the percolation threshold is inversely related to the aspect ratio of particles, PCNTs generally show very low percolation thresholds which promotes the electrical conductivity and mechanical behavior with a low content of CNTs.19–21
In conventional composites containing reinforcements, a thin interface layer usually covers the particles. However, its thickness is much smaller than the filler size in most cases. Therefore, the presence of interfaces negligibly affects the overall properties of the composites. But, the dimensions of the interface layers in polymer nanocomposites containing large-surface-area nanoparticles are often comparable to the nanoparticle size forming a different phase as the interphase around the nanoparticles.22,23 The interphase has a substantial effect on the overall properties of the nanocomposites and previous researchers have investigated the reinforcing role of the interphase in polymer nanocomposites.24–26 Since the interphase level significantly controls the mechanical performance of the nanocomposites, some authors have characterized the interphase by the modeling of the mechanical properties. In this area, some conventional models such as Halpin–Tsai and Mori–Tanaka were developed to include the interphase or some new models were suggested.27,28 In addition, the interphase areas can produce connected networks, which accelerate the mechanical percolation in polymer nanocomposites at a lower volume fraction of nanoparticles.29,30 Consequently, the interphase affects the percolating role of the nanoparticles in the nanocomposites besides the reinforcing efficiency.
The electrical conductivities of composites were modeled by power-law equations, due to the rapid improvements in conductivities at the critical level of percolation. Following this approach, a few power-law models were also proposed for the tensile moduli of composites assuming the percolating effect. Ouali et al.31 suggested a power-law model for the moduli of polymer composites above the percolation point. Kolařík32 also proposed a cross-orthogonal skeleton (COS) configuration for the tensile modulus and yield strength of co-continuous polymer blends assuming the percolation threshold using a power-law equation. Nevertheless, these models cannot be well utilized for polymer nanocomposites, because they fail to address some important aspects such as the interphase.
In this study, the Kolarik model for the tensile moduli of co-continuous blends is developed for PCNTs above the percolation threshold assuming a continuous network in the polymer matrix. This model is linked with the Ouali model to consider the percolation threshold. Moreover, both the reinforcement and percolation effectivenesses of the interphase area are assumed in the Kolarik model to expand its predictability for polymer nanocomposites. The predictions of this model are examined against the experimental results of several samples from the available literature and by the roles of different materials and interphase parameters in the modulus.
2 Model development
The COS structure suggested by Kolarik32 includes three orthogonal bars of a component as a filler which are embedded in a unit cube as the total volume (Fig. 1). This construction was used for polymer blends with co-continuous arrangements. Moreover, when the network of CNTs in PCNTs is assumed to be a continuous phase in the polymer matrix, this model can be applied for PCNTs above the percolation threshold.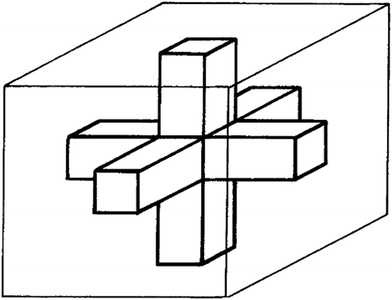 | ||
| Fig. 1 Cross-orthogonal skeleton (COS) structure which consists of three orthogonal bars as reinforcement in a unit cube as a whole composite.32 | ||
Based on the COS structure, Kolarik32 calculated the tensile modulus of composites with co-continuous morphology using:
 | (1) |
| 1 − ϕf − (1 − f)2(1 + 2f) = 0 | (2) |
In PCNTs containing low concentrations of nanoparticles, the “f” parameter has very low values. So, the term (1 − f) is approximated to 1. Also, since the modulus of CNTs is about 1000 GPa, the term fEm/Ef can be disregarded. Therefore, the Kolarik model for PCNTs is simplified to:
| E = Em + Eff2 + 2fEm | (3) |
However, the exact level of the “f” parameter cannot be easily determined. To show a definition for “f” assuming the networking of nanoparticles above the percolation threshold, the known Ouali model for the tensile moduli of composites containing filler networks is applied. It was mentioned that this model has been used for the tensile modulus of PCNTs in previous articles.
Ouali et al.31 suggested a model based on the inverse rule of mixtures by the percolation concept as:
 | (4) |
 | (5) |
 | (6) |
The very low levels of “ϕf” and “ψ” in PCNTs can simplify eqn (4) to:
 | (7) |
In addition, the “ϕp” parameter for cylindrical fillers such as CNTs33 is given by:
 | (8) |
| V = πR2l + (4/3)πR3 | (9) |
 | (10) |
 | (11) |
However, the interphase area around the nanoparticles may produce a network structure in PCNTs before the networking of the nanoparticles. Accordingly, the interphase region increases the excluded volume of each particle by changing “R” to “R + t” (t is the interphase thickness), while the volume of particles is constant. The excluded volume changes with the interphase to:
 | (12) |
 | (13) |
As a result, the percolation threshold of CNTs in PCNTs is expressed by the sizes of the nanoparticles and the interphase.
Eqn (3) is now linked to the simplified Ouali model (eqn (7)) to obtain an expression for the “f” parameter by the percolation effect which leads to following equation:
| Eff2 + 2fEm = −2ψEm + ψEf | (14) |
The two terms “2fEm” and “−2ψEm” are very much smaller than the other terms, because the modulus of the polymer matrix (Em) is very slight compared to the CNTs’ modulus (Ef). So, eqn (14) can be simplified to:
| Eff2 = ψEf | (15) |
| f = ψ0.5 | (16) |
The predictions of the Kolarik model are evaluated to validate this expression for the “f” parameter. Fig. 2 illustrates the calculations from the simplified Kolarik model for the expression of the “f” parameter in eqn (16) at average values Em = 2 GPa, Ef = 1000 GPa, R = 10 nm, l = 10 μm and t = 5 nm. Clearly, a higher CNT concentration causes an improved tensile modulus, which is reasonable for PCNTs containing CNT networks. Accordingly, eqn (16) is valid for the “f” parameter in the Kolarik model.
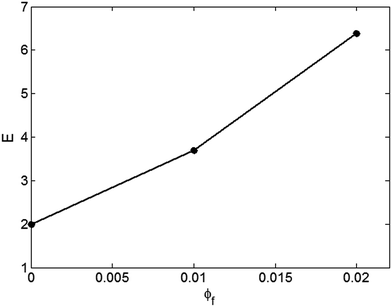 | ||
| Fig. 2 Moduli predicted by the simplified Kolarik model at Em = 2 GPa, Ef = 1000 GPa, R = 10 nm, l = 10 μm and t = 5 nm. | ||
By substitution of “ψ” from eqn (5) into eqn (16), the “f” parameter can be represented as:
 | (17) |
Fig. 3a depicts the effects of the “R” and “l” parameters on “f” at average levels of ϕf = 0.01 and t = 5 nm using a contour plot. Also, Fig. 3b shows the variation of the “f” parameter at different “t” levels at ϕf = 0.01, R = 10 nm and l = 10 μm. It is well observed that the common ranges of the “R”, “l” and “t” parameters cannot meaningfully change “f”. In fact, the dissimilar levels of the “R”, “l” and “t” parameters affect the percolation threshold, but the very low values of “ϕp” cannot meaningfully change the “f” parameter.
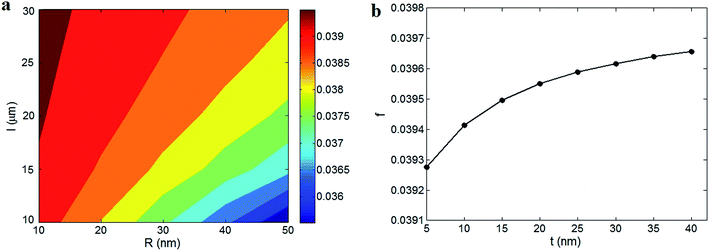 | ||
| Fig. 3 The effects of (a) “R” and “l” factors shown using a contour plot and (b) the “t” parameter on the “f” parameter based on eqn (13) and (17). | ||
Accordingly, the influence of “ϕp” on the “f” parameter is negligible and can be eliminated which simplifies eqn (17) to:
| f = ϕf0.7 | (18) |
By the substitution of eqn (18) into eqn (3), the Kolarik model for the tensile modulus of PCNTs above the percolation threshold is stated as:
| E = Em + Efϕf1.4 + 2ϕf0.7Em | (19) |
By dividing the latter equation by the matrix modulus (Em), the relative modulus of PCNTs based on the suggested model is given by:
 | (20) |
However, this model does not consider the interphase between the polymer matrix and the nanoparticles in polymer nanocomposites. Accordingly, its predictions for PCNTs cannot be accurate, because the interphase plays a significant role in the mechanical properties of nanocomposites, as mentioned previously. Since the interphase forms around the nanoparticles, it can be assumed to be a separate phase in addition to the nanoparticles in the Kolarik model (eqn (20)) as:
 | (21) |
 | (22) |
By the substitution of eqn (22) into eqn (21), the developed model shows that the tensile modulus of PCNTs containing filler networks depends on the properties of the nanoparticles and the interphase. Also, the experimental results of the tensile modulus as well as the radii of the CNTs can be applied to this model to calculate the average levels for the interphase parameters.
3 Results and discussion
Experimental results from the literature are applied to evaluate the developed model and predict the interphase properties and percolation threshold. Likewise, the variation of the modulus at different parameter levels is plotted and discussed to confirm the correctness of the developed model.Fig. 4 illustrates the experimental results for polyamide 6 (PA6)/multiwall CNT (MWCNT),35 epoxy/MWCNT36 and chitosan/MWCNT37 samples and the calculations of the developed model. The R and Em levels in nm and GPa units are reported as 6 and 2.45, 25 and 0.52 and 8, and 2 for these samples from their references, respectively. A good agreement between the experimental data and the calculations is observed for these reported samples at all of the filler fractions demonstrating that the developed model can properly estimate the tensile modulus of PCNTs. In fact, the developed model can predict the modulus of PCNTs by assuming the reinforcing and percolating roles of the nanoparticles and the interphase.
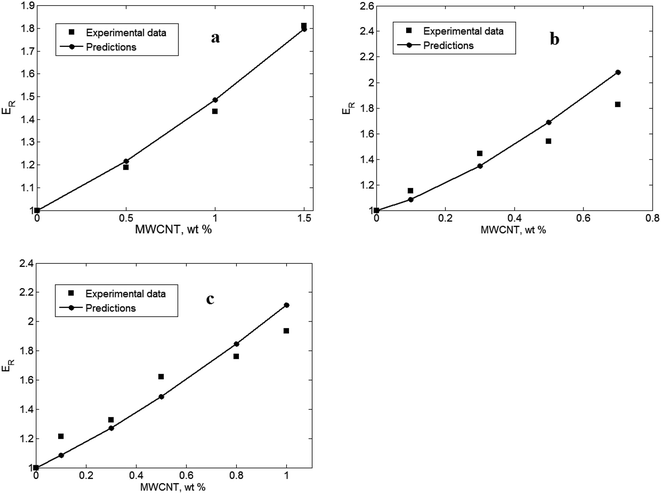 | ||
| Fig. 4 Comparison between the experimental results and the calculations of the developed model for (a) PA6/MWCNT,35 (b) epoxy/MWCNT36 and (c) chitosan/MWCNT37 samples. | ||
The comparable nature of the experimental results with the predictions shows that the samples contain filler networks and interphases. The average t and Ei values in nm and GPa units are obtained as 4 and 40, 6 and 80, and 12 and 150 for PA6/MWCNT, epoxy/MWCNT and chitosan/MWCNT samples, respectively, based on the predictions. So, it is concluded that the developed model can estimate the values of the interphase properties by the experimental measurements of tensile modulus.
Furthermore, this model can compare the average values of the interphase properties. According to t and Ei values, the chitosan/MWCNT sample shows the highest interphase, while the PA6/MWCNT nanocomposite shows the lowest. The interphase level generally depends on the interfacial interaction/adhesion between the polymer matrix and the nanoparticles.38,39 The MWCNTs covalently bonded to the chitosan matrix show the highest interfacial adhesion,37 while poor interaction between the PA6 matrix and MWCNTs in the PA6/MWCNT sample causes poor interphase characteristics. Additionally, the levels of “ϕp” in the presence of the interphase can be calculated by eqn (13). The average length of CNTs in all samples is assumed to be 10 μm. “ϕp” was calculated as 0.0004, 0.002 and 0.0003 for PA6/MWCNT, epoxy/MWCNT and chitosan/MWCNT samples, respectively. All samples show a very low value of “ϕp” indicating the formation of filler networks by very low amounts of CNTs. The highest “ϕp” is obtained for chitosan/MWCNT, due to it having the thickest interphase, while the epoxy/MWCNT example shows the worst percolation level, because of the high CNT radius. According to eqn (13), the percolation level of CNTs in PCNTs correlates to the dimensions of both the CNTs and the interphase.
The developed model also overpredicts the modulus in some samples. Since the presented model considers the interphase and filler networks in PCNTs, which play significant roles in the mechanical behavior of nanocomposites, the overprediction of the developed model demonstrates the absence of these terms in the nanocomposites. In fact, the nonappearance of the interphase and CNT network leads to a poor modulus in some samples and thus, the developed model cannot predict these low levels.
Fig. 5 depicts the experimental and theoretical results based on the developed model at t = Ei = 0 in four samples from previous articles including PA6/MWCNTs,40 PVA/MWCNTs,41 polypropylene/MWCNTs42 and PA6/MWCNTs.43 The predictions are higher than the experimental results even at t = Ei = 0 which shows the absence of the interphase and CNT networks in all of the samples. Therefore, the developed model can predict the formation of the interphase and filler networks in PCNTs by proper calculations, while it can also show the nonexistence of these terms through overprediction.
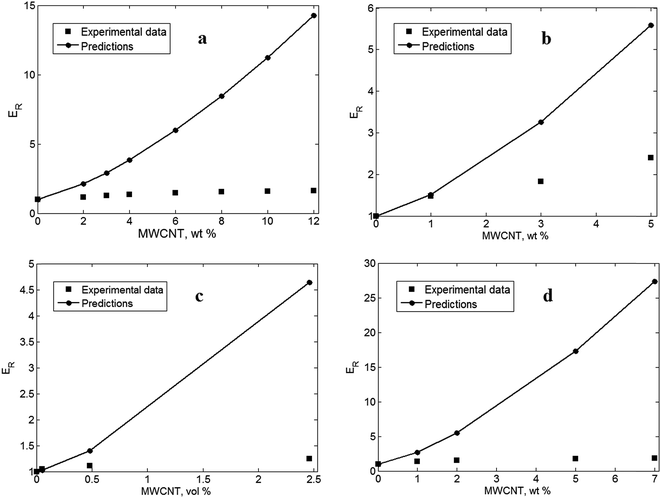 | ||
| Fig. 5 Overprediction of the developed model for (a) PA6/MWCNT,40 (b) PVA/MWCNT,41 (c) polypropylene/MWCNT42 and (d) PA6/MWCNT43 samples. | ||
As mentioned, poor interfacial interaction/adhesion between the polymer matrix and MWCNTs and the high level of the percolation threshold can result in the absence of the interphase and filler networks, respectively. The interfacial adhesion can be improved by some techniques such as functionalization of the filler surface by acids.44,45 Since the interphase level makes a positive effect on the percolation threshold, the improvement of the interfacial properties decreases the percolation threshold and helps the formation of filler networks. Moreover, the discrepancy between the experimental and theoretical data rises at higher concentrations of CNTs. It seems that the aggregation/agglomeration of nanoparticles at high filler fractions weakens the interfacial properties and causes large differences between the measured and the predicted moduli.
The influences of various parameters on the predictions are discussed to confirm the predictability of developed model. We start from the material parameters attributed to the nanoparticles.
Fig. 6 shows the effects of CNT concentration (ϕf) and modulus (Ef) on the estimated relative modulus at average values of Em = 2 GPa, R = 10 nm, t = 5 nm and Ei = 100 GPa. The modulus does not increase at very low levels of filler concentration. As observed, ER = 1 (E = Em) is obtained with ϕf < 0.004 which demonstrates the non-reinforcement of the polymer matrix by low numbers of nanoparticles. As a result, very low concentrations of nanoparticles cannot cause reinforcement in PCNTs. However, the modulus improves with the increment of filler concentration, but the highest modulus is obtained with the highest levels of filler concentration and modulus. The highest relative modulus of about 6.5 (a 550% improvement in comparison to the polymer matrix) is gained at the uppermost values of ϕf = 0.03 and Ef = 1300 GPa. Therefore, both high ranges of nanofiller concentration and stiffness are essential to improve the modulus of the nanocomposites.
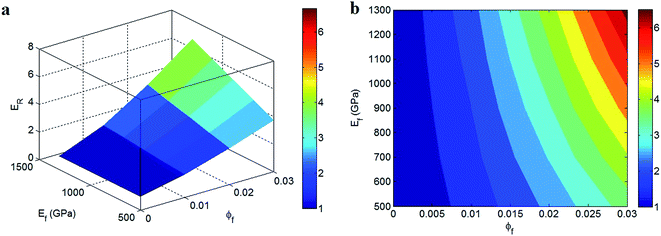 | ||
| Fig. 6 Variation of the relative modulus at different “ϕf” and “Ef” parameters and at Em = 2 GPa, R = 10 nm, t = 5 nm and Ei = 100 GPa: (a) 3D and (b) contour plots. | ||
These observations reflect the reinforcing role of the nanoparticles in the nanocomposites. A high filler content, which causes a large number of nanoparticles undoubtedly stiffens the nanocomposite. However, it should be noted that high filler concentrations may result in nanoparticle agglomeration which has a detrimental effect on the modulus. Moreover, a higher filler stiffness further increases the modulus of polymer nanocomposites, because the nanocomposite modulus is a function of the moduli of both the polymer matrix and the nanoparticles according to the rule of mixtures. Conclusively, the developed model indicates that the nanocomposites benefit from a high volume fraction of strong nanoparticles, due to the improved properties of the nanoparticles compared to the polymer matrix.
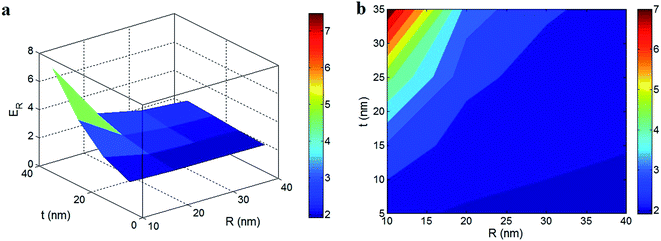
Fig. 7 also shows the dependence of the relative modulus on the “R” and “t” parameters at average values of Em = 2 GPa, ϕf = 0.01, Ef = 1000 GPa and Ei = 100 GPa. The worst modulus is observed at high and small values of the “R” and “t” parameters, respectively. In other words, the poorest relative modulus of about 2 is predicted by R > 30 nm and t < 10 nm showing that thick CNTs and a thin interphase decrease the modulus of nanocomposites. In contrast, the highest modulus is obtained by the thinnest CNTs and the thickest interphase, i.e. ER = 7 is achieved by R = 10 nm and t = 35 nm. Accordingly, thin nanotubes and a thick interphase produce a good modulus in PCNTs, whereas thick nanoparticles and a thin interphase cannot considerably improve the modulus. These results are well described by the reinforcing and percolating roles of the nanoparticles and the interphase in PCNTs. Thin CNTs increase the interfacial contact/interaction with polymer chains, which positively improves the mechanical involvement between the polymer chains and the nanoparticles. At the same filler concentration, it is clear that small nanoparticles can produce a greater interfacial area with the polymer matrix compared to larger particles.46 Since the specific surface area of the nanoparticles (surface area per weight) plays a major role in the reinforcing effects and the interphase level, small nanoparticles mainly control the mechanical performances of nanocomposites, as revealed by the developed model.
On the other hand, thin nanotubes create a high aspect ratio (α = l/2R) which reduces the percolation threshold and assists the formation of network structures. As a result, thin nanotubes promote the percolating role of nanoparticles.
A thick interphase enhances its role in the mechanical properties of polymer nanocomposites. A thick interphase is representative of the high extent of interfacial interaction/adhesion between the polymer matrix and the nanoparticles. So, a thicker interphase should further improve the modulus of nanocomposites, due to a better level of stress transferring at the interface.47 From a modeling view, the Ji34 and Pukanszky48 models have shown that a thick interphase produces an improved modulus and strength in nanocomposites. A thick interphase also positively shifts the percolation threshold of nanoparticles to smaller filler concentrations as established by the excluded volume of nanoparticles (eqn (13)). The thick interphase regions around the nanoparticles can generate network structures, which quickens the percolation threshold for mechanical properties. Accordingly, a thick interphase can stimulate the percolating of nanoparticles at small filler fractions causing a positive effect on the modulus besides its reinforcing role. In conclusion, the positive effects of thin CNTs and a thick interphase are well explained by the developed model.
The roles of the interphase volume fraction (ϕi) and modulus (Ei) on the modulus of PCNTs based on the developed model are also plotted in Fig. 8 at Em = 2 GPa, ϕf = 0.01 and Ef = 1000 GPa. The highest relative modulus of 12 is obtained at ϕi = 0.1 and Ei = 500 GPa, while an “ER” level of 2 is observed at ϕi < 0.02. This means that the highest modulus is calculated with the greatest values of the “ϕi” and “Ei” parameters, while a low “ϕi” is adequate for the main decrement of the modulus which demonstrates the key effect of “ϕi” on the modulus. So, we should aim to produce high levels of interphase concentrations in PCNTs. The role of the interphase in nanocomposites becomes more important if a high level of “ϕi” can be reached. In other words, the reinforcing and percolating productivities of interphase regions in nanocomposites mostly depend on the “ϕi” parameter. A high level of “ϕi” enlarges its effects on reinforcement and percolation, while the minor role of a slight interphase can be disregarded from nanocomposites. As a result, the observed influence of “ϕi” on the modulus is logical. According to eqn (22), more “ϕi” is obtained with thinner nanotubes and a thicker interphase. Therefore, these levels should be controlled in nanocomposites by preventing the accumulation of nanoparticles and providing strong interfacial adhesion/interaction between the components.
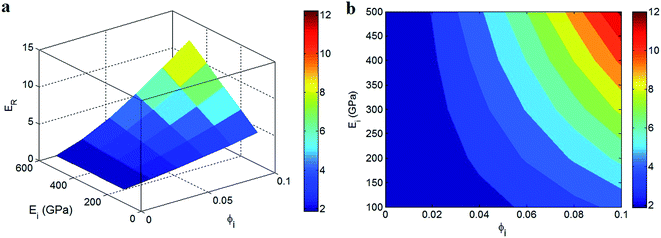 | ||
| Fig. 8 The relative modulus as a function of the “ϕi” and “Ei” parameters at Em = 2 GPa, ϕf = 0.01 and Ef = 1000 GPa: (a) 3D and (b) contour plots. | ||
The highest modulus in nanocomposites is achieved with the highest concentration of the strongest interphase based on Fig. 8. Therefore, the interphase modulus also plays an important role in the reinforcing of the interphase. A greater volume fraction of the strong interphase undoubtedly creates stronger regions (compared to the polymer matrix) in nanocomposites, which promotes the tensile modulus. Moreover, a strong interphase can resist high stress loading which is transferred through the interphase. As a result, the calculations of the developed model regarding the significance of the interphase content and modulus are sensible. These remarks implicitly indicate that thin nanotubes, and a thick and strong interphase result in the maximum level of modulus. This evidence has also been reported in previous studies19,30 which confirms the correct development of the Kolarik model for the modulus of PCNTs.
Finally, it should be stated that the effects of the “ϕi” and “Ei” parameters on the modulus are more pronounced that those of “ϕf” and “Ef”, although the nanoparticles’ modulus is much higher than that of the interphase. According to Fig. 6 and 8, the concentration and modulus of the nanoparticles improve the modulus from 1 to about 6.5, while the interphase properties can improve the modulus by 1100% (ER = 12). As a result, the interphase concentration and modulus are very important factors in the stiffness of nanocomposites.
4 Conclusions
The Kolarik model based on the COS structure for the tensile modulus of co-continuous blends was developed for PCNTs by the reinforcing and percolating roles of nanoparticles and interphases. The Ouali model for the modulus of nanocomposites above the percolation threshold was also applied to express the “f” parameter. In addition, the interphase region was assumed to be a separate phase in addition to the matrix and the nanoparticles in the Kolarik model. The experimental results from some samples containing interphases and filler networks suggest an acceptable agreement with the model predictions. However, the modulus is overpredicted in the samples which do not include interphases and network structures, because the absence of these terms significantly worsens the stiffness of nanocomposites.The modulus does not improve at very low levels of filler concentration, but the highest relative modulus of about 6.5 is obtained with the highest values of ϕf = 0.03 and Ef = 1300 GPa, due to the reinforcing role of the nanoparticles. The worst relative modulus of about 2 is also observed at values of R > 30 nm and t < 10 nm, where ER = 7 is achieved by R = 10 nm and t = 35 nm demonstrating the positive effects of thin CNTs and a thick interphase on the modulus. The effects of these parameters were well explained based on the reinforcing and percolating roles of the nanoparticles and the interphase region. Moreover, the highest relative modulus of 12 is obtained with the highest values of ϕi = 0.1 and Ei = 500 GPa, while ER = 2 is observed at ϕi < 0.02 which means that the maximum modulus is calculated with the greatest values of the interphase parameters. According to these calculations, the developed model shows a greater significance of the interphase properties for the stiffness of nanocomposites compared to the nanoparticles’ modulus and concentration, but the size of nanoparticles is more effective for the interfacial area and percolation threshold.
Conflicts of interest
There are no conflicts to declare.Acknowledgements
This work was financially supported by Dongguan University of Technology High-level Talents (Innovation Team) Research Project (No. KCYCXPT2016003), Dongguan University of Technology - Small team of scientific and technological innovation service (No. GC200104-31), Guangdong Scientific and Technological Project (No. 2017B090911015).References
- S. Ramesh, S. Khandelwal, K. Y. Rhee and D. Hui, Synergistic effect of reduced graphene oxide, CNT and metal oxides on cellulose matrix for supercapacitor applications, Composites, Part B, 2018, 138, 45–54 CrossRef.
- Y. Zare and K. Y. Rhee, Tensile Modulus of Polymer/CNT Nanocomposites containing Networked and dispersed Nanoparticles, AIChE J., 2018, 4, 220–225 CrossRef.
- A. S. Chaykar, F. Goharpey and J. K. Yeganeh, Volume phase transition of electron beam cross-linked thermo-responsive PVME nanogels in the presence and absence of nanoparticles: with a view toward rheology and interactions, RSC Adv., 2016, 6, 9693–9708 RSC.
- A. Rostami, H. Nazockdast and M. Karimi, Graphene induced microstructural changes of PLA/MWCNT biodegradable nanocomposites: rheological, morphological, thermal and electrical properties, RSC Adv., 2016, 6, 49747–49759 RSC.
- Y. Zare, M. Fasihi and K. Y. Rhee, Efficiency of stress transfer between polymer matrix and nanoplatelets in clay/polymer nanocomposites, Appl. Clay Sci., 2017, 143, 265–272 CrossRef.
- Y. Zare and K. Y. Rhee, A simple methodology to predict the tunneling conductivity of polymer/CNT nanocomposites by the roles of tunneling distance, interphase and CNT waviness, RSC Adv., 2017, 7, 34912–34921 RSC.
- T. Wu and B. Chen, Autonomous self-healing multiwalled carbon nanotube nanocomposites with piezoresistive effect, RSC Adv., 2017, 7, 20422–20429 RSC.
- R. Razavi, Y. Zare and K. Y. Rhee, A two-step model for the tunneling conductivity of polymer carbon nanotube nanocomposites assuming the conduction of interphase regions, RSC Adv., 2017, 7, 50225–50233 RSC.
- Z. Liu, W. Peng, Y. Zare, D. Hui and K. Y. Rhee, Predicting the electrical conductivity in polymer carbon nanotube nanocomposites based on the volume fractions and resistances of the nanoparticle, interphase, and tunneling regions in conductive networks, RSC Adv., 2018, 8, 19001–19010 RSC.
- J. Y. Kim, H. S. Park and S. H. Kim, Multiwall-carbon-nanotube-reinforced poly (ethylene terephthalate) nanocomposites by melt compounding, J. Appl. Polym. Sci., 2007, 103, 1450–1457 CrossRef.
- D. A. Heller, P. W. Barone, J. P. Swanson, R. M. Mayrhofer and M. S. Strano, Using Raman spectroscopy to elucidate the aggregation state of single-walled carbon nanotubes, J. Phys. Chem. B, 2004, 108, 6905–6909 CrossRef.
- G. Yin, N. Hu, Y. Karube, Y. Liu, Y. Li and H. Fukunaga, A carbon nanotube/polymer strain sensor with linear and anti-symmetric piezoresistivity, J. Compos. Mater., 2011, 45, 1315–1323 CrossRef.
- X. Song, S. Liu, Z. Gan, Q. Lv, H. Cao and H. Yan, Controllable fabrication of carbon nanotube-polymer hybrid thin film for strain sensing, Microelectron. Eng., 2009, 86, 2330–2333 CrossRef.
- Y. Zare and K. Y. Rhee, Development of a conventional model to predict the electrical conductivity of polymer/carbon nanotubes nanocomposites by interphase, waviness and contact effects, Composites, Part A, 2017, 100, 305–312 CrossRef.
- Y. Zare and K. Y. Rhee, Development of a model for electrical conductivity of polymer graphene nanocomposites assuming interphase and tunneling regions in conductive networks, Ind. Eng. Chem. Res., 2017, 56(32), 9107–9115 CrossRef.
- Y. Zare and K. Y. Rhee, Development and modification of conventional Ouali model for tensile modulus of polymer/carbon nanotubes nanocomposites assuming the roles of dispersed and networked nanoparticles and surrounding interphases, J. Colloid Interface Sci., 2017, 506, 283–290 CrossRef PubMed.
- Y. Zare and K. Y. Rhee, Prediction of tensile modulus in polymer nanocomposites containing carbon nanotubes (CNT) above percolation threshold by modification of conventional model, Curr. Appl. Phys., 2017, 17, 873–879 CrossRef.
- A. Almagableh, R. Mantena, A. Alostaz, M. Rababah, M. Aljarrah and A. S. Awad, Modeling the elastic modulus of exfoliated graphite platelets filled vinyl ester: analytical predictions with consideration of filler percolation, J. Compos. Mater., 2015, 49, 1285–1290 CrossRef.
- H.-X. Li, Y. Zare and K. Y. Rhee, The percolation threshold for tensile strength of polymer/CNT nanocomposites assuming filler network and interphase regions, Mater. Chem. Phys., 2018, 207, 76–83 CrossRef.
- R. Razavi, Y. Zare and K. Y. Rhee, A model for tensile strength of polymer/carbon nanotubes nanocomposites assuming the percolation of interphase regions, Colloids Surf., A, 2018, 538, 148–154 CrossRef.
- M. Martin-Gallego, M. Bernal, M. Hernandez, R. Verdejo and M. Lopez-Manchado, Comparison of filler percolation and mechanical properties in graphene and carbon nanotubes filled epoxy nanocomposites, Eur. Polym. J., 2013, 49, 1347–1353 CrossRef.
- C. Wan and B. Chen, Reinforcement and interphase of polymer/graphene oxide nanocomposites, J. Mater. Chem., 2012, 22, 3637–3646 RSC.
- F. Deng and K. J. Van Vliet, Prediction of elastic properties for polymer–particle nanocomposites exhibiting an interphase, Nanotechnology, 2011, 22, 165703 CrossRef PubMed.
- Y. Zare and K. Y. Rhee, Development of Hashin–Shtrikman model to determine the roles and properties of interphases in clay/CaCO3/PP ternary nanocomposite, Appl. Clay Sci., 2017, 137, 176–182 CrossRef.
- Y. Zare, K. Y. Rhee and S.-J. Park, Predictions of micromechanics models for interfacial/interphase parameters in polymer/metal nanocomposites, Int. J. Adhes. Adhes., 2017, 79, 111–116 CrossRef.
- P. Jahanmard and A. Shojaei, Mechanical properties and structure of solvent processed novolac resin/layered silicate: development of interphase region, RSC Adv., 2015, 5, 80875–80883 RSC.
- Y. Zare, Development of Halpin–Tsai model for polymer nanocomposites assuming interphase properties and nanofiller size, Polym. Test., 2016, 51, 69–73 CrossRef.
- A. Montazeri and R. Naghdabadi, Investigation of the interphase effects on the mechanical behavior of carbon nanotube polymer composites by multiscale modeling, J. Appl. Polym. Sci., 2010, 117, 361–367 Search PubMed.
- Y. Zare and K. Y. Rhee, A simple model for electrical conductivity of polymer carbon nanotubes nanocomposites assuming the filler properties, interphase dimension, network level, interfacial tension and tunneling distance, Compos. Sci. Technol., 2018, 155, 252–260 CrossRef.
- J.-M. Zhu, Y. Zare and K. Y. Rhee, Analysis of the roles of interphase, waviness and agglomeration of CNT in the electrical conductivity and tensile modulus of polymer/CNT nanocomposites by theoretical approaches, Colloids Surf., A, 2018, 539, 29–36 CrossRef.
- N. Ouali, J. Cavaillé and J. Perez, Elastic, viscoelastic and plastic behavior of multiphase polymer blends, Plast., Rubber Compos. Process. Appl., 1991, 16, 55–60 Search PubMed.
- J. Kolařík, Three-dimensional models for predicting the modulus and yield strength of polymer blends, foams, and particulate composites, Polym. Compos., 1997, 18, 433–441 CrossRef.
- L. Berhan and A. Sastry, Modeling percolation in high-aspect-ratio fiber systems. I. Soft-core versus hard-core models, Phys. Rev. E: Stat., Nonlinear, Soft Matter Phys., 2007, 75, 041120 CrossRef PubMed.
- X. L. Ji, K. J. Jiao, W. Jiang and B. Z. Jiang, Tensile modulus of polymer nanocomposites, Polym. Eng. Sci., 2002, 42, 983 CrossRef.
- W. Shao, Q. Wang, F. Wang and Y. Chen, The cutting of multi-walled carbon nanotubes and their strong interfacial interaction with polyamide 6 in the solid state, Carbon, 2006, 44, 2708–2714 CrossRef.
- W. Zou, Z.-J. Du, Y.-X. Liu, X. Yang, H.-Q. Li and C. Zhang, Functionalization of MWNTs using polyacryloyl chloride and the properties of CNT–epoxy matrix nanocomposites, Compos. Sci. Technol., 2008, 68, 3259–3264 CrossRef.
- X. Cao, H. Dong, C. M. Li and L. A. Lucia, The enhanced mechanical properties of a covalently bound chitosan-multiwalled carbon nanotube nanocomposite, J. Appl. Polym. Sci., 2009, 113, 466–472 CrossRef.
- Y. Zare and K. Y. Rhee, Dependence of Z Parameter for Tensile Strength of Multi-Layered Interphase in Polymer Nanocomposites to Material and Interphase Properties, Nanoscale Res. Lett., 2017, 12, 42 CrossRef PubMed.
- M. Rostami, M. Mohseni and Z. Ranjbar, An attempt to quantitatively predict the interfacial adhesion of differently surface treated nanosilicas in a polyurethane coating matrix using tensile strength and DMTA analysis, Int. J. Adhes. Adhes., 2012, 34, 24–31 CrossRef.
- O. Meincke, D. Kaempfer, H. Weickmann, C. Friedrich, M. Vathauer and H. Warth, Mechanical properties and electrical conductivity of carbon-nanotube filled polyamide-6 and its blends with acrylonitrile/butadiene/styrene, Polymer, 2004, 45, 739–748 CrossRef.
- Y. Mi, X. Zhang, S. Zhou, J. Cheng, F. Liu, H. Zhu, X. Dong and Z. Jiao, Morphological and mechanical properties of bile salt modified multi-walled carbon nanotube/poly (vinyl alcohol) nanocomposites, Composites, Part A, 2007, 38, 2041–2046 CrossRef.
- M. A. Bhuiyan, R. V. Pucha, M. Karevan and K. Kalaitzidou, Tensile modulus of carbon nanotube/polypropylene composites-a computational study based on experimental characterization, Comput. Mater. Sci., 2011, 50, 2347–2353 CrossRef.
- K. Saeed and S. Y. Park, Preparation of multiwalled carbon nanotube/nylon-6 nanocomposites by in situ polymerization, J. Appl. Polym. Sci., 2007, 106, 3729–3735 CrossRef.
- A. Abdolmaleki, S. Mallakpour and S. Borandeh, Amino acid-functionalized multi-walled carbon nanotubes for improving compatibility with chiral poly (amide-ester-imide) containing l-phenylalanine and l-tyrosine linkages, Appl. Surf. Sci., 2013, 287, 117–123 CrossRef.
- E. Orgilés-Calpena, F. Arán-Aís, A. M. Torró-Palau and C. Orgilés-Barceló, Chemical functionalization and dispersion of carbon nanofibers in waterborne polyurethane adhesives, J. Adhes., 2013, 89, 174–191 CrossRef.
- M.-R. Pourhossaini and M. Razzaghi-Kashani, Effect of silica particle size on chain dynamics and frictional properties of styrene butadiene rubber nano and micro composites, Polymer, 2014, 55, 2279–2284 CrossRef.
- Y. Zare, Modeling the strength and thickness of the interphase in polymer nanocomposite reinforced with spherical nanoparticles by a coupling methodology, J. Colloid Interface Sci., 2016, 465, 342–346 CrossRef PubMed.
- B. Pukanszky, Influence of interface interaction on the ultimate tensile properties of polymer composites, Composites, 1990, 21, 255–262 CrossRef.
| This journal is © The Royal Society of Chemistry 2018 |

