 Open Access Article
A simple non-extractive green method for the spectrophotometric sequential injection determination of copper(II) with novel thiazolylazo dyes
Y. Bazela,
A. Tupys *b,
Y. Ostapiukb,
O. Tymoshukb,
J. Imricha and
J. Šandrejová
 a
a
aFaculty of Science, P. J. Šafárik University, Moyzesova Str., 11, 04-001 Košice, Slovak Republic
bFaculty of Chemistry, Ivan Franko National University of Lviv, Kyryla & Mefodiya Str., 6, 79-005 Lviv, Ukraine. E-mail: andriytupys@ukr.net
First published on 30th April 2018
Abstract
This work introduces two new thiazolylazo dyes 1-[(5-benzyl-1,3-thiazol-2-yl)diazenyl]naphthalene-2-ol (BnTAN) and 1-[5-(4-sulfonamidobenzyl-4-methyl-1,3-thiazol-2-yl)diazenyl]naphthalen-2-ol (SABnMeTAN) as possible reagents for spectrophotometric determination of copper(II) in water samples in the form of a chelate complex. The substances were synthesized for the first time and characterized using the NMR technique. The main characteristics of ligands, such as molar absorption coefficients and protonation constants, were evaluated spectrophotometrically. A non-extractive sequential injection spectrophotometric method for the determination of copper(II) in the presence of Triton X-100 was developed. The linear range of the calibration plot was observed from 0.063 to 1.270 mg L−1 and the detection limit was 0.044 mg L−1. The SIA method was compared with the respective manual method and applied for the determination of copper(II) in tap and river water.
Introduction
Copper is an essential trace element which can be vital or toxic to biological systems, depending on the level of concentration. In humans, a maximum daily intake of 0.5 mg kg−1 was established for copper.1 A lack of copper in the daily diet may cause serious diseases, but the excess of it through water pollution is much more dangerous, resulting in chronic poisoning.2 Excessive amounts of copper found in the environment can have such origins as effluents from septic tanks and municipal wastewaters, discharges from power plants as well as leaching from antifouling paints and pressure-treated docks pilings.3–5 In order to control its accumulation or deficiency in environmental and biological samples, selective, reproducible and accurate analytical methods are required.The determination of copper(II) in flow injection systems has received a great amount of attention in last few decades due to its simplicity, flexibility and high sample throughput. This allows the method to be used in conjunction with different kinds of detection systems. Most systems use spectrophotometric detection, since spectrophotometric procedures are simple, fast and robust.
But in this case a preconcentration step is commonly necessary to obtain a low value for the copper(II) detection limit (LOD). The most recent methods for Cu(II) determination in flow systems are listed in Table 1.
| Reagent | Linear range [mg L−1] | LOD [mg L−1] | Sample | Sample throughput [h−1] | Interfering ions | Ions that do not interfere | Citation |
|---|---|---|---|---|---|---|---|
| a Method with pre-concentration.b Method with extraction.c NR – not reported. | |||||||
| EDTA | 80–8000 | NRc | Standard mixtures | 100 | NR | NR | [6] |
| Diethyldithiocarbamate (DDTC) | 0.5–5.0 | 0.2 | Plant food and water | 7 | Fe2+, Fe3+, CO32− | Mg2+, Mn2+, Ca2+ | [7] |
| Sodium diethyldithiocarbamate | 0.04–4.0 | NR | Wastewater | 60 | Fe2+, Cd2+, Pb2+, Ni2+, Fe3+, Zn2+ | Al3+, Mg2+, Mn2+, Ca2+ | [8] |
| Dithizoneb | 1–20 | NR | standard mixtures | 27 | Al3+, PO43− | Mg2+, Ca2+, SO42− | [9] |
| Dithizone on nitrilotriacetic acid beadsa | 0.5–25 | 0.11 | Freshwater | 15 | Ca2+, Mg2+, Zn2+, Co2+ | Ni2+, Cd2+, Fe2+, Al3+ | [10] |
| Resorcinol | 15–75 | 1% (w/w) | Brass | 60 | Zn, Pb | Sn, Al, Fe, Ni, Sb, Si, Mo, Mn | [11] |
| Cuprizone, ammonia and citric acid | 0.3–4 | NR | Wastewater | 44 | Fe3+, Al3+, EDTA, S2−, CN− | Mn2+, Cd2+, Hg2+ | [12] |
| 2-Carboxy-2′-hydroxy-5′-sulfoformazyl benzene (zincon) | 0.1–2.0 | 0.05 | Wastewater | 120 | Zn2+, Mn2+, Cd2+ | Mg2+, Ba2+ | [13] |
| 4-(2-pyridylazo)-resorcinol (PAR) on poly(ethylenimine) (PEI)a | 0.083–0.800 | 0.025 | Residual and tap water | 24 | Transition metals | Mg2+, Ca2+ | [14] |
| 2-(5-Bromo-2-pyridylazo)-5-[N-n-propyl-N-(3-sulfopropyl)amino]aniline (5-Br-PSAA) | 0.1–2 | 0.05 | Industrial wastewater | 18 | Ni2+, Pd2+, Co2+ | Zn2+, Pb2+, Cd2+, Mn2+, Al3+, Mg2+ | [15] |
| 1,3,3-Trimethyl-2-[5-(1,3,3-trimethyl-1,3-dihydroindol-2-ylidene)-penta-1,3-dienyl]-3H-indolium (DIDC)b | 0.13–2.0 | 0.02 | Pharmaceuticals | NR | Co2+, Ni2+, Al3+ | Cd2+, Pb2+, Zn2+, Fe3+, Ag+ | [16] |
| 1-[(5-Benzyl-1,3-thiazol-2-yl)diazenyl]naphthalene-2-ol (BnTAN) | 0.063–1.27 | 0.044 | Tap and river water | 30 | Oxalate, citrate | Mn2+, Zn2+, Cd2+, Pb2+ | This work |
In spectrophotometric methods complexing agents such as thiazolylazonaphthol dyes have been successfully employed in metal ions determinations.17 These compounds have attracted much attention not only because they are sensitive chromogenic reagents for spectrophotometric, liquid chromatography and extraction-photometric (including solid phase, liquid–liquid and cloud point extraction) determinations of many metal ions, but also because of their fastness of colour formation and relatively low cost of their preparation in comparison with other common dyes.18 The significant drawback for most of these compounds and their complexes is that they are only partly soluble or insoluble in water, depending on the pH. However, surfactants have been conveniently applied to enable measurement in an aqueous medium.19 Compounds that are widely used include 1-(2′-thiazolylazo)-2-naphthol (TAN) due to its ability to form azo-metal chelates with various cations. A number of applications have been proposed regarding the determination of transition metals, such as copper, silver, chromium, nickel, zinc, etc., using TAN.20–24 In addition, thiazolylazonaphthol dyes like TAN were successfully applied in flow injection analysis (FIA)25 and sequential injection analysis (SIA).26
In analytical chemistry surfactants have found their main use in spectrophotometry and fluorimetry. Commonly, the metal–chelate complexes formed in micellar systems are more stable than those formed in the absence of micelles. The other practical application of detergents like Triton X-100 is the enhancing of the solubility of organic compounds in water by incorporating them into micelles. Furthermore, micelle systems are convenient to use, because they are optically transparent, stable and relatively non-toxic.27
Previously, a method of copper(II) ions determination using the new reagent 1-[(5-benzyl-1,3-thiazol-2-yl)diazenyl]naphthalene-2-ol (BnTAN) after the conventional liquid–liquid extraction (LLE) into toluene was reported.28 This method had a significant drawback connected with the application of relatively large amounts (25 mL) of a toxic organic solvent. This does not correspond well with the main principles of “green chemistry”.29 Later a solution of Triton X-100 was added to enhance the solubility of the reagent, and in this case Cu(II) could be determined directly in aqueous samples.30 But the analytical procedure required comparatively large amounts of the reagents' solutions.
The aim of this work was to develop a non-extractive sequential injection method for the spectrophotometric determination of copper(II) with a novel thiazolylazonaphthol dye. For this purpose two approaches were taken: (1) determination of copper(II) in the presence of Triton X-100 with the previously reported reagent 1-[(5-benzyl-1,3-thiazol-2-yl)diazenyl]naphthalene-2-ol (BnTAN), which is sparingly soluble in water; (2) synthesis of a new ligand 1-[5-(4-sulfonamidobenzyl-4-methyl-1,3-thiazol-2-yl)diazenyl]naphthalen-2-ol (SABnMeTAN) by modification of BnTAN's structure with a polar functional group and further determination of Cu(II) without a surfactant. The benefits and drawbacks of each approach were discussed in detail. Then the method was automated and the volumes of reagents used for the determination of Cu(II) were significantly reduced.
Experimental
Instrumentation
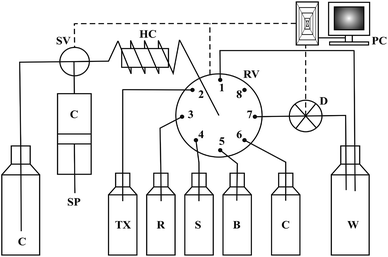
A Varian Mercury Plus NMR spectrometer was used for 1H and 13C NMR spectral measurements at room temperature in DMSO-d6 (Merck) with tetramethylsilane (TMS) as an internal standard (0 ppm for both nuclei). The elemental analysis was conducted using the element analyzer Vario EL III, Elementar. Absorbance measurements were carried out using a SPECORD® S 600 UV/Vis spectrophotometer with 1 cm quartz cells.The SIA manifold (Fig. 1) was constructed from a FIA-lab® 3500 system (FIAlab Instruments, USA) with an eight-port rotary selection valve, a 5 mL syringe pump and a 0.75 mm i.d. PTFE tubing 100 cm long holding coil. The detection part of the system consisted of a fibre-optic spectrophotometer with a charge-coupled USB 4000 detector equipped with a Z-flow cell of 2.0 cm optical path length and a LS-1 VIS tungsten lamp (Ocean Optics, Inc., USA). The operational software FIAlab for Windows Version 5.9 was used for system control, data acquisition and storage.
Reagents
All chemicals used in the work were of analytical reagent grade and were obtained from commercial sources and used without further purification. The ethanol was of UV spectroscopy grade. Ultra pure water from Millipore Milli-Q RG (Millipore, USA) was used throughout the experiment. A stock solution of copper(II) (5.0 × 10⁻³ mol L−1) was prepared by dissolving Cu(NO3)2 × 6H2O in water with further addition of 1–2 drops of concentrated nitric acid to prevent the hydrolysis of the metal. Working solutions were prepared daily by appropriate step-wise dilution of the stock solution with water. The solution of BnTAN reagent was prepared by dissolving the exact amount of the compound in ethanol. The SABnMeTAN solution was prepared by dissolving the compound in water. The acetic/acetate buffer (AB) solution (2.0 mol L−1) with pH 5.0 was prepared by mixing 36 mL of acetic acid (2.0 mol L−1) and 64 mL of sodium acetate (2.0 mol L−1) solutions. The Britton–Robinson universal buffer solution (UBS) was prepared by dissolving boric acid in a mixture of phosphoric and acetic acid in water to obtain the final concentration value of each component equal to 0.5 mol L−1. A 2% aqueous solution of Triton X-100 (Sigma-Aldrich), C14H22O(C2H4O)n (n = 9–10) was applied in the experiments as a non-ionic surfactant.Procedure
| BnTAN | SABnMeTAN | ||||||
|---|---|---|---|---|---|---|---|
| Step | Operation | Port | Flow rate [μL s−1] | Step | Operation | Port | Flow rate [μL s−1] |
| 1a | Turning the syringe pump to the valve in position | — | — | 1a | Turning the syringe pump to the valve in position | — | — |
| 1b | Aspiration of the carrier towards HC, 2000 μL | — | 200 | 1b | Aspiration of the carrier towards HC, 2000 μL | — | 200 |
| 1c | Turning the syringe pump to the valve out position | — | — | 1c | Turning the syringe pump to the valve out position | — | — |
| 2 | Aspiration of Triton X-100 (2%), 60 μL | 2 | 100 | 3 | Aspiration of SABnMeTAN (2.0 × 10⁻³ mol L−1), 30 μL | 3 | 70 |
| 3 | Aspiration of the buffer (0.4 mol L−1), 30 μL | 5 | 100 | 4 | Aspiration of the sample, 50 μL | 4 | 70 |
| 4 | Aspiration of BnTAN (5.0 × 10⁻⁴ mol L−1), 40 μL | 3 | 100 | 2 | Aspiration of the buffer (0.5 mol L−1), 20 μL | 5 | 70 |
| 5 | Aspiration of the sample, 30 μL | 4 | 100 | 5 | Aspiration of the carrier, 200 μL | 6 | 70 |
| 6 | Aspiration of Triton X-100 (2%), 20 μL | 2 | 100 | 6 | Aspiration/dispensing sequences (5 times) for mixing, 100 μL | 1 | 50 |
| 7 | Aspiration of the carrier, 200 μL | 6 | 100 | 7 | Propulsion of the sample zone towards detection | 7 | 80 |
| 8 | Aspiration/dispensing sequences (4 times) for mixing, 100 μL | 1 | 90 | ||||
| 9 | Propulsion of the sample zone towards detection | 7 | 70 | ||||
Sample collection and pre-treatment
Tap water from our laboratory was freshly collected into glass bottles and analysed using the suggested procedure without filtration or any further treatment. The river water sample was taken from the Hornád River in Košice, Slovak Republic, collected into glass bottles, filtered through a 0.45 m pore size membrane filter to remove particulate matter, stored at 4 °C in the dark and analyzed 1 week after collection.To determine the amount of Cu(II) in the SPS-WW2 Batch 113 waste water certified reference material, 2.0 mL of this solution (pH ≈ 2) were diluted with 6.0 mL of water. The sodium hydroxide solution was added in dropwise to obtain a medium acidity value of pH = 5.0 ± 0.1, and 0.2 mL of 2.0 mol L−1 acetic/acetate buffer solution (pH 5.0) was added. The resulting solution was transferred into the 10.0 mL bulb and filled up to the mark with water.
Synthesis of BnTAN and SABnMeTAN
The procedure for the synthesis of BnTAN31 and its crystal structure32 was described earlier where it was used in the extraction procedure.33 As no extraction stage will be needed in our further investigations, here are some new synthetic data for BnTAN in a solvent different from CDCl3: yield 70%. Anal. calcd for C20H15N3OS (345.42): C, 69.54; H, 4.38; N, 12.17; S, 9.28. Found: C, 69.31; H, 4.13; N, 11.83; S, 9.53; 1H NMR (500 MHz, DMSO-d6): δ = 14.26 (br.s, OH), 8.37 (d, 1H), 8.05 (d, 1H), 7.84 (d, 1H), 7.77 (s, 1H), 7.64–7.59 (m, 1H), 7.50–7.45 (m, 1H), 7.35–7.29 (m, 4H), 7.27–7.23 (m, 1H), 7.09 (d, 1H), 4.17 (s, 2H) ppm; 13C NMR (101 MHz, DMSO-d6): δ = 171.89, 160.86, 141.14, 140.61, 140.23, 139.98, 131.97, 130.08, 129.81, 129.38, 129.21, 128.96, 128.68, 127.25, 126.45, 121.63, 33.25 ppm; UV-Vis (H2O): λmax (nm) 490, ε × 10−3 (mol−1 dm3 cm−1) 15.3.In this work the synthetic route has been slightly changed to obtain the modified azo dye 1-[5-(4-sulfonamidobenzyl-4-methyl-1,3-thiazol-2-yl)diazenyl]naphthalen-2-ol (Fig. 2). At the first step the methyl vinyl ketone was bromoarylated by 4-sulfamylbenzenediazonium bromide in the presence of copper(II) bromide under Meerwein arylation conditions. 4-(4-Sulfonamidophenyl)-3-bromobutan-2-on was used in the next step without purification. Bromoketon reacted with thiourea in ethanol at refluxing and formed 2-amino-4-methyl-5-(4-sulfonamidobenzyl)thiazole with a good yield.34
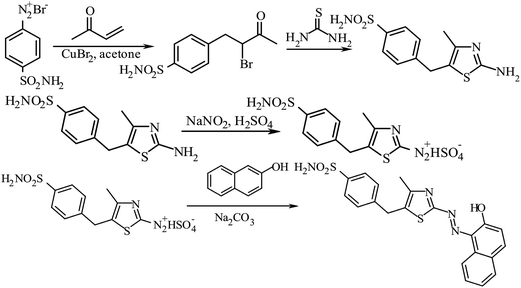 | ||
| Fig. 2 Schematic synthetic route of 1-[5-(4-sulfonamidobenzyl-4-methyl-1,3-thiazol-2-yl)diazenyl]naphthalen-2-ol (SABnMeTAN). | ||
The synthetic possibilities of 5-benzyl-2-aminothiazoles during the synthesis of 2-[(5-benzyl-1,3-thiazol-2-yl)imino]-1,3-thiazolidin-4-ones as potential biologically active compounds have been previously discussed.35,36 Herein, the novel advantages of 2-amino-4-methyl-5-(4-sulfonamidobenzyl)thiazole diazotization and the application of the obtained diazonium salt in diazocoupling are described. 5-Benzyl-2-aminothiazole was a mild base; therefore, efficient diazotization could be achieved only by using nitrosylsulfuric acid obtained from NaNO2 and concentrated H2SO4. In contrast to 5-benzyl-2-aminothiazole, 2-amino-4-methyl-5-(4-sulfonamidobenzyl)thiazole efficiently forms salts with full-strength hydrochloric and hydrobromic acids. However, the best results were observed by using nitrosylsulfuric acid for diazotization of 2-amino-4-methyl-5-(4-sulfonamidobenzyl)thiazole.37
5-Aryl-1,3-thiazole-2-diazonium salts are unstable, but they react in a diazocoupling reaction efficiently. In conclusion, SABnMeTAN was synthesized by diazotization of 2-amino-4-methyl-5-(4-sulfonamidobenzyl)thiazole and subsequent treatment under diazocoupling conditions. This method can be an excellent synthetic route to new colours as potential reagents.
Results and discussion
NMR spectroscopic characterization
The structure of the synthesized thiazolylazonaphthol dyes was confirmed by 1H and 13C NMR spectra. The experiment was carried out in DMSO-d6. All protons were assigned by their chemical shifts, supported by two-dimensional (COSY, HSQC) NMR experiments.The NMR spectrum of BnTAN obtained in deuterated chloroform has been previously investigated.38 Unfortunately, the interfering signal at 7.26 ppm from the solvent (CDCl3) overlapped with the signals from the aromatic protons of the dye and this complicated the interpretation of the spectrum. For this reason the solvent was changed to DMSO-d6, which gives a peak at 2.50 ppm and does not interfere with other signals.
As to the 1H NMR spectrum of BnTAN, it did not differ drastically from the respective spectrum of this substance in CDCl3, although some signals were shifted slightly. For example, the broad peak from the intermolecularly H-bonded hydroxylic proton was registered at 14.26 ppm. Another interesting feature of the spectrum is the clear singlet at 7.77 ppm, which surely refers to the isolated proton in the thiazole ring. Signals from two methylene hydrogens were registered in a more shielded region (4.22 ppm). The strong peak at ∼3.4 obviously comes from the impurities of water in the organic solvent.
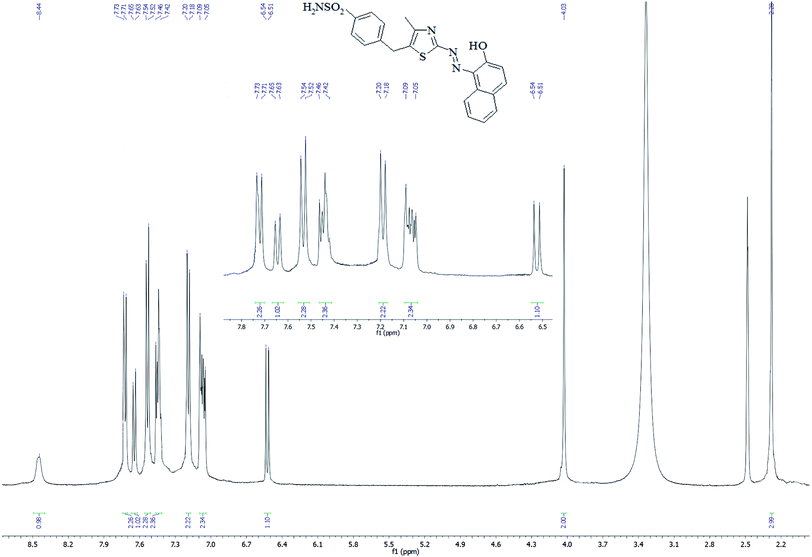
In the 1H NMR spectrum of SABnMeTAN (Fig. 3) all signals were assigned to the eighteen protons of the substance. According to the spectrum profile, the weak and broadened signal observed at 8.44 ppm refers to the acidic proton of the hydroxyl group. The singlet signal found at 4.03 ppm comes from the methylene hydrogens of the benzyl part of SABnMeTAN, and the singlet at 2.28 refers to the methyl group coupled with thiazole. Signals appearing at 7.19 and 7.53 ppm obviously originate from the four aromatic protons of the phenyl moiety. On the contrary, signals from the naphthalene protons aren't gathered in a one small region. For example, the shift from the closest proton to the hydroxyl group appears at 6.53 ppm, but the signal of the proton in the fourth position of naphthalene was found in a more deshielded region (7.64 ppm). This means that the protons in the naphthalene moiety are not equivalent due to the presence of the hydroxyl and azo group in the first and second positions, respectively.
UV/Vis spectral study
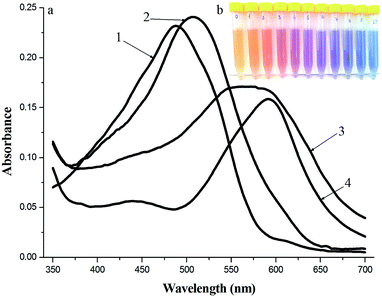
The determination of Cu(II) is based on the formation of a chelate complex between metallic ions and the thiazolylazonaphthol ligand. For this purpose two reagents were used: BnTAN and its modification SABnMeTAN. The maximum absorption peaks appear at 490 and 505 nm for BnTAN and SABnMeTAN, respectively. First of all, the molar absorption coefficients of these substances in water were determined. The ε490 value of BnTAN in water was found to be equal to 1.53 × 10⁴ L mol−1 cm−1, which is almost two times less than the respective value in ethanol.39 Although SaBnMeTAN proved to be better soluble in water, its ε505 value of 3.53 × 10³ L mol−1 cm−1 turned out to be even smaller.Also the pKa values of the protonated and undissociated forms of both ligands were determined at 25 °C in water by means of the spectroscopic method. As to BnTAN, its protonation takes place at a pKa1 value of 0.27 and dissociation at a pKa2 equal to 9.12, which corresponds well with previously obtained results in 50%/v ethanol–water mixture (pKa1 = 0.41 and pKa2 = 9.59). In the case of SABnMeTAN, these two values were found to be closer (pKa1 = 2.43 and pKa2 = 8.44).
The absorption spectra of BnTAN, SABnMeTAN and their binary mixtures with Cu2+ ions in a moderately acidic medium and the example of solutions set of BnTAN prepared with different concentrations of Cu2+ ions are shown in Fig. 4. The maximum absorption peaks of both BnTAN and SABnMeTAN in the presence of Cu2+ ions appear at 592 nm; the wavelength shift thus being approximately 100 nm, i.e. the complexation reaction is contrasting enough.
Optimization of conditions for complex formation
(1) Determination of the optimal buffer pH for the formation of complexes;
(2) Search for the best sequence of reagents aspirated to the holding coil;
(3) Optimization of reagents concentrations;
(4) Optimization of reagents volumes;
(5) Setting of the optimal flow rates for aspiration of reagents, mixing procedure and propulsion of the whole volume through the flow cell to the detector;
(6) Checking the influence of the number of mixing stages on the analytical signal.
According to the univariate optimization method, one of these variables was changed, while the others were kept at fixed levels.
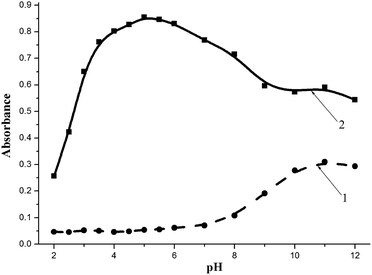
In the case of BnTAN, the medium acidity plays a crucial role in the formation of the complex compound. As can be seen in Fig. 5, copper(II) begins the interaction with the organic ligand even at pH 2.0. The maximum absorption peak appears at pH 5.0, whereas the addition of a buffer with higher pH values causes a decrease in the analytical signal. Furthermore, at acidity near the pKa2 value of BnTAN in water the excess of the ligand is transformed into an anionic form with the absorption maximum at 550 nm. The shoulder of the absorption band of this anion causes an interfering effect during the determination of Cu(II) at pH 8.0–12.0. The acetic/acetate buffer solution with pH 5.0 was chosen as the optimal one, because even the relative standard deviation (RSD) for four consecutive measurements at this acidity was the smallest. As to SABnMeTAN, the best result was obtained in a UBS with pH value of 4.0.
All twenty-four possible combinations of reagents aspiration sequences were checked to find the appropriate order in which components enter the solution in a holding coil. These combinations were compared, taking into the consideration such parameters of the analytical signals: the height of the peak, its symmetry and the reproducibility of the detection according to values of the relative standard deviation (RSD) (Table 3).
| Order | A592 (mean) | RSD [%] | Symmetric peak |
|---|---|---|---|
| TX-R-Cu-AB | 0.967 | 9.75 | +/− |
| TX-R-AB-Cu | 0.946 | 10.80 | − |
| TX-Cu-R-AB | 0.914 | 7.12 | + |
| TX-Cu-AB-R | 0.870 | 4.43 | + |
| TX-AB-R-Cu | 0.923 | 2.22 | + |
| TX-AB-Cu-R | 0.890 | 11.95 | − |
| R-TX-Cu-AB | 0.977 | 5.20 | − |
| R-TX-AB-Cu | 0.889 | 4.50 | − |
| R-Cu-TX-AB | 0.901 | 8.28 | − |
| R-Cu-AB-TX | 0.935 | 4.66 | − |
| R-AB-TX-Cu | 0.971 | 3.91 | − |
| R-AB-Cu-TX | 0.812 | 4.47 | +/− |
| Cu-TX-R-AB | 0.884 | 2.03 | + |
| Cu-TX-AB-R | 0.828 | 8.11 | +/− |
| Cu-R-TX-AB | 1.049 | 7.26 | − |
| Cu-R-AB-TX | 1.019 | 10.71 | − |
| Cu-AB-TX-R | 0.777 | 2.99 | +/− |
| Cu-AB-R-TX | 0.943 | 17.46 | − |
| AB-TX-R-Cu | 0.916 | 8.23 | +/− |
| AB-TX-Cu-R | 0.942 | 7.54 | − |
| AB-R-TX-Cu | 0.926 | 11.78 | − |
| AB-R-Cu-TX | 0.974 | 8.23 | − |
| AB-Cu-TX-R | 0.870 | 6.91 | +/− |
| AB-Cu-R-TX | 1.078 | 9.08 | − |
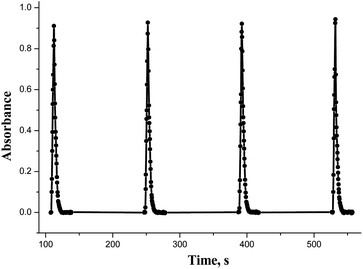
Though some orders provided the biggest absorption of the mixture, the results were irreproducible. The optimal sequence that had satisfactory spectral characteristics was TX-100 – buffer – BnTAN – sample with Cu(II). This is reasonable, because when the surfactant is aspirated first, all the rest of the components enter the prepared micellar solution. But to be completely sure that all complex molecules are captured in micelles, it was decided to add an additional small amount of a surfactant solution after all the components. So, the order that was used in further investigations was TX-100 – buffer – BnTAN – sample – TX-100. As to the other azo dye, it was easier to establish the optimal sequence due to the absence of a surfactant, and it turned to be SABnMeTAN – sample – buffer. The SIA-gram for the optimal reagents sequence, shown in Fig. 6, could be characterized with good peak symmetry and repeatability.
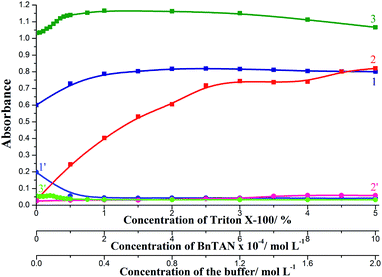
The effect of the concentration of reagents was investigated in the ranges: 0–5% TX-100, 0–1.0 × 10⁻³ mol L−1 BnTAN and 0–2.0 mol L−1 acetic/acetate buffer. Basing on the results obtained (Fig. 7) the following conditions were selected as optimal: 2% TX-100, 5.0 × 10⁻⁴ mol L−1 BnTAN and 0.4 mol L−1 buffer. On applying the second ligand, optimal reagents concentrations were 2.0 × 10⁻³ mol L−1 SABnMeTAN and 0.5 mol L−1 UBS.
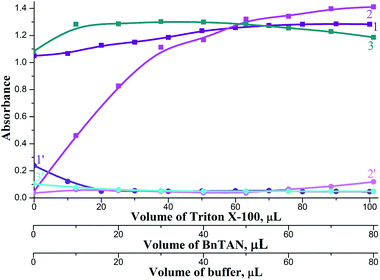
It was also very important to find appropriate reagents volumes for the best mixing of the stacked zones in the holding coil. Investigations were carried out in volume ranges: 0–100 μL TX-100, 0–80 μL BnTAN and 0–80 μL acetic buffer. These ranges were chosen basing on two limitations: (1) The total volume of the holding coil (440 μL) and tubes connected to the Z-flow cell (approximately 100 μL); (2) the complete mixing of reagents could be prevented at too high reagents volumes. According to the results obtained (Fig. 8), the following reagent volumes were found to be sufficient: 80 μL TX-100, 40 μL BnTAN and 30 μL buffer. As to the second reagent, optimal reagents volumes were 30 μL SABnMeTAN and 25 μL UBS.
Another important optimization step was to find the best flow rates for the aspiration of reagents, the mixing procedure and the propulsion of the whole volume through the flow cell to the detector. Changes in the absorption peak were analyzed in the range of flow rates of 10–110 μL s−1 for aspiration and mixing, and 10–100 μL s−1 for propulsion to the detector (Table 4). The obtained data were compared according to the RSD values, and optimal flow rates were found to be: 100 μL s−1 for aspiration, 90 μL s−1 for mixing and 70 μL s−1 for propulsion to the detector. These relatively high flow rates provide a rapid experimental procedure. It is also worth mentioning that the dispersion between the sample-reagent zone is minimal at such flow rates and there is no need to use additional air segments to reduce it. The corresponding values of flow rates for the method with SABnMeTAN were 70, 50 and 80 μL s−1, respectively.
| Flow rate [μL s−1] | Aspiration | Mixing | To the detector | |||
|---|---|---|---|---|---|---|
| A592 | RSD [%] | A592 | RSD [%] | A592 | RSD [%] | |
| 10 | 0.836 | 10.16 | 1.331 | 7.70 | 0.950 | 6.42 |
| 20 | 1.002 | 6.28 | 1.402 | 5.93 | 1.142 | 3.37 |
| 30 | 1.068 | 2.11 | 1.416 | 6.70 | 1.222 | 3.99 |
| 40 | 1.058 | 2.49 | 1.404 | 3.82 | 1.264 | 2.48 |
| 50 | 1.146 | 3.60 | 1.396 | 7.47 | 1.235 | 4.54 |
| 60 | 1.216 | 5.43 | 1.387 | 5.24 | 1.260 | 4.05 |
| 70 | 1.231 | 2.10 | 1.392 | 2.80 | 1.269 | 1.05 |
| 80 | 1.326 | 2.65 | 1.394 | 5.60 | 1.262 | 5.72 |
| 90 | 1.303 | 2.85 | 1.392 | 2.27 | 1.257 | 2.06 |
| 100 | 1.362 | 1.91 | 1.336 | 6.81 | 1.239 | 4.31 |
| 110 | 1.269 | 6.56 | 1.337 | 6.29 | — | — |
The last stage of the optimization process was checking the number of mixing stages in the range of 0–6 aspiration/dispensing sequences. Of course, on increasing the number of mixing stages the analyte became more diluted by a carrier and the absorbance of the solution changed from 1.726 without mixing to 1.288 for six mixings. But the RSD values were the lowest after four and five mixing sequences for BnTAN and SABnMeTAN, respectively.
Figure of merits
The developed manual and SIA methods for the determination of Cu(II) with BnTAN have significant distinctions. Beside automation of the analysis, the SIA method had a significant advantage in terms of the decrease in the volume of reagents used in the determination. The manual method requires ligand volumes twelve-times higher than in the SIA method. In addition, a single determination of copper(II) on a SIA manifold is completed in only 2 minutes. Therefore, the total throughput of the method is 30 samples per hour.The metrological characteristics of all proposed methods with the application of azo dyes are listed in Table 5. The linear range of the calibration plot and the correlation coefficient were evaluated. The limit of detection (LOD) was calculated based on three-times the standard deviation of the blank test. According to results, the SIA method with SABnMeTAN lacked sensitivity, probably due to the low value of the molar absorption coefficient of this ligand. Therefore, this method is not recommended for the determination of copper(II). As to BnTAN, the detection limit of the manual method proved to be a bit bigger, which can be explained by the exploitation of a much larger volume of the sample than in the SIA method. In addition, the sequential technique is characterized with a much wider linear range. The sensitivity of the SIA method could be improved easily by the aspiration of a bigger volume of the analyzed solution or by pre-concentration.
| Parameter | Manual method with BnTAN | SIA method | |
|---|---|---|---|
| With BnTAN | With SABnMeTAN | ||
| Regression equation [mg L−1] | A = a + bC | A = a + bC | A = a + bC |
| a (intercept) | 0.0144 | −0.0128 | −0.0055 |
| b (slope) | 0.3718 | 0.9232 | 0.4410 |
| Correlation coefficient, r | 0.9990 | 0.9996 | 0.9995 |
| Linear range [mg L−1] | 0.099–0.834 | 0.063–1.270 | 0.204–3.500 |
| LOD [mg L−1] | 0.048 | 0.044 | 0.151 |
| ε [L mol−1 cm−1] | 2.49 × 10⁴ | — | — |
The effect of some potentially interfering ions on the determination of 0.318 mg L−1 of Cu(II) with BnTAN in the presence of varying amounts of diverse ions was examined. A ratio of Cu: interferent which caused an error of ±5% was taken as the limiting amount of a foreign ion. Most of the examined ions (NH4+, Na+, K+, Mg2+, Al3+, Ca2+, Mn2+, Cr3+, Cr6+, Zn2+, Cd2+, Ba2+, Pb2+, Cl−, Br−, I−, SO42−, NO3−, HPO42−, ClO4−, HCO3−) did not interfere with the determination of copper(II) at more than a 100-fold excess. A selectivity coefficient of 10 was obtained for Fe3+, Co2+, Ni2+, Ag+, F− and C4H4O62− (tartrate) ions, and of 5 for Fe2+ and Hg2+. However, such anions as C2O42− (oxalate) and C6H5O73− (citrate) interfere even at equivalent concentrations with Cu(II) due to their reducing properties. Fortunately, these ions are not commonly present together with Cu(II) in environmental samples. Taking into consideration that other transition metals practically do not interfere with the determination on copper(II), it can be assumed that the proposed method is sufficiently selective.
Analytical application
Intra-day precision was determined by performing four repeated analysis of the three standard Cu2+ solutions on the same day under the same conditions. Inter-day precision of the method was assessed by carrying out the determination of Cu2+ in standard solutions on three different days in the same laboratory. The mean, standard deviation and relative standard deviation was determined in order to assess the precision of the method (Table 6).| Cu2+ taken [mg L−1] | Intra-day | Inter-day | ||||||
|---|---|---|---|---|---|---|---|---|
| Determined [mg L−1] | RSD [%] | Er [%] | R [%] | Determined [mg L−1] | RSD [%] | Er [%] | R [%] | |
| 0.2145 | 0.2169 ± 0.0040 | 1.85 | 1.1 | 101.1 | 0.2178 ± 0.0042 | 1.93 | 1.5 | 101.5 |
| 0.4766 | 0.4740 ± 0.0072 | 1.51 | −0.5 | 99.5 | 0.4828 ± 0.0088 | 1.83 | 1.3 | 101.3 |
| 0.7149 | 0.7160 ± 0.0039 | 0.54 | 0.2 | 100.2 | 0.7130 ± 0.0129 | 1.80 | −0.3 | 99.7 |
To check the practicability of the suggested method with BnTAN, the certified reference material SPS-WW2 Batch 113 was used. According to the certificate, the concentration of Cu(II) in this reference material for measurement of elements in wastewaters was 2.000 ± 0.010 mg L−1. The result for the determination of Cu(II) using the proposed method (n = 5, P = 0.95) showed that the amount of copper in this material is 1.959 ± 0.088 mg L−1 (RSD = 3.6%). This corresponds well with the reference documentation and proves the practical validity of the technique.
As a supplementary confirmation of the applicability of the method, model samples containing various quantities of Cu(II) were prepared and tested. Among them were tap water and river water samples. As can be seen in Table 7, the repeatability of the technique is good (1.32–1.88%).
| Sample | C(Cu2+) [mg L−1] | RSD [%] | |
|---|---|---|---|
| Added | Determined | ||
| Model solution no. 1 | 0.1430 | 0.1479 ± 0.0024 | 1.59 |
| Model solution no. 2 | 0.3177 | 0.3167 ± 0.0054 | 1.71 |
| Model solution no. 3 | 0.4766 | 0.4739 ± 0.0089 | 1.88 |
| Tap water | 0.3177 | 0.3233 ± 0.0059 | 1.81 |
| River water | 0.3177 | 0.3192 ± 0.0042 | 1.32 |
Conclusions
This work presents a new approach for the determination of Cu(II) in water samples. The possible application of two azo dyes in the analysis of copper was investigated and ligand 1-[(5-benzyl-1,3-thiazol-2-yl)diazenyl]naphthalene-2-ol (BnTAN) proved to be the more sensitive of the two. A new non-extractive SIA technique for the determination of Cu(II) ions using the azo dye BnTAN in the presence of Triton X-100 has been developed. According to the results of the intra-day and inter-day determination of Cu2+, the SIA technique is characterized with good reproducibility and ruggedness. A low LOD value of 0.044 mg L−1 enables the determination of Cu2+ ions in environmental samples. The proposed method was successfully used in the analysis of different water samples and a reference material containing Cu(II). This technique offers a green alternative to a previously published extractive technique28 that applied 25 mL of toluene. The combination of the spectrophotometric detection with the SIA manifold gives many great advantages in accordance with the requirements of green analytical chemistry, such as: (1) lower volume consumption of reagents; (2) no need to use toxic organic solvents; (3) reduced risk of the analyte loss and sample contamination; (4) better accuracy and precision. Furthermore, the total sample frequency of the proposed SIA method is 30 samples per hour, which is high enough in comparison with other methods.Conflicts of interest
There are no conflicts to declare.Acknowledgements
This study was supported by the Scientific Grant Agency VEGA of the Ministry of Education of the Slovak Republic and the Slovak Academy of Sciences (Grant No. 1/0253/16). A. Tupys would like to thank to the International Visegrad Fund for providing a five-month scholarship (Grant No. 51501721).Notes and references
- WHO Technical Report Series, Evaluation of certain food additives and contaminants, WHO, Geneva, 1982, p. 683 Search PubMed.
- S. A. Lee, J. J. Lee, J. W. Shin, K. S. Min and C. Kim, Dyes Pigm., 2015, 116, 131 CrossRef CAS.
- P. L. Croot, J. W. Moffett and L. E. Brand, Limnol. Oceanogr., 2000, 45, 619 CrossRef CAS.
- J. W. Moffett, L. E. Brand, P. L. Croot and K. A. Barbeau, Limnol. Oceanogr., 1997, 42, 789 CrossRef CAS.
- M. R. Callahan, E. A. Kaltenbacher and R. H. Byrne, Environ. Sci. Technol., 2004, 38, 587 CrossRef CAS PubMed.
- A. T. Haj-Hussein and G. D. Christian, Analyst, 1986, 111(1), 65 RSC.
- J. F. van Staden and A. Botha, Talanta, 1999, 49(5), 1099 CrossRef CAS PubMed.
- P. Wang, S. J. Shi and D. Zhou, Microchem. J., 1995, 52(2), 146 CrossRef CAS.
- J. F. van Staden and R. E. Taljaard, Talanta, 2004, 64(5), 1203 CrossRef CAS PubMed.
- I. C. Santos, R. B. R. Mesquita and A. O. S. S. Rangel, Anal. Chim. Acta, 2015, 891, 171 CrossRef CAS PubMed.
- A. C. B. Dias, J. M. T. Carneiro, V. Grassi and E. A. G. Zagatto, Anal. Chim. Acta, 2004, 514(2), 253 CrossRef CAS.
- A. Ríos, M. De Dolores Luque Castro and M. Valcárcel, Analyst, 1985, 110(3), 277 RSC.
- T. Leelasattarathkul, S. Liawruangrath, M. Rayanakorn, W. Oungpipat and B. Liawruangrath, Talanta, 2006, 70(3), 656 CrossRef CAS PubMed.
- A. N. Araújo, R. C. C. Costa and J. Alonso-Chamarro, Talanta, 1999, 50(2), 337 CrossRef.
- S. Ohno, N. Teshima, T. Sakai, K. Grudpan and M. Polasek, Talanta, 2006, 68(3), 527 CrossRef CAS PubMed.
- J. Škrlíková, V. Andruch, H. Sklenářová, P. Chocholouš, P. Solich and I. S. Balogh, Anal. Methods, 2010, 2(8), 1134 RSC.
- A. Kawase, Bunseki Kagaku, 1968, 17, 56 CrossRef CAS.
- K. K. Karukstis, J. P. Litz and M. B. Garber, Spectrochim. Acta, Part A, 2010, 75, 1354 CrossRef PubMed.
- T. Saitoh, Y. Kimura, T. Kamidate, H. Watanabe and K. Haraguchi, Anal. Sci., 1989, 5, 577 CrossRef CAS.
- J. Chen and K. C. Teo, Anal. Chim. Acta, 2001, 434, 325 CrossRef CAS.
- L.-L. Wang, J.-Q. Wang, Z.-X. Zheng and P. Xiao, J. Hazard. Mater., 2010, 177, 114 CrossRef CAS PubMed.
- K. H. Low, S. M. Zain, M. R. Abas, M. Misran and M. A. Mohd, J. Korean Chem. Soc., 2009, 53(6), 717 CrossRef CAS.
- S. A. Kulichenko, V. A. Doroshchuk, S. A. Lelyushok, O. Yu. Sopil'nyak and V. B. Ishchenko, J. Anal. Chem., 2007, 62(10), 940 CrossRef CAS.
- S. L. C. Ferreira, N. M. L. Araujo, A. B. Santos, A. F. Dantas and A. C. Spinola Costa, Mikrochim. Acta, 1995, 118, 123 CrossRef CAS.
- L. S. G. Teixeira, F. R. P. Rocha, M. Korn, B. F. Reis, S. L. C. Ferreira and A. C. S. Costa, Talanta, 2000, 51(5), 1027 CrossRef CAS PubMed.
- W. Thanasarakhan, S. Liawruangrath, S. Wangkarn and B. Liawruangrath, Talanta, 2007, 71(5), 1849 CrossRef CAS PubMed.
- W. L. Hinze and E. A. Pramauro, Crit. Rev. Anal. Chem., 1993, 24(2), 133 CrossRef CAS.
- A. Tupys, O. Tymoshuk and P. Rydchuk, Chem. Chem. Technol., 2016, 10(1), 19 CrossRef CAS.
- P. Anastas and N. Eghbali, Chem. Soc. Rev., 2010, 39(1), 301 RSC.
- A. Tupys, O. Tymoshuk, K. Tupys and J. Kalembkiewicz, Visnyk of the Lviv University. Series Chemistry, 2016, vol. 57, p. 249 Search PubMed.
- A. Tupys, J. Kalembkiewicz, Y. Bazel, L. Zapała, M. Dranka, Y. Ostapiuk, O. Tymoshuk and E. Woźnicka, J. Mol. Struct., 2017, 1127, 722 CrossRef CAS.
- M. Fizer, V. Sidey, A. Tupys, Y. Ostapiuk, O. Tymoshuk and Y. Bazel, J. Mol. Struct., 2017, 1149, 669 CrossRef CAS.
- Y. Bazel, A. Tupys, Y. Ostapiuk, O. Tymoshuk and V. Matiychuk, J. Mol. Liq., 2017, 242, 471 CrossRef CAS.
- N. D. Obushak, V. S. Matiichuk, R. Y. Vasylyshin and Y. V. Ostapyuk, Russ. J. Org. Chem., 2004, 40, 383 CrossRef CAS.
- Y. V. Ostapiuk, M. D. Obushak, V. S. Matiychuk, M. Naskrent and A. K. Gzella, Tetrahedron Lett., 2012, 53, 543 CrossRef CAS.
- V. S. Matiychuk, N. D. Obushak, N. I. Pidlypnyi, Y. V. Ostapiuk and R. M. Voloshchuk, Chem. Heterocycl. Compd., 2010, 46(4), 495 CrossRef CAS.
- Y. V. Ostapiuk, V. S. Matiichuk, N. I. Pidlypnyi and N. D. Obushak, Russ. J. Org. Chem., 2012, 48(4), 519 CrossRef CAS.
- A. Tupys, J. Kalembkiewicz, Y. Ostapiuk, V. Matiichuk, O. Tymoshuk, E. Woźnicka and Ł. Byczyński, J. Therm. Anal. Calorim., 2017, 127(3), 2233 CrossRef CAS.
- A. Tupys and O. Tymoshuk, Acta Chim. Slovaca, 2015, 8(1), 59 CAS.
| This journal is © The Royal Society of Chemistry 2018 |

