 Open Access Article
Creative Commons Attribution 3.0 Unported Licence
Synthesis, characterization and sorption studies of aromatic compounds by hydrogels of chitosan blended with β-cyclodextrin- and PVA-functionalized pectin†
Cesar M. C.
Filho
a,
Pedro V. A.
Bueno
b,
Alan F. Y.
Matsushita
a,
Adley F.
Rubira
b,
Edvani C.
Muniz
bc,
Luísa
Durães
 d,
Dina M. B.
Murtinho
a and
Artur J. M.
Valente
 *a
*a
aCQC, Department of Chemistry, University of Coimbra, 3004-535 Coimbra, Portugal. E-mail: avalente@ci.uc.pt; Tel: +351 239852080
bGrupo de Materiais Poliméricos e Compósitos (GMPC) – Departamento de Química, Universidade Estadual de Maringá, UEM, 87020-900, Maringá, PR, Brazil
cPost-graduate Program on Materials Science & Engineering, Federal University of Technology, Paraná (UTFPR-LD), 86036-370, Londrina, PR, Brazil
dCIEPQPF, Department of Chemical Engineering, University of Coimbra, Rua Sílvio Lima, 3030-790 Coimbra, Portugal
First published on 18th April 2018
Abstract
Petroleum comprises the monoaromatic and polycyclic aromatic hydrocarbons, which exhibit acute toxicity towards living animals. Consequently, their removal from natural environment is a priority challenge. On the other hand, biomaterials are increasingly being used as adsorbents. Pectin and chitosan are well-known polysaccharides able to form coacervate hydrogels. Aiming an increase of sorption ability by hydrophobic compounds, pectin was also functionalized with two amphiphilic compounds: β-cyclodextrin (β-CD) and poly(vinyl alcohol) (PVA). Both the modified pectin and the hydrogels were evaluated using nuclear magnetic resonance (NMR), infrared spectroscopy (FTIR), and scanning electron microscopy (SEM). The hydrogels were further characterized in terms of thermogravimetric analysis (TGA) and swelling kinetics. The interaction between the hydrogel and mix solutions containing six different aromatic compounds (BTXs and the following PAHs: pyrene, benzo(b)fluoranthene and benzo(a)pyrene) has been evaluated through sorption isotherms and kinetics. The mechanism of sorption interaction and the selectivity of the adsorbents towards different aromatic compounds were discussed. The results clearly show that the presence of β-CD and PVA into gel leads to an increase in the removal efficiency of both, BTXs and PAHs. The gels were subjected to two sorption/desorption cycles to have an assessment of the capability of adsorbents for re-use. Finally, the sorption quantification of those six aromatic compounds from a real gasoline sample onto gels has been tested.
1. Introduction
Polycyclic aromatic hydrocarbons (PAHs) (e.g., pyrene (pyr), benzo(b)fluoranthene (B(b)F) and benzo(a)pyrene (B(a)P) and the monoaromatic hydrocarbons (MAHs) (e.g., benzene, toluene and xylene isomers (BTXs)), are carcinogenic, teratogenic and mutagenic agents in humans1,2 and environmental priority pollutants.3,4These hydrocarbons are naturally present in crude petroleum and fossil fuels products, such as gasoline and diesel fuel.5,6 BTXs constitute a significant percentage of petroleum products; for example, the commercial gasoline contains between 18 to 25% (w/w) of those compounds.5 On the other hand, the overall concentration of pyrene, B(b)F and B(a)P in standard gasoline only corresponds to 0.002% (w/w).7
In the costal zones, PAHs and MAHs present in sewers, industrial effluents and those generated by forest fires can pollute groundwater and drinking water reservoirs.6 At sea, the aromatic hydrocarbons severely pollute sea water, predominantly through oil seeps and spills, and water discharged from offshore oil installations.6 Table S1,† shows a resume of concentration ranges of these compounds in different real samples.
Nowadays many materials have been used in the remediation of water contaminated with MAHs and PAHs, such as activated carbon, zeolites, microorganisms, among others.8–12 However, these methods show some drawbacks, including the removal of trace amounts of those hydrocarbons and the cost related to pre- and post-treatments is considerable.8
The use of low cost and environmentally friendly sorbents in the remediation of contaminated environments, especially those consisting of natural polymers, have been receiving significant interest in the last decades.11,13
Chitosan (CS) is a polycationic polysaccharide found naturally in the shellfish exoskeleton and crustaceous. Chitosan is the most commonly used cationic biopolymer (positively charged at pH < 6.5).14 The CS is non-toxic, biocompatible and is able to form films and therefore it has found many applications in food industry, cosmetic fabrication, among others.15 CS has amine and hydroxyl groups in its structure, susceptible of modification, which makes this biopolymer more chemically versatile than others.16,17 Recently, numerous papers have been published making the use of CS as adsorbent for a wide range of environmental contaminants, such as organic compounds, mainly because the high content of the referred amino and hydroxyl groups.18
Pectin (Pec) is an anionic heteropolysaccharide, based on α-(1-4) linked D-galacturonic acid, present on the cell walls of dicots.19 Pectin has been used to remove pollutants (e.g., heavy metals and dyes) through the functionalization of carboxylic groups.11,20 Furthermore, it has been shown that the chemical modification of the pectin structure can contribute to the improvement of its properties through the increase of swelling degree which reflects in important changes on release and adsorption of solutes.21 These modifications, namely transesterification reactions,22 allow to evaluate the ability of β-cyclodextrin (β-CD) and poly(vinyl alcohol) (PVA) to improve the pollutant removal/solubilisation.
β-CD is a cyclic oligosaccharide composed by seven glucose units, formed through α-1,4-glucosidic linkages. β-CD has a hydrophobic internal cavity and hydrophilic outer surface. Due to their structure, cyclodextrins readily form inclusion host-guest complexes, through covalent interactions, with a broad range of organic and inorganic guest molecules.23 Among the organic compounds that are able to form complexes with β-CD, we may refer BTXs and PAHs in such a way that the use of β-CDs can efficiently contributes for the remediation of contaminated environments.24,25
Poly(vinyl alcohol) (PVA) is a water-soluble, non-toxic, non-carcinogenic and easily processed polymer. PVA has also the ability to form physical and chemically-crosslinked hydrogels that exhibit high degree of swelling in water, and a rubbery and elastic nature.26 Recently, it has been found that PVA can adopt a myriad of structures, making the PVA to behave as an amphiphilic polymer.27 The modification of different substrates with PVA has caused improvements in removal efficiency of BTXs.28 This ability has been justified by the interaction between the hydroxyl groups and the π-benzene electron clouds and, in this way, the selectivity and solubility of benzene are improved.28
Here we report the synthesis and characterization of blend gels of chitosan and pectin (either in the native state or modified with β-CD or PVA) for the removal of aromatic hydrocarbons. The gels were formed through electrostatic interactions between positively and negatively charged groups of CS and Pec, respectively,15,29 by using an oil-in-water (o/w) emulsion.30 Both modified pectin and the obtained hydrogels have been evaluated using several techniques, such as thermogravimetric analysis (TGA), Fourier-transform infrared spectroscopy (FTIR) and scanning electron microscopy (SEM). Besides, the swelling properties of the obtained hydrogels were determined gravimetrically and the performance of the hydrogels to the simultaneous sorption of the BTXs and selected PAHs (pyrene, B(a)F and B(a)P) has been also assessed. Finally, the capacity of those hydrogels to BTXs and PAHs removal, from a real gasoline sample, has been measured and discussed.
2. Experimental section
2.1. Materials
β-cyclodextrin (>98%), pectin from apple (MV: 9000; 73.9% esterification), sulfuric acid (96.5%), poly(vinyl alcohol) (Mwca. 13![[thin space (1/6-em)]](https://www.rsc.org/images/entities/char_2009.gif) 000; 98.0–98.8 mol% hydrolysis), dimethylformamide (DMF) (99%), acetone (99.7%) and dialysis tubing cellulose membrane (molecular weight cut-off: 14
000; 98.0–98.8 mol% hydrolysis), dimethylformamide (DMF) (99%), acetone (99.7%) and dialysis tubing cellulose membrane (molecular weight cut-off: 14![[thin space (1/6-em)]](https://www.rsc.org/images/entities/char_2009.gif) 000 Da MWCO) were obtained from Sigma-Aldrich (Germany). Chitosan with acetylation degree of 15 mol% (MwA: 87 × 103 g mol−1) was purchased from Golden-Shell Biochemical (China). Benzyl alcohol (99%) was obtained from Merck KGaA (Germany).
000 Da MWCO) were obtained from Sigma-Aldrich (Germany). Chitosan with acetylation degree of 15 mol% (MwA: 87 × 103 g mol−1) was purchased from Golden-Shell Biochemical (China). Benzyl alcohol (99%) was obtained from Merck KGaA (Germany).
Benzene (ben) (>99.7%) and xylene (xyl) (mixture of isomers >97%) were purchased from Merck KGaA (Germany) and toluene (tol) (>99.8%) was obtained from Lab-Scan (Poland). Pyrene (pyr) (GC grade > 97%), benzo(b)fluoranthene (B(b)F) (HPLC grade > 98%) and benzo(a)pyrene (B(a)P) (>96%) were purchased from Sigma-Aldrich (Germany).
Acetonitrile and methanol, HPLC grade, were purchased from Fisher Scientific (UK) and Sigma-Aldrich (Germany), respectively. Deionized water was obtained using a Millipore© system. All reagents were used without further purification.
2.2. Procedure for hydrocarbon quantification
The quantification of BTXs (benzene, toluene and xylenes) and some PAHs (pyrene, benzo(b)fluoranthene and benzo(a)pyrene) was performed in a VWR-Hitachi LaChrom Elite HPLC system (Hitachi, Japan), equipped with a degasser, auto sampler, column oven and diode array detector (DAD), according to the previously optimized method.31An analytical column (0.25 m × 4.6 mm, 5 μm film) Purospher® Star RP-18 end capped (Merck-Millipore, Germany) was used. The data acquisition and processing were done using EZChrom Elite software (Agilent, USA). Hydrocarbons solutions were daily prepared and calibration curves were obtained for each of the hydrocarbons.
Briefly, the following methodology has been used: aqueous solutions of PAHs and BTX were analyzed in HPLC-DAD system, in gradient mode, using a ternary mixture as the mobile phase (methanol, acetonitrile and ultrapure water, 20![[thin space (1/6-em)]](https://www.rsc.org/images/entities/char_2009.gif) :
:![[thin space (1/6-em)]](https://www.rsc.org/images/entities/char_2009.gif) 50
50![[thin space (1/6-em)]](https://www.rsc.org/images/entities/char_2009.gif) :
:![[thin space (1/6-em)]](https://www.rsc.org/images/entities/char_2009.gif) 30%), by direct injection of each sample (20 μL) with a flow rate of 1.5 mL min−1. The detection of BTXs and PAHs were analytically determined at the following wavelengths: λ(ben) = 207 nm, λ(tol and xyl) = 211 nm, λ(pyr) = 239 nm, λ(B(b)F and B(a)P) = 256 nm.
30%), by direct injection of each sample (20 μL) with a flow rate of 1.5 mL min−1. The detection of BTXs and PAHs were analytically determined at the following wavelengths: λ(ben) = 207 nm, λ(tol and xyl) = 211 nm, λ(pyr) = 239 nm, λ(B(b)F and B(a)P) = 256 nm.
2.3. Functionalization of pectin
After this period, the reaction mixture was cooled to room temperature and precipitated in acetone. The precipitate was separated by centrifugation, dissolved again and dialyzed in a cellulose membrane against Milli-Q© water at 25 °C. The water was renewed every 12 hours for 3 days. The Pec-β-CD (53% yield) was dried by lyophilisation for 24 hours at −55 °C on a Free Zone 4.5 Liter Benchtop vacuum freeze-drying system (USA) equipment.
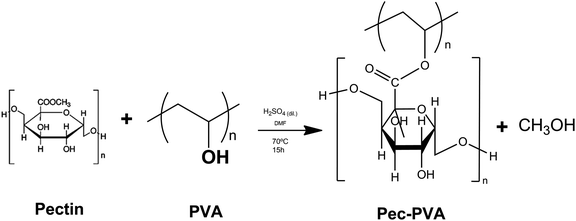
The reaction was cooled to room temperature; the product was precipitated by addition of excess acetone, separated by filtration, washed several times with ethanol and dialyzed in a cellulose membrane against Milli-Q© water at 25 °C. Finally, the Pec-PVA was dried by lyophilisation, for 24 hours, resulting in a 56% yield.
2.4. Hydrogels prepared by emulsion technique (oil-in-water)
Aqueous solution of the CS (1% w/v) was prepared in acetate buffer (1% w/w) and then filtered through a paper filter to remove insoluble substances (weight loss on the filtration process <1%). Pectin, Pec-β-CD and Pec-PVA aqueous solutions were prepared in phosphate buffer (pH 9.1) under stirring for 2 hours, at room temperature.33The emulsions were obtained by mixing aqueous phase of the CS solution (1 mL) and pectin, or Pec-β-CD or Pec-PVA solution (1 mL) in a beaker with benzyl alcohol (oil phase, 5 mL) using a Ultra-Turrax at 34 × 103 rpm for 5 minutes.33 From all tested formulations (Table 1) only those corresponding to 1![[thin space (1/6-em)]](https://www.rsc.org/images/entities/char_2009.gif) :
:![[thin space (1/6-em)]](https://www.rsc.org/images/entities/char_2009.gif) 1 ratio of CS
1 ratio of CS![[thin space (1/6-em)]](https://www.rsc.org/images/entities/char_2009.gif) :
:![[thin space (1/6-em)]](https://www.rsc.org/images/entities/char_2009.gif) Pec blends formed hydrogels.
Pec blends formed hydrogels.
| Samples | CS (1% w/v) in acetate buffer (%) | Pec (1% w/v) in pH 9.1 buffer (%) | Pec-β-CD (1% w/v) in pH 9.1 buffer (%) | Pec-PVA (1% w/v) in pH 9.1 buffer (%) | Benzyl alcohol (v/v) (%) |
|---|---|---|---|---|---|
Pec/CS (1![[thin space (1/6-em)]](https://www.rsc.org/images/entities/char_2009.gif) : :![[thin space (1/6-em)]](https://www.rsc.org/images/entities/char_2009.gif) 1) 1) |
12.5 | 12.5 | 0 | 0 | 75 |
Pec/CS (1![[thin space (1/6-em)]](https://www.rsc.org/images/entities/char_2009.gif) : :![[thin space (1/6-em)]](https://www.rsc.org/images/entities/char_2009.gif) 2) 2) |
8.3 | 16.7 | 0 | 0 | 75 |
Pec/CS (2![[thin space (1/6-em)]](https://www.rsc.org/images/entities/char_2009.gif) : :![[thin space (1/6-em)]](https://www.rsc.org/images/entities/char_2009.gif) 1) 1) |
16.7 | 8.3 | 0 | 0 | 75 |
Pec-β-CD/CS (1![[thin space (1/6-em)]](https://www.rsc.org/images/entities/char_2009.gif) : :![[thin space (1/6-em)]](https://www.rsc.org/images/entities/char_2009.gif) 1) 1) |
12.5 | 0 | 12.5 | 0 | 75 |
Pec-β-CD/CS (1![[thin space (1/6-em)]](https://www.rsc.org/images/entities/char_2009.gif) : :![[thin space (1/6-em)]](https://www.rsc.org/images/entities/char_2009.gif) 2) 2) |
8.3 | 0 | 16.7 | 0 | 75 |
Pec-β-CD/CS (2![[thin space (1/6-em)]](https://www.rsc.org/images/entities/char_2009.gif) : :![[thin space (1/6-em)]](https://www.rsc.org/images/entities/char_2009.gif) 1) 1) |
16.7 | 0 | 8.3 | 0 | 75 |
Pec-PVA-CS (1![[thin space (1/6-em)]](https://www.rsc.org/images/entities/char_2009.gif) : :![[thin space (1/6-em)]](https://www.rsc.org/images/entities/char_2009.gif) 1) 1) |
12.5 | 0 | 0 | 12.5 | 75 |
Pec-PVA/CS (1![[thin space (1/6-em)]](https://www.rsc.org/images/entities/char_2009.gif) : :![[thin space (1/6-em)]](https://www.rsc.org/images/entities/char_2009.gif) 2) 2) |
8.3 | 0 | 0 | 16.7 | 75 |
Pec-PVA/CS (2![[thin space (1/6-em)]](https://www.rsc.org/images/entities/char_2009.gif) : :![[thin space (1/6-em)]](https://www.rsc.org/images/entities/char_2009.gif) 1) 1) |
16.7 | 0 | 0 | 8.3 | 75 |
The resulting hydrogel blends were washed with acetone five times to remove unreacted substances and dried in desiccators at room temperature for 24 hours. The hydrogels were labelled according to their composition as Pec/CS or Pec-β-CD/CS or Pec-PVA/CS as described in Table 1.
2.5. Characterization of modified pectin and hydrogels
The synthesized Pec-β-CD and Pec-PVA and the hydrogels (Pec/CS, Pec-β-CD/CS and Pec-PVA/CS) have been characterized by different techniques.Attenuated reflection infrared spectroscopy (ATR-FTIR) was performed in a Varian Cary 630 FTIR Spectrometer, with wavenumber ranging from 650 to 4000 cm−1.
Thermograms were obtained in a TG209 F3 Tarsus thermogravimetric analyzer (Netzsch Instruments). Samples (ca. 10 mg) were weighed in alumina pans and heated from 30 °C to 900 °C at a heating rate of 10 °C min−1 under N2 atmosphere (flow rate of 20 mL min−1).
Surface morphologies of hydrogel samples were observed by scanning electron microscopy, using a Tescan-VEGA3 SEM. For this purpose, samples were previously frozen at −20 °C and then lyophilized (Free Zone 4.5-Labconco) before being sputter-coated with a thin gold-layer.
Hydrogen nuclear magnetic resonance (1H NMR) spectra of Pec-β-CD, Pec-PVA and their precursors (Pec, PVA and β-CD), were recorded on Bruker Avance III 400 NMR spectrometer by dissolving the samples in deuterium oxide (D2O, isotope substitution > 99.9% from Eurisotop). TSP ((3-(trimethylsilyl)-2,2′,3,3′-tetradeuteriopropionic acid), EurisoTop, at concentration < 1 μM, was used as internal reference. In particular, for the PVA and Pec-PVA analysis, about 7 mg of sample were dissolved in 0.7 mL D2O.
The swelling (equilibrium and kinetics) of the hydrogels in water were studied by measuring the mass of swollen hydrogel and xerogel (mt and mx, respectively), at different times, t, by using eqn (1)34 and following the procedure described in a previous work.35
 | (1) |
2.6. Sorption studies
Stock solutions containing a mixture of BTXs and PAHs were prepared by dissolving appropriated amounts of different analytes in methanol; the concentration of each analyte in that solution was 1000 mg L−1. The resulting solution was stored in an amber glass at −20 °C. The stock solution was then diluted with MeOH![[thin space (1/6-em)]](https://www.rsc.org/images/entities/char_2009.gif) :
:![[thin space (1/6-em)]](https://www.rsc.org/images/entities/char_2009.gif) H2O (70
H2O (70![[thin space (1/6-em)]](https://www.rsc.org/images/entities/char_2009.gif) :
:![[thin space (1/6-em)]](https://www.rsc.org/images/entities/char_2009.gif) 30 v/v)) mixture in order to prepare the working solutions (Tables S2 and S3†).
30 v/v)) mixture in order to prepare the working solutions (Tables S2 and S3†).
The concentration of hydrocarbons sorbed by the hydrogel (qe) was obtained as mass of the adsorbate removed per unit mass of the adsorbent (mg g−1), calculated according to eqn (2):38
 | (2) |
The removal efficiency (RE) was computed according to the following equation:39
 | (3) |
The capacity of hydrogels for the removal of BTXs and PAHs existing in a real gasoline sample was also evaluated. For that, hydrogels (ca. 4 mg) supported by a nylon tea-bag were introduced in a screw-caps glass tube. After that, a MeOH![[thin space (1/6-em)]](https://www.rsc.org/images/entities/char_2009.gif) :
:![[thin space (1/6-em)]](https://www.rsc.org/images/entities/char_2009.gif) H2O mixture (70
H2O mixture (70![[thin space (1/6-em)]](https://www.rsc.org/images/entities/char_2009.gif) :
:![[thin space (1/6-em)]](https://www.rsc.org/images/entities/char_2009.gif) 30 v/v), commercial gasoline diluted in methanol (ca. 1500 times) and BTXs and PAHs standard solutions at average concentration 3 mg L−1 and 0.7 mg L−1, respectively, were added, with a final volume of 40 mL. The mixture was stirred at 25 °C during one day. The amount of the BTXs and PAHs adsorbed onto blend hydrogels, in each run, was determined by measuring the concentration of those analytes occurring in the supernatant solution, before and after sorption process.
30 v/v), commercial gasoline diluted in methanol (ca. 1500 times) and BTXs and PAHs standard solutions at average concentration 3 mg L−1 and 0.7 mg L−1, respectively, were added, with a final volume of 40 mL. The mixture was stirred at 25 °C during one day. The amount of the BTXs and PAHs adsorbed onto blend hydrogels, in each run, was determined by measuring the concentration of those analytes occurring in the supernatant solution, before and after sorption process.
![[thin space (1/6-em)]](https://www.rsc.org/images/entities/char_2009.gif) :
:![[thin space (1/6-em)]](https://www.rsc.org/images/entities/char_2009.gif) H2O (70
H2O (70![[thin space (1/6-em)]](https://www.rsc.org/images/entities/char_2009.gif) :
:![[thin space (1/6-em)]](https://www.rsc.org/images/entities/char_2009.gif) 30 v/v) mixture, acidified to pH 3 (using HCl), and left stirring (at 450 rpm) for 5 days, at 25 °C (labeled as Des. 1). The concentrations of BTXs and PAHs were then measured by HPLC and the desorption ratio (DR) was calculated according to the following equation
30 v/v) mixture, acidified to pH 3 (using HCl), and left stirring (at 450 rpm) for 5 days, at 25 °C (labeled as Des. 1). The concentrations of BTXs and PAHs were then measured by HPLC and the desorption ratio (DR) was calculated according to the following equation | (4) |
The blend hydrogels used in the desorption process (Des. 1) were put in contact again with the BTXs and PHAs mixed solutions in MeOH![[thin space (1/6-em)]](https://www.rsc.org/images/entities/char_2009.gif) :
:![[thin space (1/6-em)]](https://www.rsc.org/images/entities/char_2009.gif) H2O (70
H2O (70![[thin space (1/6-em)]](https://www.rsc.org/images/entities/char_2009.gif) :
:![[thin space (1/6-em)]](https://www.rsc.org/images/entities/char_2009.gif) 30 v/v), as described above. After five days of contact, a new desorption process (Des. 2) was finalized and the concentrations of BTXs and PAHs were obtained using the same procedure as previously described for Des. 1.
30 v/v), as described above. After five days of contact, a new desorption process (Des. 2) was finalized and the concentrations of BTXs and PAHs were obtained using the same procedure as previously described for Des. 1.
![[thin space (1/6-em)]](https://www.rsc.org/images/entities/char_2009.gif) :
:![[thin space (1/6-em)]](https://www.rsc.org/images/entities/char_2009.gif) H2O (70
H2O (70![[thin space (1/6-em)]](https://www.rsc.org/images/entities/char_2009.gif) :
:![[thin space (1/6-em)]](https://www.rsc.org/images/entities/char_2009.gif) 30 v/v). The amount of analyte sorbed was calculated by subtracting the amount of each analyte at t = 0 and at time t, measured by HPLC in the liquid phase, and after correction of the diluting effect. The system was held at 25 °C into a thermostatic bath (Multistirrer 6 from Velp Scientifica) under constant stirring (450 rpm); other experimental details were similar to those described for sorption isotherms.
30 v/v). The amount of analyte sorbed was calculated by subtracting the amount of each analyte at t = 0 and at time t, measured by HPLC in the liquid phase, and after correction of the diluting effect. The system was held at 25 °C into a thermostatic bath (Multistirrer 6 from Velp Scientifica) under constant stirring (450 rpm); other experimental details were similar to those described for sorption isotherms.
2.7. Post-sorption characterization of hydrogels
The effect of BTXs and some PAHs in the hydrogels (Pec/CS, Pec-β-CD/CS and Pec-PVA/CS) has been evaluated by ATR-FTIR, thermogravimetric analysis and scanning electron microscopy, using the same procedure as described in Section 2.5.3. Results and discussion
3.1. Synthesis of Pec-β-CD and Pec-PVA
The pectin functionalization was evaluated by 1H NMR (Fig. 1). In the case of functionalization of Pec with β-CD (Fig. 1A), the 1H NMR spectrum of β-CD shows a doublet at δ 4.99 ppm assigned to H1 atoms (located outside the cavity between H4 and H2 atoms). Furthermore, the resonances occurring at δ 3.77–3.88 ppm are assigned to H3 atoms located at the wide side of the cavity.40 The overlapping resonances for the atoms H5, H6′ and H6′′ are found at δ 3.66–3.76 ppm.40,41 Resonances at δ 3.64, δ 3.86, δ 4.17 and δ 5.07 ppm that can be visualized in 1H NMR spectrum of Pec-β-CD (Fig. 1A) were assigned to pectin backbone. Resonances at δ 3.50–3.60 ppm and δ 3.80–3.90 ppm were also observed in such spectrum and are due to β-CD. These findings proved that the expected chemical modification effectively occurred in the structure of pectin with the insertion of β-CD.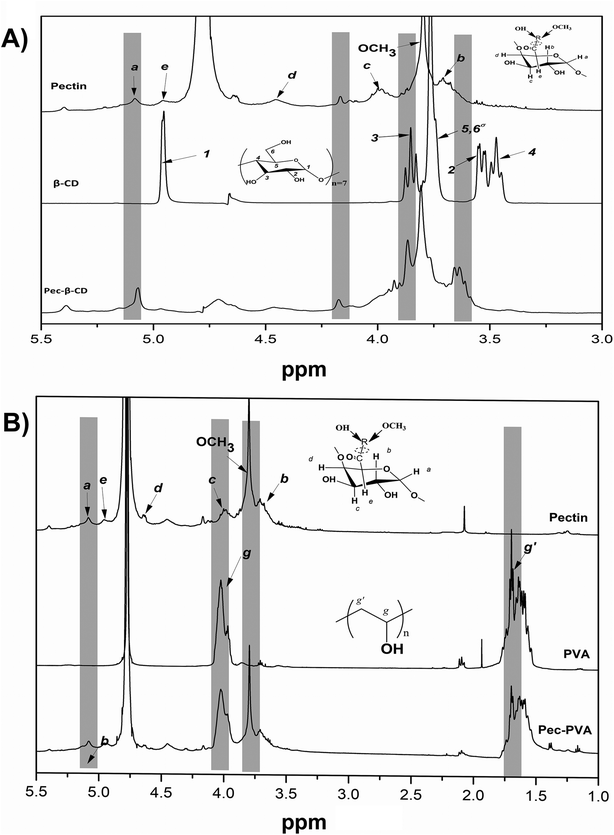 | ||
| Fig. 1 1H NMR spectra (D2O) of (A) pectin, β-CD and Pec-β-CD and (B) pectin, PVA (10% w/v in D2O) and Pec-PVA. | ||
The two broad multiplets at δ 1.45–1.81 ppm and δ 3.9–4.1 ppm present in PVA 1H NMR spectrum shown in Fig. 1B, were assigned to PVA polymer hydrocarbon backbone (Hg, Hg′–CH2–CH–(OH)–)n.42 Moreover the resonances at δ 1.50–1.70 ppm and δ 3.90–4.10 ppm in the spectra of Pec-PVA (Fig. 1B) were ascribed to PVA polymer hydrocarbon backbone. The resonances at δ 3.60–3.90 and 4.90–5.10 ppm in such spectrum, which correspond to pectin backbone, proved the addition of the PVA chains in the pectin structure.
In both cases, the composition of the modified pectin were also estimated from 1H NMR spectra, using the equation defined in a previous work.43 Pectin-β-CD was modified with ∼20% of β-CD and Pec-PVA has ∼17% of pectin.
FTIR analysis was also done in order to further investigate the interactions between the polysaccharides. Fig. 2A shows the FTIR spectra of pectin, β-CD and Pec-β-CD. These spectra are characterized by the following vibrational bands: (i) the strong band at 3408 cm−1 was assigned to –OH stretching vibration; (ii) the peak at 2943 cm−1 was attributed to the methylene stretching vibrations of the alkyl chains of the polysaccharides; (iii) and the most significant bands relative to the pectin can be observed at 1761 cm−1, originated by C![[double bond, length as m-dash]](https://www.rsc.org/images/entities/char_e001.gif) O stretching, at 1634 cm−1 (due the asymmetric stretching of C
O stretching, at 1634 cm−1 (due the asymmetric stretching of C![[double bond, length as m-dash]](https://www.rsc.org/images/entities/char_e001.gif) O), and at ca. 1000 cm−1 (the finger-print region, 1200–800 cm−1), typical of pectin polymers and assigned to the C–O stretching.44,45 For Pec-β-CD, a characteristic peak at 1761 cm−1 assigned to the C
O), and at ca. 1000 cm−1 (the finger-print region, 1200–800 cm−1), typical of pectin polymers and assigned to the C–O stretching.44,45 For Pec-β-CD, a characteristic peak at 1761 cm−1 assigned to the C![[double bond, length as m-dash]](https://www.rsc.org/images/entities/char_e001.gif) O of pectin as well as a peak at 1406 cm−1 due to β-CD can be clearly observed. The intensity of the peaks at 3408, 1634 and 1406 cm−1 increased upon β-CD incorporation, indicating the formation of new covalent bonds.46
O of pectin as well as a peak at 1406 cm−1 due to β-CD can be clearly observed. The intensity of the peaks at 3408, 1634 and 1406 cm−1 increased upon β-CD incorporation, indicating the formation of new covalent bonds.46
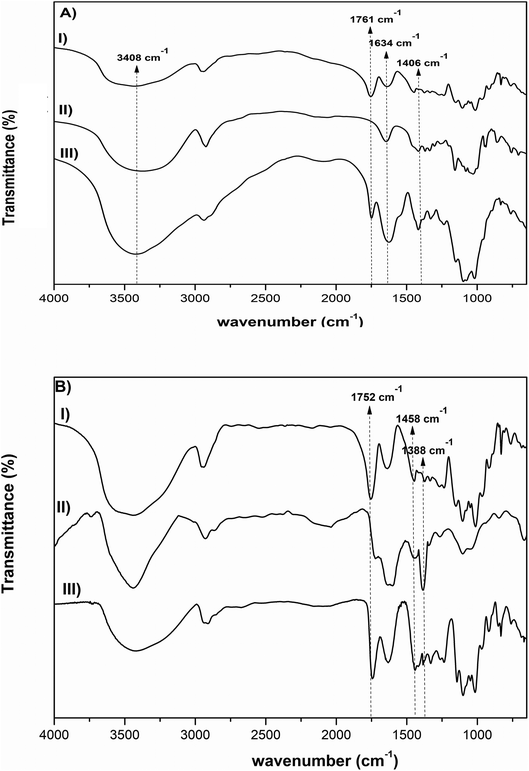 | ||
| Fig. 2 FTIR spectra of (A) pectin, β-CD, Pec-β-CD (I, II and III, respectively), and (B) pectin, PVA, Pec- PVA (I, II and III, respectively). | ||
The FTIR spectrum of PVA (Fig. 2B) shows several characteristic bands: a broad band at 3800–3200 cm−1 assigned to the –OH vibration, the C–H stretching vibration at 2926 cm−1, the sharp band at 1635 cm−1 corresponds to the C–O stretching, and the band observed at 1355 cm−1 has been attributed to combination frequencies of CH–OH. These vibrational modes are also present in pectin and Pec-PVA FTIR spectra.
The FTIR spectrum of Pec-PVA showed a peak at 1752 cm−1, which was related to the stretching of the C![[double bond, length as m-dash]](https://www.rsc.org/images/entities/char_e001.gif) O bonds, that is not present in the PVA spectrum. It is also possible to note a higher intensity in the peaks at 1458 and 1388 cm−1 as compared to the pectin FTIR spectrum, thus evidencing the presence of both polymers in Pec-PVA, as expected.47,48 Both FTIR spectroscopy and 1H NMR revealed pectin modification.
O bonds, that is not present in the PVA spectrum. It is also possible to note a higher intensity in the peaks at 1458 and 1388 cm−1 as compared to the pectin FTIR spectrum, thus evidencing the presence of both polymers in Pec-PVA, as expected.47,48 Both FTIR spectroscopy and 1H NMR revealed pectin modification.
3.2. Hydrogels characterization
Fig. 3 shows the ATR-FTIR spectra of the three different synthesized hydrogels. The spectra are characterized by the following vibrational bands: the strong band at 3408 cm−1 is assigned to the hydroxyl stretching vibration of the polysaccharides; the broad band/shoulder at 3355–3300 cm−1 can be assigned to the –OH and –NH stretching of PVA and chitosan; the C–H stretching vibration is observed by the band at 2926 cm−1; the vibrational mode at 1638 cm−1 is due to –C![[double bond, length as m-dash]](https://www.rsc.org/images/entities/char_e001.gif) O stretching; the band at 1420 cm−1 was ascribed to C–H deformation vibration; and the bands at ca. 1022 cm−1, in the finger-print region (1200–800 cm−1), are typical of pectin polymers and can be assigned to the C–O stretching.44
O stretching; the band at 1420 cm−1 was ascribed to C–H deformation vibration; and the bands at ca. 1022 cm−1, in the finger-print region (1200–800 cm−1), are typical of pectin polymers and can be assigned to the C–O stretching.44
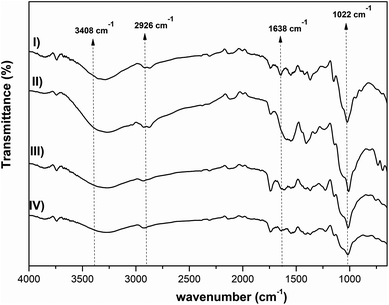 | ||
| Fig. 3 FTIR spectra of CS, Pec/CS, Pec-β-CD/CS, Pec-PVA/CS hydrogels (I, II, III and IV), respectively. | ||
The effect of pectin functionalization on the thermal stability of hydrogels was evaluated by thermogravimetric analysis (Fig. 4).
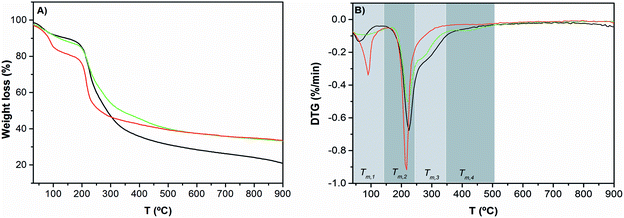 | ||
Fig. 4 TGA curves (A) and DTG curves (B) of Pec/CS ( ), Pec-β-CD/CS ( ), Pec-β-CD/CS ( ) and Pec-PVA/CS ( ) and Pec-PVA/CS ( ). See the text for the meaning of Tm,i. ). See the text for the meaning of Tm,i. | ||
T m,i is the maximum degradation rate at temperature range i. By comparing the Tm,i for functionalized and non-functionalized blends, for a giving temperature range i, it can be concluded that the incorporation of PVA or β-CD in pectin has a significant effect on the thermal behavior of modified pectin/CS blends. For the first degradation step (T1), the functionalization of pectin leads to a smaller water weight loss, from 19% (for Pec/CS) to 12% (for Pec-β-CD/CS) and 10% (for Pec-PVA/CS) and a lower Tm,1, from 90 to 62 °C and 83 °C, respectively. Concerning the main degradation step (Tm,2), it has been found that for Pec/CS: Tm,2 = 217 °C. This maximum degradation temperature was essentially assigned to pectin degradation (235 °C).49 The difference between such temperatures was due to the formation of the blend by coacervation. It is also worth noticing that the thermal degradation step assigned to chitosan (T = 310 °C)50 was detected for this blend, as shown in DTG curves (Fig. 4B). However, the previous functionalization of pectin before the formation of the blend gels leads to a decrease in electrostatic interactions between the positively charged chitosan and the negatively charged pectin, inducing some phase separation. Consequently, the Tm,2 for both blends (225 and 224 °C for β-CD- and PVA-modified pectin-containing blends, respectively) approaches the value for pectin. This is accompanied by the occurrence of shoulders in the DTG curves at temperatures around 276 °C (Tm,3), which might be related with the chitosan degradation temperature; i.e., the functionalization of pectin makes the blend more heterogeneous. Further degradation step for the PVA-containing gel was found at Tm,4 = 419 °C and was ascribed to PVA and suggests a loss of the PVA crystallinity.27
The surface morphology of adsorbents was also studied by SEM (Fig. 5). The SEM image for PEC/CS blend shows a featureless morphology. However, significant differences in the surface morphology occur if β-CD- and PVA-functionalized pectin was used to prepare the blend. The surface β-CD-containing blend is more rough and heterogeneous and, when the cross section is visible, there are indications that lamellar structure (see zoom in insight picture – Fig. 5B) was formed; on the other hand, the Pec-PVA/CS surface is more irregular and exhibits granule-like structure.
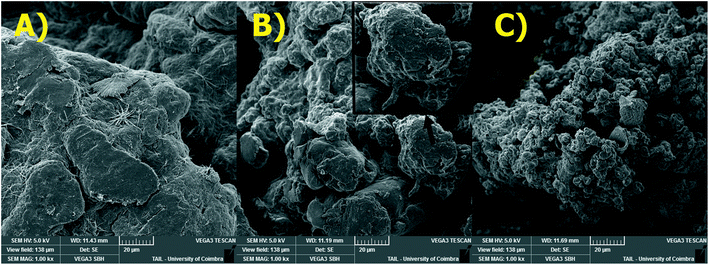 | ||
| Fig. 5 SEM images of: (A) Pec/CS; (B) Pec-β-CD/CS and (C) Pec-PVA/CS hydrogels (magnification: ×1000). Scale = 20 μm. | ||
3.3. Swelling degree
The effect of pectin functionalization on the structure of blend hydrogels was further analyzed by measuring the swelling degree at 25 °C (Fig. 6). The presence of CD or PVA on modified-pectin strongly affects the gels' ability to swell (see Qe values in Table 2) in agreement with data obtained from TGA and SEM images. Although both CD and PVA possess characteristic amphiphilic features,27,51 it should be expected that PVA would contribute to the occurrence of a more heterogeneous and porous blend and, consequently, its hydrophilicity was enhanced because it showed higher swelling capacity (4-fold higher than for Pec/CS).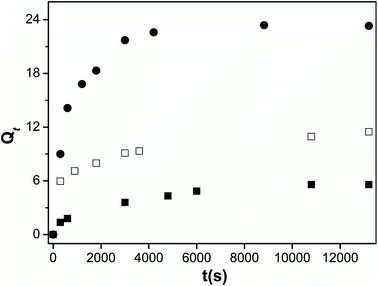 | ||
| Fig. 6 Swelling kinetics of Pec/CS (■), Pec-β-CD/CS (□) and Pec-PVA/CS (●) hydrogels in water, at 25 °C. | ||
In order to get an insight on the water sorption mechanism, the swelling kinetics was evaluated using first- and second-order kinetic equations,52 by using the following linearized equations, respectively:
 | (5) |
 | (6) |
 | (7) |
3.4. Sorption kinetics
The sorption kinetics allows an evaluation concerning the time necessary to attain the sorption equilibrium as well as to give an insight on the kinetic mechanism. Fig. 7 shows representative sorption kinetics of benzene present, in BTXs and PAHs mixed solutions, onto Pec/CS, Pec-β-CD/CS and Pec-PVA/CS hydrogels, at 25 °C. On average, the time needed for reaching the equilibrium ranged from 2.6 to 4.1 hours, depending on the initial concentration C0 of adsorbate. | ||
| Fig. 7 Sorption kinetic of benzene, in BTXs and PAHs mixed solutions, onto (A) Pec/CS, (B) Pec-β-CD/CS and (C) Pec-PVA/CS hydrogels, at 25 °C and for several benzene C0 values. The arrow indicates the direction of higher concentrations (for further details see Table S3†). The solid lines are just a guide for the eyes. | ||
For such multi-compound systems, the adsorption can be affected by different factors, such as adsorbent–adsorbate and adsorbate–adsorbate interactions, and gel swelling. In these circumstances the modelling of sorption kinetics is better suited by the pseudo-first-order and pseudo-second-order kinetic models,54,55 since they only take into account the effect of the overall measured macroscopic parameter on the integral sorption rate. These models can be described, respectively, by eqn (5) and (6) where Qe and Qt must be replaced by qt and qe (both in mg g−1) – the amounts of the adsorbate sorbed at time t and at equilibrium, respectively.
The fitting parameters of eqn (5) and (6) to experimental sorption data for BTXs and PAHs, and the corresponding AIC, are reported in the ESI (Fig. S1–S3 and Tables S4–S6†). The sorption kinetics for all adsorbates follows a first-order kinetic model. This model suggests that the sorption is a diffusion-controlled process, in line with the fact that physisorption is the rate limiting phenomenon in the sorption mechanism, being characterized by the occurrence of a multilayer sorption and by semi-reversible sorption/desorption cycles.18,56 This will be discussed in the following sections.
3.5. Sorption isotherms
Fig. S4† shows the sorption isotherms for all six aromatic compounds sorbed by the three blend hydrogels. From a general overview, it can be concluded that the sorbed amount of adsorbate increases by increasing the initial concentration, suggesting that the mass transfer is driven by the concentration gradient; these results seem to be in agreement with those reported by Mohamed and Ouki18 for the sorption of toluene (with concentration ranging from 5 to 100 mg L−1) by chitosan (15 g L−1). It can also be noticed that in all cases the sorption process is cooperative, which agrees with the occurrence of multilayer adsorption characterized by short-range interactions, in agreement with the discussion carried out in the previous section.In order to go deeper on the sorption mechanism, Freundlich57 and BET58 models have been fitted to the experimental sorption data. These models can be expressed by using the following equations, respectively,
| qe = KFCe1/nF | (8) |
 | (9) |
In eqn (8), KF is the Freundlich isotherm constant, indicative of the relative sorption capacity and nF is a constant related with surface heterogeneity.59 In eqn (9), CBET, Cs and qs are the BET adsorption isotherm parameters, related to the energy of surface interaction, adsorbate monolayer saturation concentration, and theoretical isotherm saturation capacity, respectively.57Table 3 summarizes the fitting parameters computed from the non-linear fitting58 of eqn (8) and (9) to experimental data (Fig. S4†), by using OriginLab software.
| Freundlich | BET | |||||||
|---|---|---|---|---|---|---|---|---|
| Pec/CS | C 0 (mg L−1) | K F (mg(n−1)/n L1/n g−1 | 1/nF | R 2 | q s (mg g−1) | C BET | C s (mg L−1) | R 2 |
| a *values inside brackets are standard deviations of the average; n/c: the fit does not converge. | ||||||||
| Benzene | 11.5–53.1 | 0.02 (±0.01) | 1.1 (±0.2) | 0.9055 | 0.42 (±0.04) | 19 (±14) | 66 (±2) | 0.9894 |
| Toluene | 10.5–57 | 0.01 (±0.01) | 1.3 (±0.1) | 0.9715 | 1.3 (±0.5) | 3 (±2) | 84 (±13) | 0.9909 |
| Xylenes | 9.5–60.5 | 0.002 (±0.002) | 1.8 (±0.2) | 0.9565 | 0.99 (±0.16) | 4 (±2) | 73 (±3) | 0.9948 |
| Pyrene | 2.1–12.5 | 0.03 (±0.01) | 1.3 (±0.1) | 0.9811 | n/c | |||
| B(b)F | 2–11.5 | 0.01 (±0.01) | 1.7 (±0.2) | 0.9819 | n/c | |||
| B(a)P | 2–13.1 | 0.02 (±0.01) | 1.5 (±0.1) | 0.9931 | n/c | |||
| Pec-β-CD/CS | K F (mg(n−1)/n L1/n g−1 | 1/nF | R 2 | q s (mg g−1) | C BET | C s (mg L−1) | R 2 | |
|---|---|---|---|---|---|---|---|---|
| Benzene | 11.4–38.7 | 0.003 (±0.001) | 2.2 (±0.2) | 0.9733 | 1.9 (±0.6) | 1.4 (±0.6) | 42 (±2) | 0.9974 |
| Toluene | 9.6–38.9 | 0.002 (±0.002) | 2.3 (±0.5) | 0.9069 | 0.7 (±0.1) | 8 (±5) | 38.1 (±0.7) | 0.9958 |
| Xylenes | 10.5–41 | 0.002 (±0.001) | 2.2 (±0.3) | 0.9594 | 1.0 (±0.2) | 3 (±1) | 44 (±2) | 0.9946 |
| Pyrene | 2.1–10.1 | 0.001 (±0.001) | 3.3 (±0.7) | 0.9321 | 0.14 (±0.01) | 19 (±16) | 9.1 (±0.1) | 0.9982 |
| B(b)F | 1.5–13.5 | 0.002 (±0.001) | 2.7 (±0.6) | 0.9349 | 0.22 (±0.01) | 5 (±1) | 13.2 (±0.2) | 0.9983 |
| B(a)P | 2.7–11.5 | 0.001 (±0.001) | 2.2 (±0.4) | 0.9370 | 0.18 (±0.01) | 5 (±1) | 1.6 (±0.2) | 0.9989 |
| Pec-PVA/CS | K F (mg(n−1)/n L1/n g−1 | 1/nF | R 2 | ||
|---|---|---|---|---|---|
| Benzene | 8.8–38.6 | 0.01 (±0.01) | 1.6 (±0.1) | 0.9830 | n/c |
| Toluene | 7.7–38.1 | 0.01 (±0.01) | 1.7 (±0.2) | 0.9817 | n/c |
| Xylenes | 7.0–37.1 | 0.01 (±0.01) | 1.7 (±0.1) | 0.9899 | n/c |
| Pyrene | 1.6–7.2 | 0.01 (±0.02) | 2.9 (±0.2) | 0.9952 | n/c |
| B(b)F | 0.8–6.6 | 0.02 (±0.01) | 2.2 (±0.1) | 0.9926 | n/c |
| B(a)P | 1.3–6.1 | 0.01 (±0.01) | 2.9 (±0.3) | 0.9820 | n/c |
The analysis of Table 3 shows that the simultaneous sorption of BTX and PAHs significantly depends on the adsorbent. In the case of Pec-PVA/CS, the sorption of all compounds is well justified by the Freundlich equation, with a heterogeneity factor higher than 1, indicating an occurrence of multilayer physically-based sorption. This mechanism is in agreement with the ability of these sorbents to interact via π–π stacking interactions. However, in the case of Pec/CS blend hydrogels the mechanism is essentially different for BTXs. This clearly suggests the occurrence of a monolayer which can be justified by the interaction between these compounds and pectin and/or chitosan.60 Although further work should be done to unveil such mechanism, we can hypothesise that short-range (weak) interactions are behind that mechanism; in fact, the water volume fraction of PVA-containing gel is 4 times higher than the corresponding blend without PVA (i.e., 0.04 and 0.16, respectively).61 Even so, the removal efficiency of BTXs and PAHs by PVA-containing blends is significantly higher than the RE obtained by using the Pec/CS blend (see discussion below), suggesting that the gel-phase obtained with the former gel stabilises the dissolution of all adsorbates.
For the Pec-β-CD/CS, the BET mechanism shows the better determination coefficient for all adsorbates. From the analysis of fitting parameters, it is clear that Cs values for BTXs are significantly higher than those obtained for PAHs; based on this, we can conclude that the concentration gradient and the size of adsorbates are key points on the sorption process.
Furthermore, it is also interesting to find out that Cs values for BTX in the Pec/CS are, in average, 45% smaller than those computed for Pec-β-CD/CS. Since the contribution of PAHs for the total Cs is not enough to reach that value, it can be anticipated that the presence of CD is limiting the occurrence of the monolayer. However, from the analysis of the removal efficiency we can conclude that β-CD is playing a major role in the sorption process (see Fig. 8). In fact, Pec-β-CD/CS shows, by far, the highest RE (ca. 102%). This RE is slightly higher than that found for the simultaneous sorption of the same adsorbates onto methyl-modified silica aerogel, prepared from methyltrimethoxysilane (MTMS) precursor62 and two times higher than that found for Pec/CS. The performance of the Pec-β-CD/CS towards benzene (used as a model molecule) sorption was also measured for the sake of comparison with other existing adsorbents. The RE for benzene has been measured and a value of 66.1 (±0.3)% was obtained. However, this value is lower than REs reported for carbon-based materials: for example, the sorption of benzene onto granular-activated carbon63 or multi-walled carbon nanotubes64 leads to RE of approximately 90 and 97.7%, respectively.
 | ||
| Fig. 8 Effect of aromatic compounds concentration on the simultaneous sorption efficiency of the (A) Pec/CS, (B) Pec-β-CD/CS and (C) Pec-PVA/CS hydrogels, at 25 °C. | ||
3.6. Sorption–desorption cycles
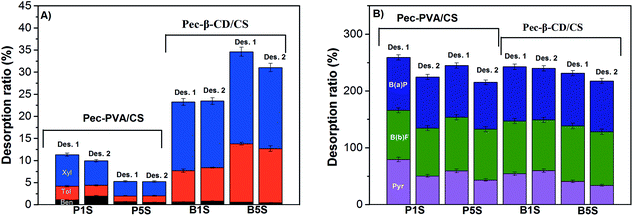
The production cost and reusability of the adsorbents are the most effective parameters for the sorbents in the contaminated environment treatment systems.65 Furthermore sorption–desorption studies may also give complementary information on the adsorbent–adsorbate interaction mechanism.Fig. 9 shows that the 2nd sorption process is relatively effective for Pec-β-CD and Pec-PVA-containing blends gels. It can also be observed that the removal efficiency for B(a)P and B(b)F does not vary from the 1st to 2nd sorption. On the other hand and in particular for β-CD-containing gel, the removal efficiency of BTXs significantly decreased. A rational for such evidences can be find from the analysis of desorption ratio (Fig. 10). B(b)F and B(a)P are significantly desorbed from hydrogels, with DR higher than 82%, whilst pyrene is only moderately desorbed with DR around 34%. On the other hand, BTXs are significantly retained by the hydrogels. Among them, benzene is the highest retained adsorbate, independently of the gel. This selectivity of both gels (Pec-PVA/CS and Pec-β-CD/CS) towards benzene is not easily justified. In fact, the association constant for β-CD-benzene is of same order of magnitude than those found for xylene;25 on the other side, it seems that the gel phase produced by the incorporation of PVA seems to stabilize BTXs. The latter can be understood (among other possible hypothesis) if the presence of PVA has a water-structure making66 in agreement with its amphiphilic properties recently discussed,27,51 and with the k2,w dependence on Qe, allowing a better dissolution of benzene, and in a less degree toluene and xylene.
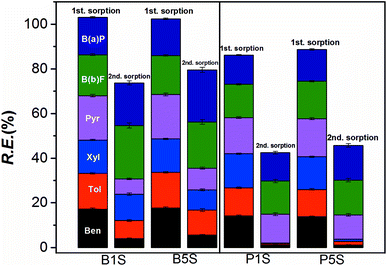 | ||
| Fig. 9 Comparative results on the removal efficiency (RE) of the BTXs and PHAs by the hydrogels (Pec-β-CD/CS (B1 and B5) and Pec-PVA/CS (P1 and P5)), after the first desorption (Des. 1). The data for the 1st sorption stage are duplicated (from Fig. 8) for the sake of comparison. | ||
3.7. Performance of hydrogels towards water contaminated with real petroleum sample
Here we intended to demonstrate the capacity of the Pec/CS, Pec-β-CD/CS and Pec-PVA/CS blend hydrogels for efficiently remove BTXs and PAHs from a commercial gasoline sample. Table 4 summarizes the initial concentrations (C0) of BTXs and some PAHs in the sample.| C 0 in the used commercial gasoline-before dilution (wt%) | C 0 in the spiked solution (mg L−1) | q e,exp (mg g−1) | Removal efficiency (%) | |
|---|---|---|---|---|
| a *values inside brackets are standard deviations of the average. | ||||
| Pec/CS | ||||
| Benzene | 0.09 (±0.01)* | 4.1 (±0.1) | 0.046 (±0.001) | 1.2 (±0.1) |
| Toluene | 0.75 (±0.01) | 7.4 (±0.2) | 0.057 (±0.001) | 0.83 (±0.04) |
| Xylenes | 1.31 (±0.04) | 11.2 (±0.4) | 0.090 (±0.002) | 0.87 (±0.04) |
| Pyrene | 0.011 (±0.001) | 1.3 (±0.1) | 0.052 (±0.001) | 4.3 (±0.3) |
| B(b)F | 4.0 (±0.1) × 10−4 | 0.31 (±0.03) | 0.007 (±0.001) | 2.3 (±0.1) |
| B(a)P | 5.0 (±0.2) × 10−3 | 0.49 (±0.02) | 0.034 (±0.003) | 7.5 (±0.4) |
![[thin space (1/6-em)]](https://www.rsc.org/images/entities/char_2009.gif) |
||||
| Pec-β-CD/CS | ||||
| Benzene | 0.09 (±0.01)* | 4.9 (±0.1) | 0.175 (±0.003) | 5.5 (±0.3) |
| Toluene | 0.75 (±0.01) | 9.4 (±0.3) | 0.238 (±0.004) | 3.9 (±0.2) |
| Xylenes | 1.31 (±0.04) | 15.2 (±0.5) | 0.158 (±0.003) | 1.6 (±0.1) |
| Pyrene | 0.011 (±0.001) | 0.97 (±0.03) | 0.059 (±0.001) | 9.3 (±0.5) |
| B(b)F | 4.0 (±0.1) × 10−4 | 0.61 (±0.02) | 0.036 (±0.001) | 9.0 (±0.3) |
| B(a)P | 5.0 (±0.2) × 10−3 | 0.99 (±0.03) | 0.066 (±0.001) | 10.2 (±0.5) |
![[thin space (1/6-em)]](https://www.rsc.org/images/entities/char_2009.gif) |
||||
| Pec-PVA/CS | ||||
| Benzene | 0.09 (±0.01)* | 3.9 (±0.1) | 0.119 (±0.003) | 3.4 (±0.2) |
| Toluene | 0.75 (±0.01) | 8.3 (±0.2) | 0.164 (±0.003) | 2.2 (±0.2) |
| Xylenes | 1.31 (±0.04) | 13.0 (±0.4) | 0.129 (±0.004) | 1.1 (±0.1) |
| Pyrene | 0.011 (±0.001) | 0.49 (±0.01) | 0.026 (±0.001) | 5.8 (±0.3) |
| B(b)F | 4.0 (±0.1) × 10−4 | 0.11 (±0.01) | 0.007 (±0.001) | 6.9 (±0.2) |
| B(a)P | 5.0 (±0.2) × 10−3 | 0.33 (±0.01) | 0.025 (±0.001) | 8.5 (±0.3) |
The analysis of simultaneous sorption demonstrates that the cumulative removal efficiencies of BTXs and PAHs are, respectively 2.9 and 14.1% by Pec/CS hydrogel; 11 and 28.5% by Pec-β-CD/CS hydrogel; 6.7 and 21.2% by Pec-PVA/CS hydrogel. Thus, we noticed that in the real samples the removal efficiency for BTXs is much lower than the corresponding value for PAHs in all used hydrogels. This low BTXs removal efficiency may have been influenced by the diverse number of monoaromatic compounds present in commercial gasoline.67
As shown, the presence of β-CD and PVA in the hydrogel significantly increased the removal efficiency of the hydrocarbons by the studied materials. This behaviour is in agreement with data showed in the previous sections.
4. Conclusions
The β-CD- and PVA-Pec/CS composite gels show a 2-fold and 4-fold higher swelling degree, respectively, than the unmodified Pec/CS hydrogel. In both cases the grafting of those compounds originates a decrease in the Pec/CS electrostatic interactions, leading to an increase in the plasticity of the polymeric structure and a decrease in the thermal degradation temperature. The hydrogel with intermediate swelling features shows the best removal efficiency for BTXs and PAHs. Whilst PVA has a major role on the plasticizing of polymer structure, the incorporation of β-cyclodextrin shows a higher efficiency for the sorption process. The latter is probably due to the ability of CD to form host-guest supramolecular structures with aromatic moities. The cumulative RE of gels towards polycyclic aromatic compounds are 53 (±4)%, 102 (±10)% and 87 (±10)%, to Pec/CS, Pec-β-CD/CS and Pec-PVA/CS hydrogels, respectively. The RE is not dependent on the initial concentration of adsorbates. The sorption process occurs through a multilayer, non-selective mechanism, in the three different gels. The sorption kinetics follows a 1st order kinetics, suggesting that the formation of the monolayer is faster than the subsequent multilayer. The PAHs are more easily desorbed than the BTXs. This can be justified by an initially sorption of BTXs at the hydrogel interface. The performance of these Pec/CS based gels for the removal of BTXs and PAHs from a real sample of gasoline has been tested. Despite the high complexity of the mixture, the REs of the six different adsorbates show non-negligible values for both composite blends; this provides good clues for the development of biogels to address environmental issues.Conflicts of interest
There are no conflicts to declare.Acknowledgements
Cesar Filho and Alan Matsushita acknowledge financial support from Conselho Nacional de Desenvolvimento Científico e Tecnológico (CNPq- Brazil) – Science without borders Program through the PhD grants (246079/2012-6 and 249241/2013-7, respectively). We are indebted to Professor Sérgio Seixas de Melo for his support for the HPLC measurements. This work was funded by the Coimbra Chemistry Centre, which is supported by the Fundação para a Ciência e a Tecnologia (FCT) through the programmes UID/QUI/UI0313/2013 and COMPETE, and by Portuguese funds through FCT in the framework of the project WaterJPI/0006/2016. Access to TAIL-UC facility funded under QREN-Mais Centro Project ICT/2009/02/012/1890 is gratefully acknowledged. NMR data was collected at the UC-NMR facility which is supported in part by FEDER – European Regional Development Fund through the COMPETE Programme (Operational Programme for Competitiveness) and by National Funds through FCT -Fundação para a Ciência e a Tecnologia and Rede Nacional de Ressonância Magnética Nuclear (RNRMN).References
- T. Garrison, J. C. Hower, A. E. Fryar and E. D'Angelo, Environ. Earth Sci., 2016, 75, 1–13 CrossRef CAS.
- J. S. Stenehjem, K. Kjærheim, M. Bråtveit, S. O. Samuelsen, F. Barone-Adesi, N. Rothman, Q. Lan and T. K. Grimsrud, Br. J. Cancer, 2015, 112, 1603–1612 CrossRef CAS PubMed.
- A. L. Bolden, C. F. Kwiatkowski and T. Colborn, Environ. Sci. Technol., 2015, 49, 5261–5276 CrossRef CAS PubMed.
- D. K. Singh, K. Kawamura, A. Yanase and L. A. Barrie, Environ. Sci. Technol., 2017, 51, 8992–9004 CrossRef CAS PubMed.
- G. A. Płaza, J. Wypych, C. Berry and R. L. Brigmon, World J. Microbiol. Biotechnol., 2007, 23, 533–542 CrossRef.
- D. Pampanin and M. Sydnes, in Hydrocarbon, ed. V. Kutcherov, InTech, 2013 Search PubMed.
- L. Zoccolillo, D. Babi and M. Felli, Chromatographia, 2000, 52, 373–376 CrossRef CAS.
- F. Mateen, I. Javed, U. Rafique, N. Tabassum, M. Sarfraz, S. Z. Safi, I. Yusoff and M. A. Ashraf, Desalin. Water Treat., 2016, 57, 6230–6238 CrossRef CAS.
- H. Gupta and B. Gupta, Desalin. Water Treat., 2015, 1–12 Search PubMed.
- S. Liu, D. Chen, J. Zheng, L. Zeng, J. Jiang, R. Jiang, F. Zhu, Y. Shen, D. Wu and G. Ouyang, Nanoscale, 2015, 7, 16943–16951 RSC.
- F. L. Sousa, A. L. Daniel-da-Silva, N. J. O. Silva and T. Trindade, in Eco-friendly Polymer Nanocomposites SE – 9, ed. V. K. Thakur and M. K. Thakur, Springer India, 2015, vol. 74, pp. 279–310 Search PubMed.
- L. Pang, W. Zhang, W. Zhang, P. Chen, J. Yu, G.-T. Zhu and S. Zhu, RSC Adv., 2017, 7, 53720–53727 RSC.
- M. Arshadi, H. Shakeri and J. W. L. Salvacion, RSC Adv., 2016, 6, 14290–14305 RSC.
- X. Qin, H. Zhang, Z. Wang and Y. Jin, RSC Adv., 2018, 8, 10376–10388 RSC.
- J. Miras, S. Vilchez, C. Solans, T. Tadros and J. Esquena, Soft Matter, 2013, 9, 8678–8686 RSC.
- G. Z. Kyzas and D. N. Bikiaris, Mar. Drugs, 2015, 13, 312 CrossRef PubMed.
- A. F. Martins, P. V. A. Bueno, E. A. M. S. Almeida, F. H. A. Rodrigues, A. F. Rubira and E. C. Muniz, Int. J. Biol. Macromol., 2013, 57, 174–184 CrossRef CAS PubMed.
- M. Mohamed and S. Ouki, Ind. Eng. Chem. Res., 2011, 50, 9557–9563 CrossRef CAS.
- S. Schiewer and S. B. Patil, Bioresour. Technol., 2008, 99, 1896–1903 CrossRef CAS PubMed.
- R. Rakhshaee and M. Panahandeh, J. Hazard. Mater., 2011, 189, 158–166 CrossRef CAS PubMed.
- A. Kozioł, J. Cybulska, P. M. Pieczywek and A. Zdunek, Carbohydr. Polym., 2017, 161, 197–207 CrossRef PubMed.
- A. V Reis, M. R. Guilherme, A. T. Paulino, E. C. Muniz, L. H. C. Mattoso and E. B. Tambourgi, Langmuir, 2009, 25, 2473–2478 CrossRef PubMed.
- A. J. M. Valente and O. Söderman, Adv. Colloid Interface Sci., 2014, 205, 156–176 CrossRef CAS PubMed.
- E. Morillo, M. A. Sánchez-Trujillo, J. R. Moyano, J. Villaverde, M. E. Gómez-Pantoja and J. I. Pérez-Martínez, PLoS One, 2012, 7, e44137 CrossRef CAS PubMed.
- K. Balogh, N. Szaniszló, K. H-Otta and É. Fenyvesi, J. Inclusion Phenom. Macrocyclic Chem., 2007, 57, 457–462 CrossRef CAS.
- S. Patachia, A. J. M. Valente, A. Papancea and V. M. M. Lobo, Poly(vinil alcohol) [PVA]-based polymer membranes, Nova Science Publishers Incorporated, New York, 2009 Search PubMed.
- J. G. C. Baptista, S. P. J. Rodrigues, A. F. Y. Matsushita, C. Vitorino, T. M. R. Maria, H. D. Burrows, A. A. C. C. Pais and A. J. M. Valente, J. Mol. Liq., 2016, 222, 287–294 CrossRef CAS.
- L. P. Ramteke and P. R. Gogate, J. Chem. Technol. Biotechnol., 2016, 91, 456–466 CrossRef CAS.
- I. Ventura and H. Bianco-Peled, Carbohydr. Polym., 2015, 123, 122–129 CrossRef CAS PubMed.
- M. Trotta, F. Debernardi and O. Caputo, Int. J. Pharm., 2003, 257, 153–160 CrossRef CAS PubMed.
- C. M. C. Filho, M. N. L. Neto, R. S. Teixeira, A. A. C. C. Pais and A. J. M. Valente, J. Liq. Chromatogr. Relat. Technol., 2016, 39, 837–846 CrossRef CAS.
- X. Mo, E. Lotero, C. Lu, Y. Liu and J. G. Goodwin, Catal. Letters, 2008, 123, 1–6 CrossRef CAS.
- R. Grande and A. J. F. Carvalho, Biomacromolecules, 2011, 12, 907–914 CrossRef CAS PubMed.
- G. M. Spinks, C. K. Lee, G. G. Wallace, S. I. Kim and S. J. Kim, Langmuir, 2006, 22, 9375–9379 CrossRef PubMed.
- V. M. M. Lobo, A. J. M. Valente, A. Y. Polishchuk and G. Geuskens, J. Mol. Liq., 2001, 94, 179–192 CrossRef CAS.
- M. S. F. Caruso and J. Alaburda, Rev. Inst. Adolfo Lutz, 2008, 67, 1–27 CAS.
- Y. Zhao, H. Su, L. Fang and T. Tan, Polymer, 2005, 46, 5368–5376 CrossRef CAS.
- Q. Yang, J. Wang, W. Zhang, F. Liu, X. Yue, Y. Liu, M. Yang, Z. Li and J. Wang, Chem. Eng. J., 2017, 313, 19–26 CrossRef CAS.
- T. Zhang, Z. Tu, G. Lu, X. Duan, X. Yi, C. Guo and Z. Dang, J. Environ. Manage., 2017, 188, 1–8 CrossRef CAS PubMed.
- Y. He, Z. Xu, F. Wu, Z. Luo and C. Chen, Colloid Polym. Sci., 2014, 292, 1725–1733 CrossRef CAS.
- R. A. Carvalho, H. A. Correia, A. J. M. Valente, O. Söderman and M. Nilsson, J. Colloid Interface Sci., 2011, 354, 725–732 CrossRef CAS PubMed.
- J. Shin, Y. Kim, Y. M. Lim and Y. C. Nho, J. Appl. Polym. Sci., 2008, 107, 3179–3183 CrossRef CAS.
- J. U. Izunobi and C. L. Higginbotham, J. Chem. Educ., 2011, 88, 1098–1104 CrossRef CAS.
- R. M. Silverstein, F. X. Webster, D. J. Kiemle and D. L. Bryce, Spectrometric identification of organic compounds, John Wiley & Sons, 2014 Search PubMed.
- L. Neufeld and H. Bianco-Peled, Int. J. Biol. Macromol., 2017, 101, 852–861 CrossRef CAS PubMed.
- M. Sadeghi, J. Biomater. Nanobiotechnol., 2011, 2, 36–40 CrossRef CAS.
- L. Fan, H. Yang, J. Yang, M. Peng and J. Hu, Carbohydr. Polym., 2016, 146, 427–434 CrossRef CAS PubMed.
- X. Ma, R. Wei, J. Cheng, J. Cai and J. Zhou, Carbohydr. Polym., 2011, 86, 313–319 CrossRef CAS.
- A. Rachini, M. Le Troedec, C. Peyratout and A. Smith, J. Appl. Polym. Sci., 2009, 112, 226–234 CrossRef CAS.
- I. Corazzari, R. Nisticò, F. Turci, M. G. Faga, F. Franzoso, S. Tabasso and G. Magnacca, Polym. Degrad. Stab., 2015, 112, 1–9 CrossRef CAS.
- M. Knaapila, B. Stewart, T. Costa, S. E. Rogers, J. Pragana, S. M. Fonseca, A. J. M. Valente, M. L. Ramos, D. Murtinho, J. C. Pereira, R. Mallavia and H. D. Burrows, Macromolecules, 2016, 49, 9119–9131 CrossRef CAS.
- J. R. Quintana, N. E. Valderruten and I. Katime, Langmuir, 1999, 15, 4728–4730 CrossRef CAS.
- K. Kimura and H. Waki, Optimization Methods and Software, 2018, 33, 633–649 CrossRef.
- Y. S. Ho and G. McKay, Chem. Eng. J., 1998, 70, 115–124 CrossRef CAS.
- Y.-S. Ho, Adsorption, 2004, 10, 151–158 CrossRef CAS.
- N. Singh and C. Balomajumder, Journal of Water Process Engineering, 2016, 9, 233–245 CrossRef.
- K. Y. Foo and B. H. Hameed, Chem. Eng. J., 2010, 156, 2–10 CrossRef CAS.
- M. Belhachemi and F. Addoun, Appl. Water Sci., 2011, 1, 111–117 CrossRef CAS.
- H. M. F. Freundlich, J. Phys. Chem., 1906, 57, 385–471 CAS.
- N. N. Naing, S. F. Y. Li and H. K. Lee, J. Chromatogr. A, 2016, 1448, 42–48 CrossRef CAS PubMed.
- A. J. M. Valente, C. M. C. Filho, A. Rubira, E. C. Muniz and H. D. Burrows, Colloid Polym. Sci., 2014, 292, 1665–1673 CrossRef CAS.
- C. M. C. Filho, T. Matias, L. Durães and A. J. M. Valente, Colloids Surf., A, 2017, 520, 550–560 CrossRef CAS.
- W.-K. Jo and C.-H. Yang, Sep. Purif. Technol., 2009, 66, 438–442 CrossRef CAS.
- B. Bina, M. M. Amin, A. Rashidi and H. Pourzamani, Water Resour., 2014, 41, 719–727 CrossRef CAS.
- Y. Patel and M. Patel, in Micro- and Nanostructured Polymer Systems, Apple Academic Press, 2015, pp. 165–183 Search PubMed.
- Y. Marcus, Chem. Rev., 2009, 109, 1346–1370 CrossRef CAS PubMed.
- K. Potter and T. L. Simmons, TPHCWG Total Petroleum Hydrocarbon Criteria Working Group Series, Composition of petroleum mixtures, Amherst Scientific Publishers, Amherst, MA, 1998, vol. 2 Search PubMed.
Footnote |
| † Electronic supplementary information (ESI) available. See DOI: 10.1039/c8ra02332h |
| This journal is © The Royal Society of Chemistry 2018 |


