 Open Access Article
Creative Commons Attribution 3.0 Unported Licence
Ionic dynamics of the cation in organic–inorganic hybrid compound (CH3NH3)2MCl4 (M = Cu and Zn) by 1H MAS NMR, 13C CP MAS NMR, and 14N NMR
Ae Ran Lim *ab
*ab
aAnalytical Laboratory of Advanced Ferroelectric Crystals, Jeonju University, Jeonju 55069, Korea. E-mail: aeranlim@hanmail.net; arlim@jj.ac.kr; Fax: +82-063-220-2053; Tel: +82-063-220-2514
bDepartment of Science Education, Jeonju University, Jeonju 55069, Korea
First published on 22nd May 2018
Abstract
The ionic dynamics of (CH3NH3)2MCl4 (M = Cu, Zn) by 1H magic-angle spinning (MAS) nuclear magnetic resonance (NMR), 13C cross-polarization (CP) MAS NMR, and 14N NMR are investigated as a function of temperature with a focus on the role of the CH3NH3+ cation. The molecular motions in (CH3NH3)2MCl4 are also discussed based on the 1H spin–lattice relaxation time in the rotating coordinate frame T1ρ. From the 1H T1ρ results, the activation energies for the tumbling motion of 1H for CH3 and NH3 were similar, and the uniaxial rotations occurred within a large temperature range. The molecular motions for 13C and 14N of the main chain in the CH3NH3+ cation were rigid, whereas those for 1H of the side chain in the CH3NH3+ cation were very free at high temperatures. T1ρ provides insight into the changes in the cation reorientation rates induced by heating at high temperatures.
1. Introduction
Hybrid organic–inorganic compounds have been known since 1976 but recently they have been revisited due to their potential use as substitute materials for perovskites.1–6 Metal complexes with the formula (CH3NH3)2MCl4 (M = Mn, Fe, Cu, Zn, Cd) can be classified into two groups from a crystal structure point of view.7–14 One group (CH3NH3)2MCl4 (M = Mn, Fe, Cd) has a perovskite-type layer structure consisting of cationic layers and layers of corner-sharing chlorine octahedra with a divalent metal ion at the center.15–18 These compounds are characterized by a two-dimensional metal–chlorine network widely separated from one another by methyl ammonium groups. The metal ions are surrounded by a slightly distorted chlorine octahedron, Cl6. The other group, to which (CH3NH3)2MCl4 (M = Cu, Zn) belongs, consists of discrete CH3NH3+ and MCl42− ions packed in an arrangement similar to orthorhombic K2SO4-like members.19,20 In these crystals, unassociated Cl4 tetrahedra are presented instead of corner-sharing layers of chlorine octahedra. Hydrogen-bonding takes place between the hydrogens of CH3NH3+ and Cl−, and the several different possible hydrogen-bond configurations can give rise to structural phase transitions.The (CH3NH3)2CuCl4 compound with M = Cu undergoes a structural phase transition at 348 K (= TC), with the respective phases denoted as orthorhombic structure at high temperature and monoclinic structure at room temperature.21 A sharp peak at 230 K from a thermal capacity experiment was also reported by White and Staveley.22 In the case of (CH3NH3)2ZnCl4 with M = Zn, the existence of a phase transition at 483 K (= TC) was reported by calorimetric, dielectric, thermal expansion, and optical measurements.23 However, a transition at 426 K  was reported from Raman and IR spectra but not by differential scanning calorimetry (DSC), differential thermal analysis (DTA), and 1H nuclear magnetic resonance (NMR) measurements. The structure of (CH3NH3)2ZnCl4 is orthorhombic at high temperatures and monoclinic at low temperatures. In addition, it has been reported from low-temperature DSC that a phase transition exists at 265 K during heating.24,25
Following previous NMR investigations, the spin–lattice relaxation time T1 of 1H in the CH3 and NH3 groups of (CH3NH3)2CuCl4 at the Larmor frequencies of 12 and 26 MHz was reported. The spectra of the two groups overlap at high temperatures and separate at low temperatures.25 The T1 at low temperatures exhibits a strong temperature dependence. Moreover, the self-diffusion and reorientation of the methylammonium ions in (CH3NH3)2ZnCl4 was reported by 1H NMR.26 In addition, the spin–spin relaxation time T2 of 63Cu and 35Cl in (CH3NH3)2CuCl4 has been reported at 1.75 K.27,28 In the case of (CH3NH3)2ZnCl4, 1H T1 NMR studies at the Larmor frequency of 20 MHz revealed that the cation in the highest-temperature phase performs isotropic rotation and self-diffusion. The cation in the low-temperature phase undergoes reorientation about its C–N bond axis.29 Although the structural phase transitions in (CH3NH3)2CuCl4 and (CH3NH3)2ZnCl4 have been performed by several research groups, the corresponding molecular motions and structural geometry changes have not been fully studied by NMR in the rotating frame.
In the present study, to clarify the ionic dynamics of CH3NH3+ cations and to also obtain information of the mechanism of the phase transition in (CH3NH3)2MCl4 (M = Cu, Zn), the chemical shifts and spin–lattice relaxation time in the rotating coordinate frame T1ρ were measured as a function of temperature using 1H magic-angle spinning (MAS) NMR and 13C cross-polarization (CP) MAS NMR. In addition, the 14N NMR spectra in (CH3NH3)2ZnCl4 single crystals in the laboratory frame were discussed in order to elucidate the structural geometry. We focus on the structural phase transitions of compounds with the formula (CH3NH3)2MCl4. We use these results to analyze the behavior of CH3 and NH3 near the phase transition temperature from the results of 1H MAS NMR, 13C CP MAS NMR, and 14N NMR. In addition, we compare the structural geometries of (CH3NH3)2MCl4 (M = Cu, Zn) obtained here and (CH3NH3)2MCl4 (M = Mn, Cd) previously reported.
2. Materials and methods
2.1. Crystal structure
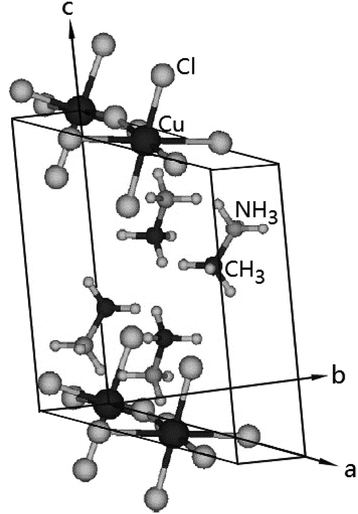
The (CH3NH3)2CuCl4 undergoes a phase transition at 348 K. At temperatures below TC = 348 K, the structure is monoclinic, the space group is P21/c, and the lattice constants are a = 7.155 Å, b = 7.424 Å, c = 9.814 Å, and β = 109.18°.6 The crystal structure at 363 K is orthorhombic, the space group is Ccmb, and the lattice constants are a = 7.34 Å, b = 18.71 Å, and c = 7.33 Å.30,31 The monoclinic structure at room temperature is shown in Fig. 1.3 Here, the methylammonium moieties are located between the layers and are connected by hydrogen bonds to the Cl− ions. Further, (CH3NH3)2ZnCl4 undergoes a phase transition at 483 K. At room temperature, the crystal is monoclinic with the space group P21/c, and the lattice constants are a = 10.873 Å, b = 12.655 Å, c = 7.648 Å, β = 96.71°, and Z = 4.19,23,26,32 Here, the two inequivalent sites, CH3(1) and CH3(2), and NH3(1) and NH3(2), in (CH3NH3)2ZnCl4 were reported by Morosin et al.192.2. Experimental method
Single crystals of (CH3NH3)2MCl4 (M = Cu, Zn) were prepared by the slow evaporation of an aqueous solution of stoichiometric amounts of CH3NH3·HCl and MCl2 (M = Cu, Zn) at room temperature. The color of (CH3NH3)2CuCl4 single crystals is brown with flat parallelepipeds. In addition, (CH3NH3)2ZnCl4 single crystals are colorless and transparent with a square shape. The phase transition temperatures were determined using DSC (Dupont, 2010) measurements at a heating rate of 10 K min−1.1H MAS NMR and 13C CP MAS NMR spectra of (CH3NH3)2MCl4 (M = Cu, Zn) in the rotating coordinate frame were obtained at the Larmor frequencies of ω0/2π = 400.13 and 100.61 MHz, respectively, using a Bruker 400 MHz NMR spectrometer at the Korea Basic Science Institute, Western Seoul Center. Powdered samples were placed in a 4 mm CP MAS probe, and the MAS rate was set to 10 kHz for both 1H MAS and 13C CP MAS measurements to minimize the spinning sideband overlap. The chemical shifts were referred with respect to tetramethylsilane (TMS). The spin–lattice relaxation times for 1H and 13C of (CH3NH3)2MCl4 in the rotating coordinate frame were determined using a π/2 − t sequence by varying the duration of the spin-locking pulses. In the case of (CH3NH3)2CuCl4, the width of the π/2 pulse used for measuring the T1ρ values of 1H and 13C was 3.9 μs, with a spin-locking field of 64.1 kHz. In the case of (CH3NH3)2ZnCl4, the width of the π/2 pulse used for measuring the T1ρ values of 1H and 13C was 4.5 and 5.6 μs, with the spin-locking field of 55.55 kHz and 44.64 kHz, respectively. The power level for 1H and 13C was 4 db and 6.5 db, respectively. The 13C T1ρ values were measured by varying the duration of the 13C spin-locking pulse applied after the CP preparation period.
In addition, the 14N NMR spectra of the (CH3NH3)2ZnCl4 single crystals in the laboratory frame were measured using a Unity INOVA 600 NMR spectrometer at the same facility. The static magnetic field was 14.1 T and the Larmor frequency was set to ω0/2π = 43.342 MHz. The 14N NMR experiments were conducted using a solid-echo pulse sequence.
Temperature-dependent NMR spectra were recorded at 180–430 K as the chemical shift and relaxation time could not be determined outside this temperature range, because of the limitations of the spectrometer used. The sample temperatures were maintained within ±0.5 K by controlling the nitrogen gas flow and heater current.
3. Results and discussion
The DSC analysis in (CH3NH3)2CuCl4 revealed two endothermic peaks at 347 K (= TC) and 517 K (= Tm) related to the phase transition and melting point, respectively, as shown in Fig. 2. The enlarged peak near 347 K in Fig. 2 is very small relative to the other endothermic peak. In the case of (CH3NH3)2ZnCl4, two endothermic peaks are obtained at 475 K (= TC) and 525 K (= Tm), which are due to the phase transition and melting point. In order to understand the additional endothermic peaks at high temperature, we conduct optical polarizing microscopy. The peaks of 517 and 525 K in (CH3NH3)2CuCl4 and (CH3NH3)2ZnCl4, respectively, are not related to physical changes such as structural phase transitions; they are instead related to the melting point. The phase transition temperatures obtained here are consistent with previous results.21,23 This suggests that the differences in the chemical properties of Cu and Zn are responsible for the variations of the phase transition temperatures TC in the two crystals.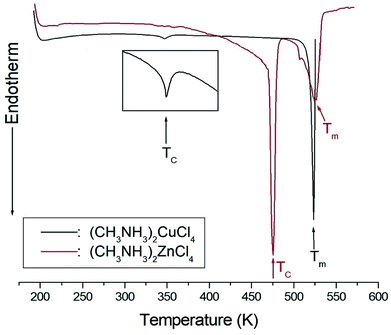 | ||
| Fig. 2 Differential scanning calorimetry thermogram of (CH3NH3)2CuCl4 and (CH3NH3)2ZnCl4 single crystals. | ||
The NMR spectra for 1H in (CH3NH3)2MCl4 (M = Cu, Zn) were recorded by MAS NMR at a frequency of 400.13 MHz. In the case of the two compounds, the spectrum of the two peaks is assigned to the 1H in CH3 and NH3. One of them, the spectrum of the two peaks at chemical shifts of δ = 3.82 and 12.52 in (CH3NH3)2CuCl4 at room temperature, is presented in Fig. 3. Here, the unit of the NMR scale is represented according to the IUPAC convention.33,34 The spinning sidebands for CH3 are marked with open circles and those for NH3 are marked with crosses. The line component of the lower chemical shift is attributed to the 1H in CH3, and that of the higher chemical shift is attributed to the 1H in NH3. The protons of CH3 and NH3 are distinguished from the 1H chemical shifts. In the case of (CH3NH3)2CuCl4 across the phase transition temperature of TC, the chemical shift slowly and monotonously decreases with temperature, indicating that the environments of the surrounding 1H in the CH3 and NH3 groups change continuously (see Fig. 4(a)). However, the proton spectrum of the two peaks in (CH3NH3)2ZnCl4 at room temperature is recorded at chemical shifts of δ = 2.88 and 6.75. The 1H chemical shifts in (CH3NH3)2ZnCl4 are almost constant with temperature, as shown in Fig. 4(b).
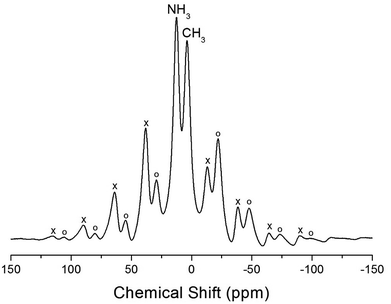 | ||
| Fig. 3 1H MAS NMR spectra of (CH3NH3)2CuCl4 at 300 K (the spinning sidebands are marked with crosses and open circles). | ||
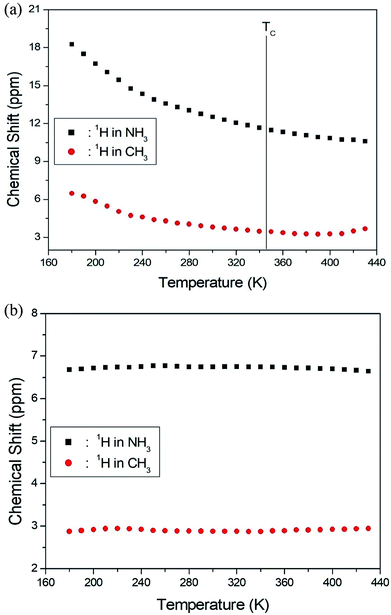 | ||
| Fig. 4 (a) 1H chemical shifts for CH3 and NH3 groups in (CH3NH3)2CuCl4 as a function of temperature. (b) 1H chemical shifts for CH3 and NH3 groups in (CH3NH3)2ZnCl4 as a function of temperature. | ||
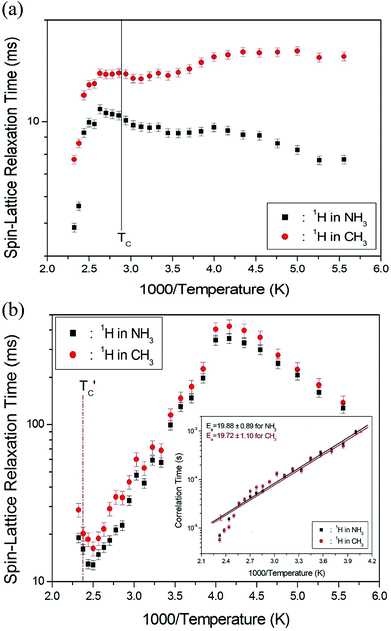
The 1H spin–lattice relaxation times in the rotating coordinate frame of (CH3NH3)2MCl4 (M = Cu, Zn) were obtained for the CH3 and NH3 at several temperatures. The nuclear magnetization decay of 1H follows a single exponential function. Thus, T1ρ can be determined by fitting the traces with the following equation:35
| S(t)/S(∞) = exp(−t/T1ρ), | (1) |
| (nT1ρ−1) = 0.05(μo/4π)2 (γHγCħ/rH–C3)2[4a + b + 3c + 6d + 6e], | (2) |
![[thin space (1/6-em)]](https://www.rsc.org/images/entities/char_2009.gif) exp(−Ea/RT), where τCo is the pre-exponential factor, T is the temperature, R is the gas constant, and Ea is the activation energy. Thus, the slope of the straight-line portion of the semi-log plot can be used to determine Ea. The activation energy for the uniaxial rotation of CH3 and NH3, obtained from the log
exp(−Ea/RT), where τCo is the pre-exponential factor, T is the temperature, R is the gas constant, and Ea is the activation energy. Thus, the slope of the straight-line portion of the semi-log plot can be used to determine Ea. The activation energy for the uniaxial rotation of CH3 and NH3, obtained from the log![[thin space (1/6-em)]](https://www.rsc.org/images/entities/char_2009.gif) τC vs. 1000/T curve shown in the inset of Fig. 5(b), is 19.72 ± 1.10 and 19.88 ± 0.89 kJ mol−1, respectively, and is the same within the error range. In addition, the Ea value for CH3 and NH3 at temperatures below 200 K is 6.59 ± 0.51 and 5.92 ± 0.40 kJ mol−1, respectively.
τC vs. 1000/T curve shown in the inset of Fig. 5(b), is 19.72 ± 1.10 and 19.88 ± 0.89 kJ mol−1, respectively, and is the same within the error range. In addition, the Ea value for CH3 and NH3 at temperatures below 200 K is 6.59 ± 0.51 and 5.92 ± 0.40 kJ mol−1, respectively.
The chemical shifts for 13C in (CH3NH3)2CuCl4 were measured as a function of temperature, as shown in Fig. 6. At room temperature, the 13C CP MAS NMR spectrum shows a signal at a chemical shift of δ = 190.50 with respect to TMS. The 13C chemical shift slowly and monotonously decreases with temperature. In contrast, the chemical shifts for 13C in (CH3NH3)2ZnCl4 were also measured over the temperature range of 180 to 430 K, as shown in the inset of Fig. 6. At room temperature, the 13C CP MAS NMR spectrum possesses two signals at chemical shifts of δ = 27.82 and 29.02. These signals are attributed to the methyl carbons of the two inequivalent sites CH3 (1) and CH3 (2), and these results are consistent with the X-ray result previously reported:18 there exist two kinds of crystallographically inequivalent cations. The 13C chemical shifts near 426 K decrease by only one line; the change near 426 K was measured from the 13C chemical shift but not by the DSC result. Although the anomaly was not found around 426 K in the present DSC experiment, the existence of the 13C chemical shift and 13C T1ρ was obtained. This anomaly near 426 K  is consistent with that obtained from Raman and IR spectra previously reported. There exist two kinds of inequivalent CH3 in (CH3NH3)2ZnCl4, whereas only one kind of equivalent CH3 in (CH3NH3)2CuCl4 exists. On the other hand, the chemical shifts of the CH3 groups in the 13C NMR spectra were very different between the two compounds. Generally, the paramagnetic contribution to the NMR shift is responsible for the NMR spectra.40 Thus, the 13C NMR chemical shift of (CH3NH3)2CuCl4, which contain paramagnetic ions, was significantly different from that of (CH3NH3)2ZnCl4, which does not contain paramagnetic ions. The differences in the 13C NMR chemical shifts could potentially be due to differences in the electron structures of the metal ions, in particular, the structure of the d electrons, which screen the nuclear charge from the motion of the outer electrons. Zn2+ has a filled d shell, whereas Cu2+ has one s electron outside the closed d shell.
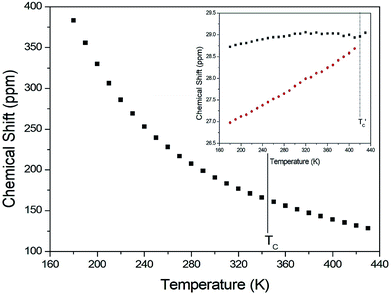 | ||
| Fig. 6 13C chemical shift in CH3 groups in (CH3NH3)2CuCl4 as a function of temperature (inset: that in (CH3NH3)2ZnCl4 as a function of temperature). | ||
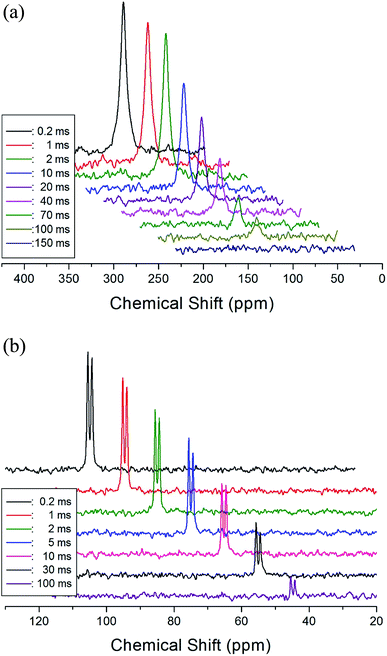
The T1ρ values were obtained for the carbon of (CH3NH3)2MCl4 (M = Cu, Zn) at several temperatures. 13C magnetization was generated by CP after spin-locking the protons. All magnetization traces obtained for the methyl carbon were described by a single exponential function S(t) = S(∞)exp(−t/T1ρ) of eqn (1).35 The recovery curves for various delay times of 13C in (CH3NH3)2CuCl4 and (CH3NH3)2ZnCl4 were measured at several temperatures. The saturation recovery traces for 13C were measured for delay times ranging from 0.2 to 150 ms at room temperature and are presented in Fig. 7(a) and (b). The recovery traces have different slopes at several temperatures. From these results, the T1ρ values were obtained for the carbon in the two compounds as a function of the inverse temperature. The temperature dependence of the 13C T1ρ values in (CH3NH3)2CuCl4 is illustrated in Fig. 8, and these values are almost constant with temperature. The T1ρ values around TC are unchanged, in agreement with the conclusion drawn from the 13C chemical shifts. In the case of (CH3NH3)2ZnCl4, the phase transition occurring at  (= 426 K) reported by Perez-Mato et al.23 is not observed from our DSC results, whereas the changes near
  are observed by the 13C chemical shift and 13C T1ρ results. Thus,
  is denoted by dotted lines in the inset of Fig. 5, 6, and 8. The T1ρ values for the two 13C signals of CH3 (1) and CH3 (2) in (CH3NH3)2ZnCl4 are almost the same within the experimental error range.
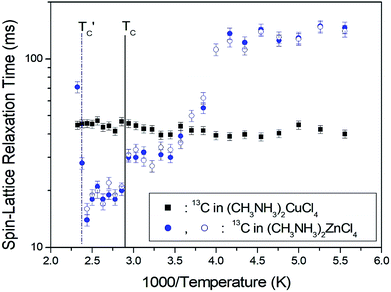 | ||
| Fig. 8 13C spin–lattice relaxation times in the rotating coordinate frame for CH3 groups in (CH3NH3)2CuCl4 and (CH3NH3)2ZnCl4 as a function of temperature. | ||
In order to obtain information concerning the possible distortion surrounding the 14N ion, the NMR spectrum of 14N (I = 1) in the laboratory frame was obtained using static NMR at a Larmor frequency of ω0/2π = 43.342 MHz. Two resonance signals were expected from the quadrupole interactions of the 14N nucleus. A magnetic field was applied along the crystallographic axis. The in situ 14N NMR spectra and resonance frequency in (CH3NH3)2ZnCl4 single crystals are plotted in Fig. 9 as a function of temperature, respectively. The 14N NMR spectra of the two resonance signals for 14N are attributed to the NH3, and this splitting of the 14N resonance signals slightly decreases with temperature. The small change of the resonance frequency near 300 K is not related to the phase transition. Note that temperature-dependent changes in the 14N resonance frequency are generally attributed to changes in the structural geometry, indicating a change in the quadrupole parameter of the 14N nuclei. The electric field gradient tensors at the N sites vary, reflecting the changing atomic configurations around the nitrogen centers.
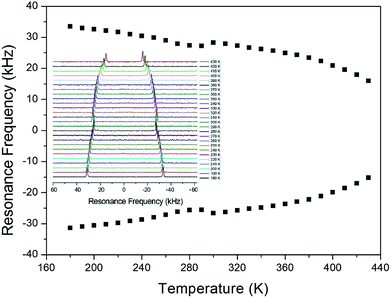 | ||
| Fig. 9 The temperature-dependent resonance frequency of 14N NMR spectra in (CH3NH3)2ZnCl4 single crystal as a function of temperature (inset: 14N NMR spectra as a function of temperature). | ||
4. Conclusions
The ionic dynamics of (CH3NH3)2MCl4 (M = Cu, Zn), focusing on the role of the CH3NH3+ cation, were investigated by 1H MAS NMR, 13C CP MAS NMR, and 14N NMR as a function of temperature. We studied the molecular motions for 1H and 13C in (CH3NH3)2MCl4 (M = Cu, Zn) based on the spin–lattice relaxation time in the rotating coordinate frame. From the 1H T1ρ results, we found that the molecular motions for 1H in (CH3NH3)2CuCl4 are very active at high temperatures. In addition, the activation energies for the uniaxial rotation of 1H for the CH3 and NH3 ions in (CH3NH3)2ZnCl4 have very similar values, and the uniaxial rotation occurs within the high-temperature range. The T1ρ results reveal that the CH3 and NH3 cations exhibit high mobility at high temperatures. The T1ρ provides insight into the changes in the cation reorientation rates induced by heating at high temperatures. On the other hand, the minima for (CH3NH3)2ZnCl4 are attributed to the uniaxial rotation of the CH3NH3 cations. However, minima such as T1ρ for (CH3NH3)2CuCl4 were not reached for that compound. The lack of a minimum T1ρ indicates that this motion is so slow that there was no detectable T1ρ temperature dependence and also that the uniaxial rotation in (CH3NH3)2CuCl4 was slower than that in (CH3NH3)2ZnCl4. The motion of the CH3NH3 cations is slower than the C3 internal rotation of CH3 and NH3; therefore, it reveals T1ρ minima in the high temperature regime above liquid nitrogen temperature. The minima related to the C3 rotation will appear in the low temperature regime.A comparison with other compounds of the (CH3NH3)2MCl4 (M = Cu, Zn) indicates a different phase sequence for (CH3NH3)2MCl4 (M = Cd, Mn). For M = Cd, Mn, these systems at room temperature reveal orthorhombic symmetry followed by a tetragonal phase below room temperature. A phase with monoclinic symmetry is also reported at low temperatures. It is interesting to compare the results for (CH3NH3)2MCl4 with those for the analogous compounds containing other metals. In the case of (CH3NH3)2MnCl4 and (CH3NH3)2CdCl4, there is an intermediate tetragonal phase between the monoclinic and orthorhombic phases.16,31 In contrast, the phase transition sequence for (CH3NH3)2CuCl4 and (CH3NH3)2ZnCl4 changes to an orthorhombic to monoclinic structure with decreasing temperature.22,31
The created magnetization decay for each proton in (CH3NH3)2MCl4 (M = Cu, Zn) was analyzed by a single exponential function S(t)/S(∞) = A![[thin space (1/6-em)]](https://www.rsc.org/images/entities/char_2009.gif) exp(−t/T1ρ), whereas that for each proton in (CH3NH3)2MCl4 (M = Mn, Cd) was analyzed by a double-exponential function S(t)/S(∞) = A
exp(−t/T1ρ), whereas that for each proton in (CH3NH3)2MCl4 (M = Mn, Cd) was analyzed by a double-exponential function S(t)/S(∞) = A![[thin space (1/6-em)]](https://www.rsc.org/images/entities/char_2009.gif) exp(−t/T1ρ(s)) + B
exp(−t/T1ρ(s)) + B![[thin space (1/6-em)]](https://www.rsc.org/images/entities/char_2009.gif) exp(−t/T1ρ(L)). These results are consistent with the interactions between the CH3NH3 cations and its surrounding MCl42− anions. This difference of T1ρ is possibly due to the difference between the electron structures of metal ions. Cu2+ and Zn2+ have one and two s electrons, respectively, outside the closed d shell; Mn2+ has two s electrons in the unfilled 3d orbital; Cd2+ has two electrons outside the closed d shell.
exp(−t/T1ρ(L)). These results are consistent with the interactions between the CH3NH3 cations and its surrounding MCl42− anions. This difference of T1ρ is possibly due to the difference between the electron structures of metal ions. Cu2+ and Zn2+ have one and two s electrons, respectively, outside the closed d shell; Mn2+ has two s electrons in the unfilled 3d orbital; Cd2+ has two electrons outside the closed d shell.
The T1ρ values for 1H of CH3 and NH3 indicate that the protons in the CH3NH3 cations that are involved in the hydrogen bonding exhibit large and small T1ρ values corresponding to the long C–H and short N–H bonds, respectively. The molecular motion of the cation is induced by heating at high temperatures. The cation dynamics and interionic interactions through hydrogen bonds are expected to be closely related with the physical properties due to the potential applications. We will be examined the effect for lengths of alkyl chains as further study.
Conflicts of interest
There are no conflicts to declare.Acknowledgements
This research was supported by the Basic Science Research program through the National Research Foundation of Korea (NRF), funded by the Ministry of Education, Science, and Technology (2016R1A6A1A03012069 and 2015R1A1A3A04001077).References
- C. N. R. Rao, A. K. Cheetham and A. Thirumurugan, J. Phys.: Condens. Matter, 2008, 20, 83202 CrossRef.
- A. H. Arkenbout, T. Uemura, J. Takeya and T. T. M. Palstra, Appl. Phys. Lett., 2009, 95, 173104 CrossRef.
- P. Zolfaghari, G. A. de Wijs and R. A. de Groot, J. Phys.: Condens. Matter, 2013, 25, 295502 CrossRef PubMed.
- R. Yadav, D. Swain, P. P. Kundu, H. S. Nair, C. Narayana and S. Elizabeth, Phys. Chem. Chem. Phys., 2015, 17, 12207 RSC.
- A. M. Elseman, A. E. Shalan, S. Sajid, M. M. Rashad, A. M. Hassan and M. Li, ACS Appl. Mater. Interfaces, 2018, 10, 11699 Search PubMed.
- J. A. Aramburu, P. Garcia-Fernandez, N. R. Mathiesen, J. M. Garcia-Lastra and M. Moreno, J. Phys. Chem. C, 2018, 122, 5071 Search PubMed.
- R. Kind, Ferroelectrics, 1980, 24, 81 CrossRef.
- A. Rahman, P. R. Clayton and L. A. K. Staveley, J. Chem. Thermodyn., 1981, 13, 735 CrossRef.
- A. Levstik, C. Filipic, R. Blinc, H. Arend and R. Kind, Solid State Commun., 1976, 20, 127 CrossRef.
- T. Yoshinari, T. Matsuyama, H. Yamaoka and K. Aoyagi, J. Phys. Soc. Jpn., 1989, 58, 4222 CrossRef.
- I. R. Jahn, K. Knorr and J. Ihringer, J. Phys.: Condens. Matter, 1989, 1, 6005 CrossRef.
- H. Manaka, I. Yamada, M. Nishi and T. Goto, J. Phys. Soc. Jpn., 2001, 70, 1390 CrossRef.
- A. R. Lim, S. W. Kim and Y. L. Joo, J. Appl. Phys., 2017, 121, 215501 CrossRef.
- A. R. Lim, Solid State Commun., 2017, 267, 18 CrossRef.
- G. Chapuis, R. Kind and H. Arend, Phys. Status Solidi A, 1976, 36, 285 CrossRef.
- G. Heger, D. Mullen and K. Knorr, Phys. Status Solidi A, 1975, 31, 455 CrossRef.
- P. S. R. Prasad, Phys. Status Solidi A, 1995, 149, k13 CrossRef.
- J. J. M. Steijger, E. Frikkee, L. J. de Jongh and W. J. Huiskamp, Physica. B, 1984, 123, 284 CrossRef.
- B. Morosin and K. Emerson, Acta Crystallogr., Sect. B: Struct. Crystallogr. Cryst. Chem., 1976, 32, 294 CrossRef.
- A. Ben Salah, J. W. Bats, R. Kalus, H. Fuess and A. Daoud, Z. Anorg. Allg. Chem., 1982, 493, 178 CrossRef.
- G. Heygster and W. Kleemann, Physica. B, 1977, 89, 165 CrossRef.
- M. A. White and L. A. K. Staveley, J. Phys. Chem. Solids, 1982, 43, 1019 CrossRef.
- J. M. Perez-Mato, J. L. Manes, J. Fernandez, J. Zuniga, M. J. Tello, C. Socias and M. A. Arriandiaga, Phys. Status Solidi A, 1981, 68, 29 CrossRef.
- G. Amirthaganesan, U. Binesh, M. A. Kandhaswamy, M. Dhandapani and V. Srinivasan, Cryst. Res. Technol., 2006, 41, 708 CrossRef.
- H. Nishihara, T. Goto, Y. Kimishima and H. Kubo, J. Phys. Soc. Jpn., 1982, 51, 407 CrossRef.
- H. Ishida, T. Iwachido, N. Hayama, R. Ikeda, M. Terashima and D. Nakamura, Zeitschrift für Naturforschung A, 1989, 44, 741 Search PubMed.
- H. Kubo, Y. Machida and N. Uryu, J. Phys. Soc. Jpn., 1976, 41, 1071 CrossRef.
- H. Kubo, Y. Machida and N. Uryu, J. Phys. Soc. Jpn., 1977, 43, 459 CrossRef.
- H. Ishida, Zeitschrift für Naturforschung A, 2000, 55, 412 Search PubMed.
- I. Pabst, J. Karolyi, H. Fuess and M. Couzi, Phys. Stat. Sol., 1996, 155, 341 CrossRef.
- I. Pabst, H. Fuess and J. W. Bats, Acta Crystallogr., Sect. C: Cryst. Struct. Commun., 1987, 43, 413 CrossRef.
- A. Daoud, J. Appl. Crystallogr., 1977, 10, 133 CrossRef.
- R. K. Harris, J. Kowalewski and S. C. de Menezes, Magn. Reson. Chem., 1998, 36, 145 CrossRef.
- R. K. Harris, E. D. Becker, S. M. C. de Menezes, R. Goodfellow and P. Granger, Magn. Reson. Chem., 2002, 40, 489 CrossRef.
- A. Abragam, The Principles of Nuclear Magnetism, Oxford University press, 1961 Search PubMed.
- N. Bloembergen, E. M. Purcell and R. V. Pound, Phys. Rev., 1948, 73, 679 CrossRef.
- R. K. Harris, Nuclear Magnetic Resonance Spectroscopy, Pitman Pub., UK, 1983 Search PubMed.
- J. L. Koenig, Spectroscopy of Polymers, Elsevier, New York, 1999 Search PubMed.
- A. R. Lim, RSC Adv., 2017, 7, 55276 RSC.
- J. Novotny, M. Sojka, S. Komorovsky, M. Necas and R. Marek, J. Am. Chem. Soc., 2016, 138, 8432 CrossRef PubMed.
| This journal is © The Royal Society of Chemistry 2018 |

