 Open Access Article
Label-free impedimetric sensing platform for microRNA-21 based on ZrO2-reduced graphene oxide nanohybrids coupled with catalytic hairpin assembly amplification†
Keying Zhang *,
Na Zhang,
Li Zhang,
Hongyan Wang,
Hongwei Shi and
Qiao Liu
Anhui Key Laboratory of Spin Electron and Nanomaterials, School of Chemistry and Chemical-Engineering, Suzhou University, Suzhou, Anhui 234000, People's Republic of China. E-mail: zhangky1983@163.com
First published on 30th April 2018
Abstract
Herein, a sensitive electrochemical impedance sensor was constructed based on ZrO2-reduced graphene oxide (RGO)-modified electrode coupled with the catalytic hairpin assembly signal amplification strategy. Electrochemical impedance spectroscopy (EIS) was used to detect microRNA (miRNA) using the change in electron transfer resistance (ΔRet) originated from nucleic acid hybridization on the electrode surface. MiRNA-21 was used as a model to verify this strategy. The results indicated that ΔRet exhibited a good linear relationship with the concentration of miRNA-21 in the range from 1.0 × 10⁻¹⁴ mol L−1 to 1.0 × 10⁻¹⁰ mol L−1 with a detection limit of 4.3 × 10⁻¹⁵ mol L−1 (S/N = 3). Additionally, this sensor exhibited good selectivity, and it could be applied to detect miRNA-21 in human serum samples and measure the expression levels of miRNA-21 in human breast cancer cell lines (MCF-7); thus, this sensor has great potential in cancer diagnosis.
1 Introduction
The abnormal expression of microRNAs, which are used as tumour biomarkers, is related to various diseases such as cancers. Therefore, the development of reliable methods for detecting miRNA has been paid great attention to, and various methods have been developed such as fluorescence,1,2 radio-chemistry,3 surface plasmon resonance spectroscopy,4 and electrochemistry.5–9 Among these methods, electrochemical sensors have been widely paid attention to due to their merits including quick response, high sensitivity and selectivity, low cost, and easy microminiaturization.10–12 However, a few challenges still exist; for example, probes need be labelled in the preparation of some sensors, which is very time-consuming and expensive. Thus, label-free electrochemical nucleic acid sensors are extremely desirable.The construction of electrochemical impedance biosensor is a convenient technique for label-free nucleic acid detection. Several groups have successfully constructed label-free electrochemical impedance nucleic acid sensors. For example, Jiao et al. reported a poly(xanthurenic acid)-RGO nanocomposite for highly sensitive impedimetric detection of DNA.13 Li et al. constructed a label-free DNA biosensor based on enhanced charge transfer by gold nanoparticles.14
Nanomaterials having excellent biocompatibility have been considered as attractive materials to construct modified electrodes due to their unique structural, electronic, magnetic, optical and catalytic properties.15–17 ZrO2, a thermally stable inorganic oxide, shows lack of toxicity and affinity for the groups containing oxygen;18,19 thus, it is an ideal material for biomolecules with oxygen group immobilization. Recently, many ZrO2-based electrochemical DNA sensors have been reported. Liu et al.20 described a method of immobilizing DNA based on the sol–gel technique. Jiao et al. reported a synergistic membrane of ZrO2/self-doped polyaniline nanofibres for DNA hybridization detection.21 Fang et al. reported a ZrO2 thin film-modified electrode for DNA hybridization detection.22 Wang et al. reported a sphere-like CeO2–ZrO2 and chitosan nanocomposite-modified electrode for DNA detection.23 Despite the fact that the ZrO2 film can provide an ideal interface for the immobilization of the DNA probe, which improves the detection sensitivity, the sensitivity of the nucleic acid sensor still needs be improved to meet the need of the low-abundance miRNA detection.
Recently, benefiting from molecular programming, enzyme-free DNA circuits for amplifying signals by governing the simple rules of DNA hybridization have been developed in miRNA detection such as hybridization chain reaction (HCR),24,25 catalyzed hairpin assembly (CHA),26,27 and entropy-driven catalysis.28,29 CHA shows great potential in signal amplification, and a cascade of hybridization reactions can be triggered to release the target miRNA, resulting in high sensitivity for the detection of target molecules. Thus, a combination of the electrochemical impedance technique and sensitivity of the CHA amplification strategy is ideal for highly sensitive miRNA detection.
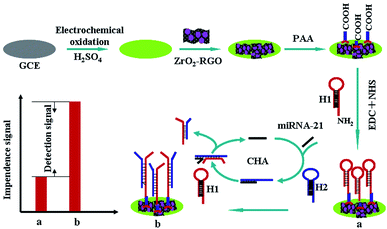
Herein, we presented a highly sensitive electrochemical impendence sensor based on ZrO2-RGO-modified electrode coupled with the CHA signal amplification strategy (Scheme 1). The change in electron transfer resistance (ΔRet = ΔRet (b) − ΔRet (a)) originating from nucleic acid hybridization on the electrode surface was used as a signal to measure target miRNA. The CHA strategy consists of two hairpin DNA molecules (H1 and H2) (in this study, all the nucleic acid sequences are listed in Table S1†). Prior to ZrO2-RGO modification, the glassy carbon electrode (GCE) with the oxygen functional group was obtained by an electro-oxidation process according to the previously reported process,30 and this provided a suitable interface for ZrO2-RGO modification through the reaction between the oxygen functional group and ZrO2.22 H1 modified with an amino-group was covalently bonded onto the ZrO2-RGO-modified GCE surface via poly(acrylic acid) (PAA, MW, 2000) with the aid of N-(3-(dimethylamino) propyl)-N-ethyl-carbodiimide hydrochloride (EDC) and N-hydroxysuccinimide (NHS). In the absence of miRNA, H1 and H2 could not react with each other and thus, ΔRet exhibited no obvious change. When a copy of target miRNA is present, hairpin of H2 is opened by hybridizing to the target miRNA; H1 then hybridizes with the unfolded H2, and the target miRNA is released based on the DNA strand displacement reaction. Finally, H2 was immobilized onto the electrode surface. After that, the released target miRNA initiated the next cycles, as a result of which numerous H2 molecules were immobilized onto the electrode surface, which amplified the detection signal. Thus, target miRNA could be detected with high sensitivity. To verify this strategy, miRNA-21 was used as a model, and the results indicated that this method had good selectivity and could detect miRNA-21 in human serum samples. Importantly, this method was employed to successfully measure the expression levels of miRNA-21 in MCF-7 cells and thus, it has great potential in cancer diagnosis.
2 Experimental
2.1 Reagents and apparatus
ZrOCl2·8H2O, N-(3-(dimethylamino) propyl)-N-ethyl-carbodiimide hydrochloride (EDC), N-hydroxysuccinimide (NHS), and poly(acrylic acid) (MW, 2000) were purchased from Alfa Aesar (Tianjing, China). RGO was purchased from Chengdu Institute of Organic Chemistry, Chinese Academy of Sciences and used without further purification. All chemicals were of analytical grade and used without further purification. All solutions were prepared with doubly distilled water. All the nucleic acid sequences were purchased from Shanghai Sangon Bioengineering (Shanghai, China). Stock solutions of nucleic acid were prepared with Tris–HCl (20 mM, pH 7.4, 5 mM MgCl2, 50 mM NaCl), and they were stored in a freezer.Electrochemical impedance tests were carried out on the CHI660d electrochemical workstation (Shanghai Chenhua Instruments, China). The three-electrode system was used in the experiment with bare GCE or modified electrode as the working electrode, a saturated calomel electrode (SCE) as the reference electrode, and a platinum wire as the counter electrode. Electrochemical impedance spectroscopy (EIS) was performed in 0.1 M PBS (pH 7.4, 0.1 M NaCl) in the presence of 5 mM [Fe(CN)6]3−/4− as a redox probe in the frequency range between 0.01 and 105 Hz at the formal potential of 0.2 V. The AC voltage amplitude was 5 mV. All electrochemical measurements were carried out in a 10 mL electrochemical cell, from which oxygen was removed using high-purity nitrogen for 15 min, and a blanket of nitrogen was maintained over the solutions during the measurements.
Polyacrylamide gel electrophoresis (PAGE) analysis was carried out using a Bio-Rad electrophoresis analyzer (USA) and images were obtained on Bio-Rad ChemDoc; a Hitachi S-3000 N scanning electron microscope (SEM, Japan) was also utilized. XRD measurements were performed on a Japan Shimadzu XRD-6000 diffractometer with Cu-Kα radiation (λ = 0.15418 nm) and a scanning rate of 0.05 deg s−1 TEM measurements were carried out on a JEOL-2100 instrument with an acceleration voltage of 200 kV. In this study, informed consents were obtained from human participants.
2.2 Fabrication of H1/PAA/ZrO2-RGO/GCE
Bare GCE was polished to obtain a mirror-like surface with 1.0, 0.3, and 0.05 μm alumina slurries; it was thoroughly rinsed with water and sonicated in nitric acid (1![[thin space (1/6-em)]](https://www.rsc.org/images/entities/char_2009.gif) :
:![[thin space (1/6-em)]](https://www.rsc.org/images/entities/char_2009.gif) 1), acetone and doubly distilled water (each for 1 min). The electrode was then oxidized by performing 10 cycles in 0.1 mol L−1 H2SO4 between 0 and +2.0 V at the scan rate of 0.1 V s−1.30 ZrO2-RGO nanohybrids were prepared according to our previously reported method.31 ZrO2-RGO (1.0 mg) was dispersed in 10 mL DMF by ultrasonic agitation for about 40 min to get a 0.1 mg mL−1 suspension. ZrO2-RGO suspension (10 μL) was dropped onto the fresh GCE surface and dried naturally at room temperature; it was then immersed into doubly distilled water for 5 min and washed with doubly distilled water three times to remove loosely adsorbed ZrO2-RGO. ZrO2-RGO/GCE was then put into 0.1 mol L−1 PAA solution for 12 h. After washing, PAA/ZrO2-RGO/GCE was immersed into PBS containing 20.0 mg mL−1 EDC, 10.0 mg mL−1 NHS, and 1.0 μM H1 at the room temperature for 4 h, which was followed by rinsing with Tris–HCl; H1/PAA/ZrO2-RGO/GCE was thus fabricated.
1), acetone and doubly distilled water (each for 1 min). The electrode was then oxidized by performing 10 cycles in 0.1 mol L−1 H2SO4 between 0 and +2.0 V at the scan rate of 0.1 V s−1.30 ZrO2-RGO nanohybrids were prepared according to our previously reported method.31 ZrO2-RGO (1.0 mg) was dispersed in 10 mL DMF by ultrasonic agitation for about 40 min to get a 0.1 mg mL−1 suspension. ZrO2-RGO suspension (10 μL) was dropped onto the fresh GCE surface and dried naturally at room temperature; it was then immersed into doubly distilled water for 5 min and washed with doubly distilled water three times to remove loosely adsorbed ZrO2-RGO. ZrO2-RGO/GCE was then put into 0.1 mol L−1 PAA solution for 12 h. After washing, PAA/ZrO2-RGO/GCE was immersed into PBS containing 20.0 mg mL−1 EDC, 10.0 mg mL−1 NHS, and 1.0 μM H1 at the room temperature for 4 h, which was followed by rinsing with Tris–HCl; H1/PAA/ZrO2-RGO/GCE was thus fabricated.
2.3 Electrochemical detection of DNA hybridization
Hybridization was carried out by immersing H1/PAA/ZrO2-RGO/GCE into Tris–HCl solution containing target miRNA and 0.1 μM H2 for 50 min at 37 °C; the electrode was then rinsed with Tris–HCl, and the electrochemical impedance tests were performed.3 Results and discussion
3.1 The characterization of ZrO2-RGO
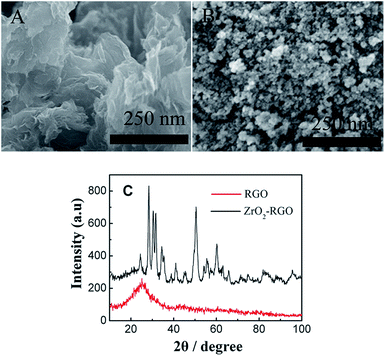
Scanning electron microscopy (SEM) was used to characterize ZrO2-RGO. SEM images of RGO (A) and ZrO2-RGO (B) are shown in Fig. 1. A clear change was observed between the morphologies of RGO and ZrO2-RGO. Compared with the observations for RGO, many nanoparticles were modified onto the ZrO2-RGO surface, indicating the formation of ZrO2-RGO nanohybrids. X-ray powder diffraction (XRD) was used to confirm the above-mentioned result. As shown in Fig. 1C, the typical peaks of 24.2° were indexed as RGO;32 the other typical peaks were indexed as the monoclinic and tetragonal ZrO2. These peaks matched the standard JCPDS data no. 00-037-1484 and 01-079-1769, indicating that the prepared ZrO2 comprised monoclinic and tetragonal ZrO2. Energy dispersive X-ray spectroscopy (EDX) and transmission electron microscopy (TEM) were used to further confirm the formation of ZrO2-RGO nanohybrids (Fig. S1†). The above-mentioned results agreed well with those of the previous report,33 indicating that ZrO2-RGO nanocomposites were successfully synthesized.3.2 The feasibility of this design
The PAGE (12%) experiment was used to investigate the feasibility of this design. As shown in Fig. 2, a band was observed at different positions with just H2 or H1 in the solution (lane c and d, respectively). Two bands were observed in the mixture of H2 and H1 (lane e); they were the same as those for H2 or H1, indicating that H1 and H2 cannot react with each other. When miRNA-21 was added into the H2 solution, a new band appeared, and the band of miRNA-21 disappeared (lane g). After H1 was added into the mixture of miRNA-21 and H2, the band of H2 disappeared, and a new band and a miRNA-21 band appeared (lane f). In addition, miRNA-21 and H1 could not react with each other (lane h). These above-mentioned results illustrated that target miRNA-21 can serve as a catalyst to activate the hairpin assembly reaction and to amplify the signal.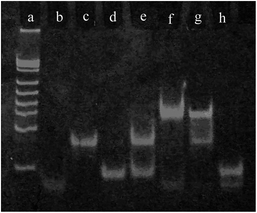 | ||
| Fig. 2 The PAGE analysis: reference ladder (a), miRNA-21 (b), H2 (c), H1 (d), H2 + H1 (e), H2 + miRNA-21 + H1 (f), H2 + miRNA-21 (g), and miRNA-21 + H1 (h). Voltage: 100 V; time: 1 h. | ||
3.3 Immobilization of the sensor
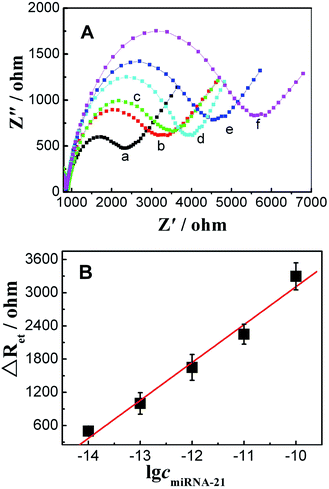
Fig. 3 shows EIS of different electrodes. In EIS, the semicircle diameter corresponds to the electron transfer resistance (Ret). A small Ret was observed at bare GCE. After ZrO2-RGO was modified onto the electrode surface, Ret increased. Upon comparison of the spectra of different electrodes, it was observed that Ret increased after H1 was immobilized, which was ascribed to the negatively charged phosphate backbone of H1 on the electrode surface repelling [Fe(CN)6]3−/4− anions; this indicated that H1 was successfully modified onto the electrode surface. In the presence of 0.1 nM miRNA-21, Ret further increased, because the negative charge increased on the electrode surface due to the formation of H2/H1. These above-mentioned results indicated that the proposed sensor can be successfully prepared, and it exhibits response to miRNA-21.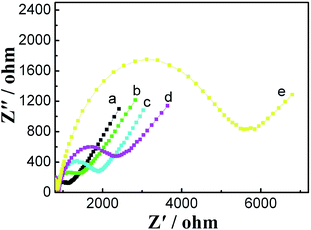 | ||
| Fig. 3 Impedance spectra of bare GCE (a), ZrO2-RGO/GCE(b), PAA/ZrO2-RGO/GCE(c), H1/PAA/ZrO2-RGO/GCE (d), and H2/H1/PAA/ZrO2-RGO/GCE (e). | ||
3.4 The sensitivity and selectivity
The optimum hybridization time was investigated. The results showed that 50 min was the optimal time (Fig. S2†). Under optimum experimental conditions, the sensitivity and selectivity of the sensor were studied. Fig. 4 shows that ΔRet increased with an increase in the concentration of miRNA-21. ΔRet was linear with the logarithm of the concentration of miRNA-21 in the range from 1.0 × 10⁻¹⁴ mol L−1 to 1.0 × 10⁻¹⁰ mol L−1. The regression equation was ΔRet = 9949.6 + 684.2![[thin space (1/6-em)]](https://www.rsc.org/images/entities/char_2009.gif) log
log![[thin space (1/6-em)]](https://www.rsc.org/images/entities/char_2009.gif) cmiRNA-21 (R = 0.9902), and the detection limit was 4.3 × 10⁻¹⁵ mol L−1 (S/N = 3). The performances of this sensor were compared with those of some previously reported sensors (Table S2†), indicating that this sensor shows excellent performance.
cmiRNA-21 (R = 0.9902), and the detection limit was 4.3 × 10⁻¹⁵ mol L−1 (S/N = 3). The performances of this sensor were compared with those of some previously reported sensors (Table S2†), indicating that this sensor shows excellent performance.
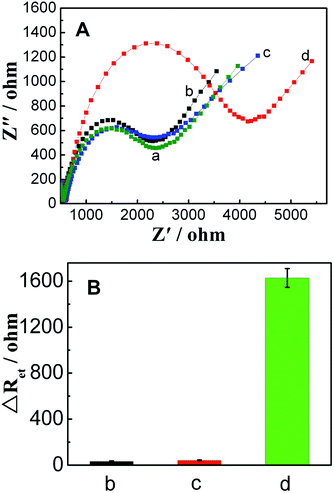
The selectivity of the sensor was investigated by measuring ΔRet obtained for hybridizing with various kinds of miRNA (Fig. 5). No significant changes in ΔRet were observed between the blank solution and the solutions containing miRNA-141 and three-base mismatched miRNA-21 (t-miRNA-21). However, an increase in ΔRet was observed after miRNA-21 was added, indicating that the sensor had good selectivity for distinguishing different sequences of target miRNA.
3.5 Reproducibility and stability
The reproducibility of the sensor was researched by fabricating six sensors separately to detect 1.0 pM miRNA-21. The results showed that ΔRet had a relative standard deviation of 4.2%, indicating that this sensor had good reproducibility. Additionally, this sensor was stored in Tris–HCl at 4 °C, and measurements were conducted once every day. After five days, we observed that the sensor could maintain about 98.9%, 97.5%, 96.8%, 92.6%, and 87.3% of its original response, which indicated that this sensor has sufficient stability for miRNA analysis.3.6 Performance evaluation of miRNA detection
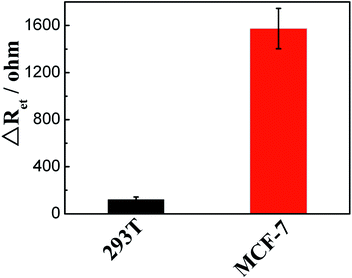
To evaluate the applicability and reliability of the sensor, different concentrations of miRNA-21 were spiked into 5% human serum samples obtained from a healthy individual. The recovery experiments were carried out, and acceptable recoveries of 96.0% and 97.0% were obtained (Table S3†).Finally, this proposed sensor was applied to measure the expression levels of miRNA-21 in different cell lines using MCF-7 cells and human embryonic kidney cells (293T) as models. As shown in Fig. 6, ΔRet obtained for incubation with the lysate from MCF-7 cells (104 cells) was much larger than that from 293T cells (104 cells), indicating that miRNA-21 was overexpressed in MCF-7 cells, which was in good agreement with the results of previous reports.34,35
4 Conclusions
In this study, an electrochemical impendence miRNA sensor based on ZrO2-RGO/GCE is constructed. The catalytic hairpin assembly signal amplification strategy is used to improve the sensitivity of the sensor. The experiment results indicate that the sensor has effective selectivity to distinguish various target miRNAs. In addition, it displays good feasibility for detecting miRNA in human serum samples, and it can measure miRNA in real samples. This sensor provides a new method for detecting miRNA and has great potential in cancer diagnosis.Conflicts of interest
There are no conflicts of interest to declare.Acknowledgements
This project was supported by the Natural Science Research Key Project of Education Department of Anhui Province (KJ2017A434, KJ2016A888), the Opening Project of Anhui Key Laboratory of Spin Electron and Nanomaterials (2015YKF16), the Funded Project of Suzhou University Cultivate Outstanding Talent (SZXYQNL2017001) and Research Team of Anhui Provincial Education Department (2016SCXPTTD). Key Discipline of Material Science and Engineering of Suzhou University (2017XJZDXK3).Notes and references
- V. Benoit, A. Steel, M. Torres, Y. Y. Yu, H. J. Yang and J. Cooper, Anal. Chem., 2001, 73, 2412–2420 CrossRef PubMed.
- S. Su, J. W. Fan, B. Xue, L. H. Yuwen, X. F. Liu, D. Pan, C. H. Fan and L. H. Wang, ACS Appl. Mater. Interfaces, 2014, 6, 1152–1157 Search PubMed.
- A. R. Jilbert, Meth. Mol. Biol., 2000, 123, 177 Search PubMed.
- X. H. Yang, Q. Wang, K. M. Wang, W. H. Tan and H. M. Li, Biosens. Bioelectron., 2007, 22, 1106–1110 CrossRef PubMed.
- T. Yang, M. J. Chen, Q. Q. Kong, X. L. Luo and K. Jiao, Biosens. Bioelectron., 2017, 89, 538–543 CrossRef PubMed.
- H. Teymourian, A. Salimi and S. Khezrian, Electroanalysis, 2017, 29, 409–414 CrossRef.
- M. Chen, C. J. Hou, D. Q. Huo, H. B. Fa, Y. N. Zhao and C. H. Shen, Sens. Actuators, B, 2017, 239, 421–429 CrossRef.
- W. Wang, T. Bao, X. Zeng, H. Y. Xiong, W. Wen, X. H. Zhang and S. F. Wang, Biosens. Bioelectron., 2017, 91, 183–189 CrossRef PubMed.
- S. Su, H. F. Sun, W. F. Cao, J. Chao, H. Z. Peng, X. L. Zuo, L. H. Yuwen, C. H. Fan and L. H. Wang, ACS Appl. Mater. Interfaces, 2016, 8, 6826–6833 Search PubMed.
- J. Shu, Z. L. Qiu, S. Z. Lv, K. Y. Zhang and D. P. Tang, Anal. Chem., 2018, 90, 2425–2429 CrossRef PubMed.
- Z. L. Qiu, J. Shu and D. P. Tang, Anal. Chem., 2018, 90, 1021–1028 CrossRef PubMed.
- Z. L. Qiu, J. Shu and D. P. Tang, Anal. Chem., 2017, 89, 5152–5160 CrossRef PubMed.
- T. Yang, Q. H. Li, L. Meng, X. H. Wang, W. W. Chen and K. Jiao, ACS Appl. Mater. Interfaces, 2013, 5, 3495–3499 Search PubMed.
- Y. C. Yang, C. Li, L. Yin, M. Y. Liu, Z. X. Wang, Y. Q. Shu and G. X. Li, ACS Appl. Mater. Interfaces, 2014, 6, 7579–7584 Search PubMed.
- K. Y. Zhang, S. Z. Lv, Z. Z. Lin, M. J. Li and D. P. Tang, Biosens. Bioelectron., 2018, 101, 159–166 CrossRef PubMed.
- Q. Zhou, Y. X. Lin, K. Y. Zhang, M. J. Li and D. P. Tang, Biosens. Bioelectron., 2018, 101, 146–152 CrossRef PubMed.
- J. Shu and D. P. Tang, Chem.–Asian J., 2017, 12, 2780–2789 CrossRef PubMed.
- K. D. Dobson and A. J. McQuillan, Langmuir, 1997, 13, 3392–3396 CrossRef.
- M. Fang, D. M. Kaschak, A. C. Sutorik and T. E. Mallouk, J. Am. Chem. Soc., 1997, 119, 12184–12191 CrossRef.
- S. Q. Liu, J. J. Xu and H. Y. Chen, Bioelectrochemistry, 2002, 57, 149–154 CrossRef PubMed.
- T. Yang, Y. Y. Feng, W. Zhang, S. Y. Ma and K. Jiao, J. Electroanal. Chem., 2011, 656, 140–146 CrossRef.
- N. N. Zhu, A. P. Zhang, Q. J. Wang, P. G. He and Y. Z. Fang, Anal. Chim. Acta, 2004, 510, 163–168 CrossRef.
- Q. X. Wang, F. Gao, X. Zhang, B. Zhang, S. X. Li, Z. S. Hu and F. Gao, Electrochim. Acta, 2012, 62, 250–255 CrossRef.
- Y. H. Guo, J. Wu, J. Li and H. X. Ju, Biosens. Bioelectron., 2016, 78, 267–273 CrossRef PubMed.
- Z. Wu, G. Q. Liu, X. L. Yang and J. H. Jiang, J. Am. Chem. Soc., 2015, 137, 6829–6836 CrossRef PubMed.
- Y. Liu, T. Shen, J. Li, H. Gong, C. Y. Chen, X. M. Chen and C. Q. Cai, ACS Sens., 2017, 2, 1430–1434 CrossRef PubMed.
- J. T. Liu, P. Du, J. Zhang, H. Shen and J. P. Lei, Chem. Commun., 2018, 54, 2550–2553 RSC.
- Q. M. Feng, Y. H. Guo, J. J. Xu and H. Y. Chen, ACS Appl. Mater. Interfaces, 2017, 9, 17637–17644 Search PubMed.
- X. Li, D. X. Li, W. J. Zhou, Y. Q. Chai, R. Yuan and Y. A. Xiang, Chem. Commun., 2015, 51, 11084–11087 RSC.
- S. Thiagarajan, T. H. Tsai and S. M. Chen, Biosens. Bioelectron., 2009, 24, 2712–2715 CrossRef PubMed.
- N. Zhang, K. Y. Zhang, Q. Wang, J. J. Xing and J. Chen, Chin. J. Anal. Lab., 2014, 33, 1413–1415 Search PubMed.
- G. Darabdhara, P. K. Boruah, P. Borthakur, N. Hussain, M. R. Das, T. Ahamad, S. M. Alshehri, V. Malgras, K. C. W. Wu and Y. Yamauchi, Nanoscale, 2016, 8, 8276–8287 RSC.
- P. K. Gupta, S. Tiwari, Z. H. Khan and P. R. Solanki, J. Mater. Chem. B, 2017, 5, 2019–2033 RSC.
- S. Li, L. G. Xu, W. Ma, X. l. Wu, M. Z. Sun, H. Kuang, L. B. Wang, N. A. Kotov and C. L. Xu, J. Am. Chem. Soc., 2016, 138, 306–312 CrossRef PubMed.
- K. Y. Zhang, L. Yang, F. Lu, X. C. Wu and J. J. Zhu, Small, 2018, 14, 1703858 CrossRef PubMed.
Footnote |
| † Electronic supplementary information (ESI) available: Cell culture; miRNA-21 extracts from cancer cells; TEM and EDX of ZrO2-RGO; the optimization of hybridization time; the nucleic acid sequences; comparison of linear range and detection limit of the reported sensors; determination results of miRNA-21 in human serum. See DOI: 10.1039/c8ra02453g |
| This journal is © The Royal Society of Chemistry 2018 |

