 Open Access Article
Ultrathin layered MoS2 nanosheets with rich active sites for enhanced visible light photocatalytic activity†
R. Abinayaad,
J. Archana *ab,
S. Harishc,
M. Navaneethan
 *ab,
S. Ponnusamya,
C. Muthamizhchelvana,
M. Shimomurad and
Y. Hayakawa
 cd
cd
aCenter for Material Science and Nanodevices, Department of Physics and Nanotechnology, SRM Institute of Science and Technology, Kattankulathur-603 203, Tamil Nadu, India. E-mail: jayaram.archana@gmail.com
bSRM Research Institute, SRM Institute of Science and Technology, Kattankulathur, Chennai 603203, Tamil Nadu, India. E-mail: mpnavaneethan@yahoo.co.in; Tel: +91 87544 20369
cResearch Institute of Electronics, Shizuoka University, 3-5-1 Johoku, Naka-Ku, Hamamatsu, Shizuoka 432-8011, Japan
dGraduate School of Science and Technology, Shizuoka University, 3-5-1 Johoku, Naka-Ku, Hamamatsu, Shizuoka 432-8011, Japan
First published on 25th July 2018
Abstract
Edge-rich active sites of ultrathin layered molybdenum disulphide (MoS2) nanosheets were synthesized by a hydrothermal method. The effect of pH on the formation of MoS2 nanosheets and their photocatalytic response have been investigated. Structural and elemental analysis confirm the presence of S–Mo–S in the composition. Morphological analysis confirms the presence of ultrathin layered nanosheets with a sheet thickness of 10–28 nm at pH 1. The interplanar spacing of MoS2 layers is in good agreement with the X-ray diffraction and high-resolution transmission electron microscopy results. A comparative study of the photocatalytic performance for the degradation of methylene blue (MB) and rhodamine B (RhB) by ultrathin layered MoS2 under visible light irradiation was performed. The photocatalytic activity of the edge-rich ultrathin layered nanosheets showed a fast response time of 36 min with the degradation rate of 95.3% of MB and 41.1% of RhB. The photocatalytic degradation of MB was superior to that of RhB because of the excellent adsorption of MB than that of RhB. Photogenerated superoxide radicals were the key active species for the decomposition of organic compounds present in water, as evidenced by scavenger studies.
1. Introduction
In recent years, two-dimensional transition metal dichalcogenides (2D TMDCs) have attracted increasing attention owing to their striking characteristics. Among these 2D TMDCs, MoS2 has drawn great attention owing to its remarkable properties. Bulk MoS2 has an indirect bandgap of 1.9 eV, which decreases to a 1.2 eV-direct narrow bandgap for monolayer MoS2. The crystal structure of MoS2 possess Mo and S atoms composed of S–Mo–S layers stacked by van der Waals force and bonded by strong in-plane covalent force.1 MoS2 mimics the nature and properties of graphite, such as transitions from indirect bandgap of the bulk material to the direct bandgap of the monolayer. These properties make MoS2 a functional material with a wide range of applications, such as the counter electrode in solar cell, hydrogen evolution reactions,2–5 lubricants,6 and as a photocatalyst. The earth abundant,7 highly active edge sites,8–12 large exciton binding energy,13 high anisotropic,14,15 and visible active region16–18 are some of the major advantageous of MoS2. MoS2 has two exposed surfaces, namely, the basal plane (002) and the edge sites plane (100), due to its high anisotropy crystal nature. Both theoretical19 and experimental10 results revealed that the basal planes of MoS2 are inert for catalytic activity, whereas the sulphur terminated edges act as highly active sites for catalytic anthracene hydrogenation.10 Additionally, there are numerous reports that have demonstrated enhanced photocatalytic activity by increasing the exposed edge active sites, and this method has been utilized in applications such as hydrogen evolution reaction (HER) in the MoS2 disordered layers, as reported by Xie et al.11The structural and morphological features extensively depend on the synthetic strategies for MoS2. Consequently, various methods have been developed to synthesize MoS2, such as the evaporation method,20,21 precipitation method,22 hydrothermal method,23–28 and exfoliation method.29,30 Among these methods, the hydrothermal method is the most facile to synthesize MoS2 with layered structures and high crystallinity. There are several reports evidencing that highly crystalline layered MoS2 structures with high adsorptions have been prepared by hydrothermal methods.31 Lin et al.17 reported that porous MoS2 was synthesized by a hydrothermal method at 240 °C, and this material decomposed methylene blue in 150 min under visible light irradiation. The microsphere shaped MoS2 was synthesized at 200 °C, and degraded methylene blue in 180 min under natural solar light irradiation.32 Liu et al.33 suggested that leaf-shaped MoS2 nanosheets have higher degradation rate for methyl orange compared to flower-shaped MoS2 nanoparticles synthesized by hydrothermal growth at 200 °C. It has been suggested that the leaf and layer shaped MoS2 possesses a larger specific surface area compared to flower-shaped MoS2, which leads to larger number of active edge sites per unit volume. The increase in the number of edge active sites proportionally improved the photocatalytic activity; thus, methyl orange was degraded in 70 min under visible light irradiation. Song et al.34 have investigated the ultrafast adsorption capacity of MoS2 nanosheets with the high specific area for the organic dye Congo red. These reports suggest that 2D MoS2 nanosheets possess higher photocatalytic efficiency compared to other morphologies. Unfortunately, designing catalysts with rich active sites and good crystallinity remains a challenge. Thus far, to the best our knowledge, there have been very few research reports on the photocatalytic performance of edge-rich active sites and highly crystalline ultrathin layered MoS2 with various morphologies obtained by varying the basic synthetic parameters such as pH values.
Herein, edge-rich ultrathin layered MoS2 nanosheets were synthesized via a hydrothermal method. The effect of pH on the structure, morphology and chemical states of MoS2 were investigated. The photocatalytic activities of the ultrathin layered MoS2 nanosheets were evaluated using MB and RhB as model pollutants. The effect of solution pH on the absorption of model dyes was systematically studied. Electron trapping experiments were performed to identify the active species for the degradation of the organic pollutants. The possible photocatalytic mechanism is proposed based on the experimental results.
2. Experimental section
All chemicals were analytical grade and used without further purification. Thiourea (CSN2H4, extra pure AR 99%, SRL), hexaammonium heptamolybdate tetrahydrate (NH4)6Mo7O24·4H2O, (extrapure AR 99%, SRL), hydrochloric acid (HCl, 37%, SRL), sodium hydroxide (NaOH, 97%, SRL), potassium persulphate (K2S2O8, 97%, WAKO) and benzoic acid (C7H6O2, 99.5%, WAKO).In a typical synthesis, 0.8 mol CSN2H4 and 0.02 mol (NH4)6Mo7O24·4H2O were dissolved in 72 mL of deionized water and stirred for 2 h. After the pH of the solution was adjusted to 5, the solution was transferred to a Teflon-lined stainless steel autoclave and maintained at 180 °C for 24 h. Then, the autoclave was cooled to room temperature and the obtained solution was centrifuged with water and ethanol. Finally, the resultant black precipitate was dried at 60 °C for 24 h. For the synthesis of MoS2 with different pH value, the initial pH of the reaction solution was adjusted to 1, 3, 11, and 13 by adding 4 M of HCl and 1.6 M of NaOH. The resultant samples were termed as S1, S2, S3, S4 and S5 for pH values 1, 3, 5, 11 and 13 respectively.
3. Characterization
The structure of the resultant products was characterized by X-ray diffraction (XRD) using CuKα radiation (λ = 1.5406 Å) with step interval of 0.01° ranging between 5° and 80° at the scan rate of 0.01° per 2 s. The morphology of the samples was investigated using a field emission scanning electron microscope (FESEM) (JEOL JSM 7001F microscope) with an accelerating voltage of 15 kV. Interplanar spacing was measured using a high resolution transmission electron microscope (HRTEM) (JEOL JEM 2100F Microscope) with an accelerating voltage of 200 kV. XPS analysis was performed using Shimadzu ESCA 3400 (Japan) to identify the chemical composition and valence states. UV-visible absorption (UV-vis) analyses were performed on a Shimadzu 3400 PC spectrophotometer using deionized water as a dispersing medium.4. Evaluation of photocatalytic activity
The photocatalytic dye degradation studies of the as-synthesized MoS2 were evaluated by the degradation of MB under visible light irradiation. A xenon lamp (MAX-303, Asahi Spectra) was used as a visible light source. The intensity of the Xenon lamp was measured using Lux meter (Model no. LX1330B – Dr. Meter), and determined to be 9000 Lux from the surface of the solution. The remaining procedures were adopted from the previous report.35 In a typical photocatalytic reaction, the initial concentration of the dye was fixed as 5 mg/100 mL and different loadings, namely, 5 mg, 10 mg, 15 mg, of photocatalyst were added successively. A 3 mL suspension was collected at regular intervals, centrifuged and analysed by a UV-vis spectrometer ranging from 500 to 750 nm. The degradation of MB and RhB was quantified from the decrease in the intensity of the associated characteristic absorption band at 664 nm and 554 nm. The photodegradation percentage of the dyes was calculated using the following equation:
 | (1) |
To achieve the complete understanding of the photocatalytic mechanism of MB over the ultrathin layered MoS2, scavenger trapping experiments utilizing active species trappers were conducted. Different scavengers, namely, potassium persulfate (K2S2O8) and benzoic acid (BA), were used to trap the photogenerated electrons and holes while keeping all the other conditions unchanged.
5. Results and discussions
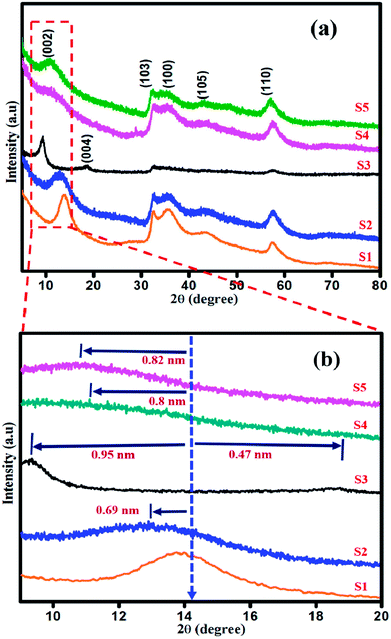
Powder X-ray diffraction studies were performed to analyse the crystalline nature of the as-synthesized samples, as shown in Fig. 1(a and b). The diffraction peaks in the XRD patterns of all the samples are in good agreement with the standard JCPDS: 75-1534 and are well matched with those of the pristine 2H structure of MoS2.36 The diffraction peaks for sample S1 at 14.08°, 32.5°, 35.7°, 43.8° and 57.5° correspond to (002), (103), (100), (105), and (110) planes, respectively, as shown in (Fig. 1(a)). The diffraction plane (002) is shifted to 12.9° with interlayer spacing d002 of 0.69 nm (Fig. 1(b)) in the XRD pattern of sample S2. The XRD pattern of sample S3 shows two new peaks appearing at 9.2° and 18.5° with an expanded interlayer spacing of d002 of 0.96 nm and 0.42 nm (Fig. 1(b), S3), as calculated by the Bragg's equation. This expansion is due to the incorporation of oxygen as a consequence of weak van der Waals force between the MoS2 layers.37 As shown in Fig. 1(b), in the XRD patterns of samples S4 and S5, (002) plane is shifted to 11.02° and 10.08° with d002 = 0.8 nm and 0.82 nm, respectively. Thus, with the addition of higher concentration of NaOH under vigorous stirring, the Na+ ions have enough energy to break the van der Waals interaction. The sodium ion will start intercalating in the sufficient interlayer spacing d = 0.6 nm of MoS2,38–40 resulting in the shifting of crystal planes with respect to its subsequent occupancy in between the layers of MoS2. The increase in the intensity of (002) diffraction plane for MoS2 prepared at low pH of 1 and 3 confirms the well-ordered atomic arrangement of S–Mo–S along the basal planes, whereas the broadened (002) plane for MoS2 prepared at pH 11 and 13 indicates the defects in the stacking of S–Mo–S layer.41 No other additional peaks were observed.Morphological analysis was performed by FESEM, TEM and HRTEM analysis. The morphological transformation from ultrathin layered nanosheets to densely aggregated nanospheres-like morphology was observed. Fig. 2(a and a1) shows the well dispersed and highly uniform ultrathin layered nanosheets of sharp edges that were obtained for sample S1 (pH 1). The average thickness of the nanosheets was about 10–28 nm. When the pH was increased to 3 and 5, the thickness of the obtained nanosheets also increased from 36–62 nm with distorted and obscured edges, as shown in Fig. 2(b, b1, c and c1). On further increasing the pH to 11, the obtained nanosheets were aggregated and elongated (Fig. 2(d and d1)). The thickness of the elongated nanosheets was about 508–483 nm and that of the aggregated nanosheets was about 38–49 nm. At higher pH of 13, the obtained nanosheets were aggregated to form a sphere-like morphology, as shown in Fig. 2(e and e1). The average thickness of the nanosheets was observed to be ∼20–30 nm.
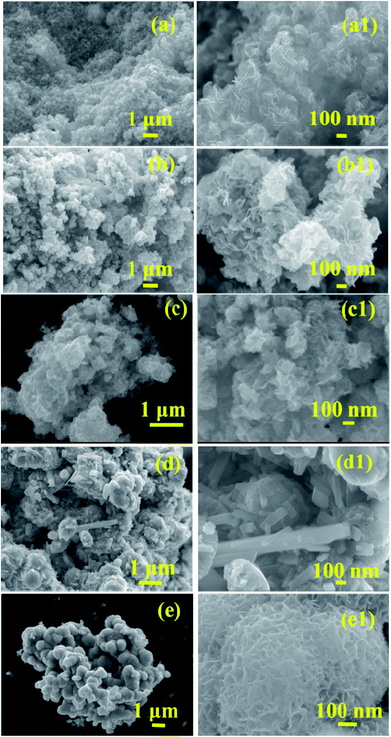 | ||
| Fig. 2 FESEM images of ultrathin layered MoS2nanosheets: S1 (a and a1) and S2 (b and b1), S3(c and c1), S4 (d and d1), and S5 (e and e1). | ||
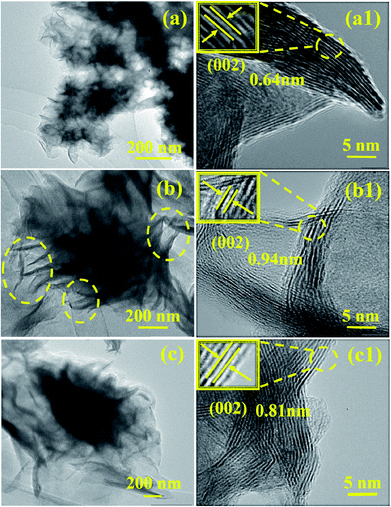 | ||
| Fig. 3 TEM and HRTEM images of layered MoS2 nanosheets: S1(a and a1), S3 (b and b1), and S5 (c and c1). | ||
Fig. 3 shows the TEM and HRTEM images of samples S1, S3 and S4. Sample S1 shows the individually dispersed nanosheets (Fig. 3(a)), in which the edges of the sheets are very sharp. High resolution TEM images exhibited good crystallinity with lattice spacing of 0.64 nm, (Fig. 3(a1)). With an increase in the pH to 5 (S5), the yellow dashed lines correspond to the wrinkled morphology of nanosheets with obscured edges, as shown in Fig. 3(b). The corresponding HRTEM image (Fig. 3(b1)) shows the less crystalline and non-homogenous lattice arrangement of the product with lattice spacing value of 0.94 nm. On further increasing the pH to 11, the obtained nanosheets aggregate to form a sphere-like morphology (Fig. 3(c)). The HRTEM image (Fig. 3(c1)) shows the overlapping of several nanosheets, and the corresponding lattice spacing value of 0.81 nm is in good agreement with the obtained XRD results. Fig. 4 shows the EDS elemental mapping of Mo and S for sample S1. It is clear that the distribution of Mo and S in the layered MoS2 nanostructure was uniform.
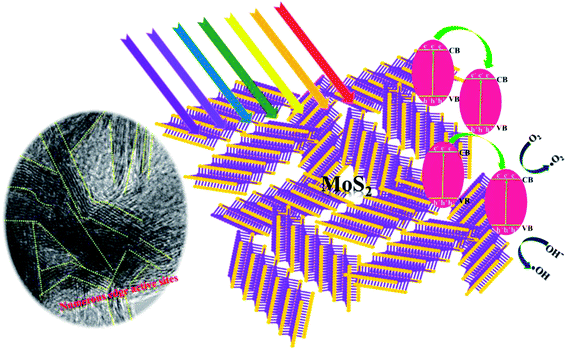
The reaction mechanism was examined by varying the pH, and showed the great promise for the study of the morphology evolution of MoS2. The XRD and HRTEM results revealed that the MoS2 samples S1 and S3 were highly crystalline, and the corresponding TEM image strongly implies that HCl acts as a dispersion agent to nurture the formation of ultrathin layered nanosheets. The wrinkled and disordered MoS2 layers of S3 may be beneficial for the insertion of alkali Na+ ions42 in samples S4 and S5. Thus, it assists MoS2 to exfoliate into a fewer number of layers, so that the sheet thickness might be reduced as previously discussed. However, the sheets are agglomerated into dense packed nanosheets, indicating the role of excess OH− ions in the reaction medium. The blocking effect of OH− ions along the 〈001〉 plane affects the direction of growth of the sample, and results in the formation of an ultrathin layered structure and leads to two-direction growth of the agglomerated MoS2 nanosheets. As shown in Fig. 1(b), the broadened (002) peak of S4 and S5 in XRD and numerous agglomerated layers in TEM (Fig. 5(c)) provides more evidence to confirm that blocking effect of the OH− ions leads to the agglomeration of MoS2 rather than central nucleation. It was suspected that agglomeration of nanosheets was formed during the hydrothermal process, which was previously reported by Sen and Mitra.43 Usually in 2H phase MoS2, the (002) plane represents the interference of AB stacked S–Mo–S and its periodic sequence along the c-axis in 2H symmetry.44 The controlled pH in the reaction process enables the tuning of the number of active sites in the samples, which particularly increased at pH 1. From the summary of the reported active sites of MoS2 with different morphologies, the number of active sites decreased simultaneously with an increase in the dense packing of the nanosheets.45 Another report suggests that the layer-shaped MoS2 could possess large number of edge active sites.33 Thus, the photocatalytic activity of samples will be promoted due to the abundant edge active sites. The MoS2 obtained at pH 1 was chosen to study the photocatalytic activity of MoS2 for the degradation of MB due to its ultrathin nanosheet thickness and abundant active sites, which were revealed by HRTEM images. Finally, a possible mechanism is proposed (Scheme 1).
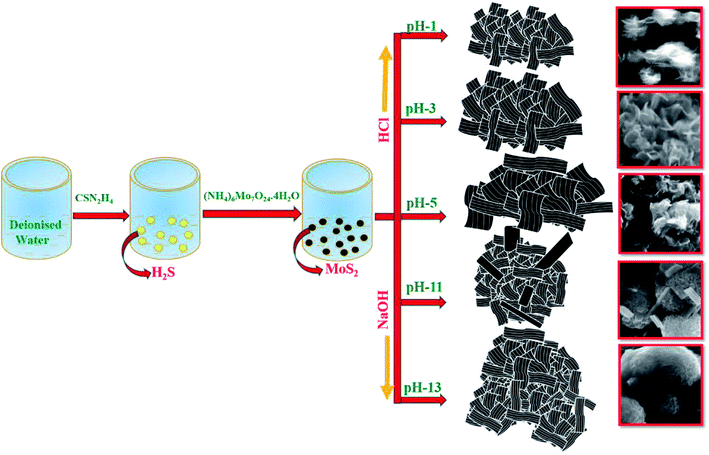 | ||
| Scheme 1 Possible reaction mechanism of edge-rich active sites of ultrathin layered MoS2 nanosheets. | ||
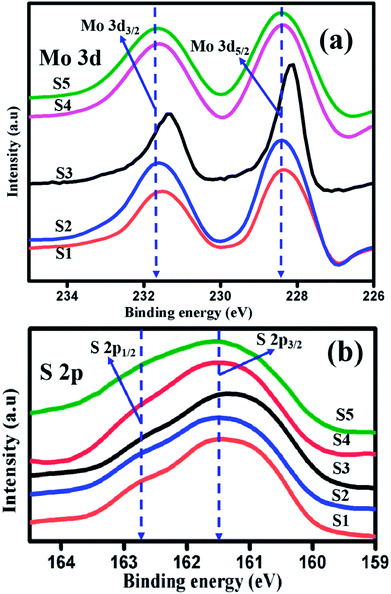
The core level chemical states of ultrathin layered MoS2 have been characterized by XPS, as shown in Fig. 5(a and b). Fig. 5(a) shows the high resolution XPS spectra of the Mo 3d state with two predominant peaks. The peaks appear at 228.1 eV and 231.4 eV, and represent the oxidation state of tetravalent Mo4+ state, as a result of spin–orbit splitting of 3d5/2 and 3d3/2. The energy difference between the two peaks is 3.2 eV.46 When the pH was adjusted to 3, 5, 11, and 13 for preparing samples S2 to S5, the oxidation state of the doublet peaks of 3d5/2 and 3d3/2 appeared at 228.2 eV and 231.4 eV (S2), 228.1 eV and 231.3 eV (S3), 228.3 eV and 231.3 eV (S4), and 228.4 eV and 231.3 eV (S5), respectively, and their corresponding energy differences are 3.1 eV (S2, S3, S4) and 3.03 eV (S5). Fig. 5(b) represents the high resolution XPS spectra of S 2p. The characteristic binding energies for samples S1, S2, S3, S4, and S5 appear at 161.1 eV and 162.4 eV, 161.2 eV and 162.3 eV, 161.1 eV and 162.4 eV, 161.3 and 162.3, and 161.2 and 162.2 eV, respectively. The energy difference in the doublet peaks are 1.2 eV (S1, S2, S3) and 1 eV (S4, S5). The small shift in the energy differences is due to the effect of NaOH and HCl in the initial formation of MoS2 reaction solution. Thus, the presence of tetravalent Mo4+ and divalent sulphide ions S2− oxidation state confirmed the formation of S–Mo–S in the compositions.
5.1. Photocatalytic studies
The photocatalytic decomposition of MB as a target pollutant of dye with the as-prepared MoS2 catalysts was performed under visible light irradiation. Prior to the photocatalytic experiments, adsorption–desorption equilibrium was achieved, and the concentration of MB after adsorption was considered as the initial absorbance of MB. The initial absorption peak centred at 664 nm gradually decreased in intensity with the increase in irradiation time. The degradation profile was plotted as time (t) versus C/C0, where C0 is the initial concentration of MB and C is the concentration of MB at time t. Fig. 6(a–e) shows the UV absorption spectra of samples (S1, S2, S3, S4 and S5) with fixed irradiation time of 36 min. Fig. 6(f) shows that the degradation percentage of samples S1, S2, S3, S4 and S5 were 95.3, 72.6, 27, 19.6 and 12.04%, respectively. The degradation percentage decreased for samples S2, S3, S4 and S5 with enhanced activity observed for sample S1. This is due to the decrease in active sites with the increase in the thickness of the nanosheets, which restricts the numerous edge active sites of the samples. For comparison, the photocatalytic activity of commercial TiO2 Degussa P25 was examined. Fig. ES2† shows the time dependent UV absorption spectra of the P25 catalyst with irradiation time of 36 min, and the degradation percentage was calculated to be 24.4%. The photocatalytic activity of layered MoS2 nanosheets were four times faster than the commercial TiO2. Brunauer–Emmett–Teller (BET) analysis was performed to determine the surface area and porosity of layered MoS2 nanosheets. As shown in Fig. 7(a and b), the surface areas and the average pore size were determined to be 74.3, 31.1, 30.3, 15.2, and 32.4 m2 g−1 and 3.2, 2.4, 1.9, 1.7, and 1.5 nm for samples S1, S2, S3, S4 and S5, respectively. The relatively large surface area of sample S1 provides more edge active sites for adsorption of dye molecules, which would be beneficial for the fast adsorption of dye and transfer of the adsorbed molecules to the internal part of the layered structure of MoS2. The above-discussed pore size analysis revealed that higher pH for the preparation of MoS2 reduces the pore size. This significantly suppresses the interaction of the organic pollutant with the photocatalyst (Scheme 2).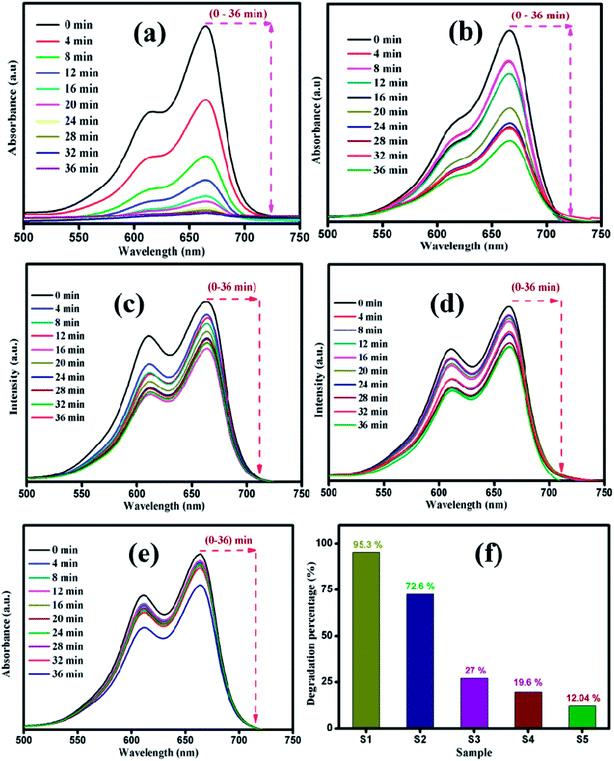 | ||
| Fig. 6 Time dependent UV-vis absorbance spectra of MB degradation by sample (a) S1, (b) S2 (c) S3, (d) S4, and (e) S5. (f) Maximum degradation percentage of all the samples. | ||
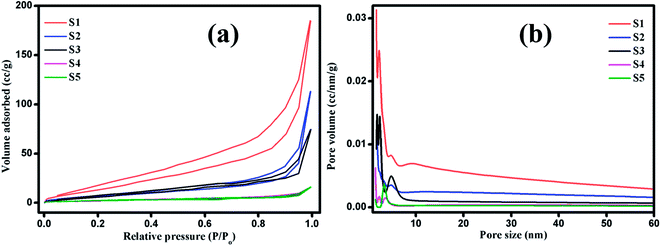 | ||
| Fig. 7 (a) Nitrogen adsorption/desorption isotherms and (b) pore size distribution curves of layered MoS2 nanosheets: S1, S2, S3, S4 and S5. | ||
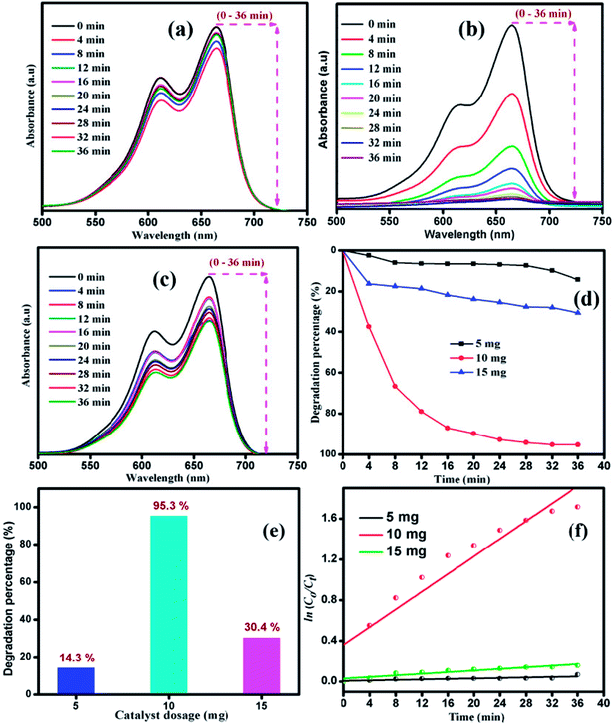
The influence of catalyst dosage on the photodecomposition of MB with varying S1 catalyst concentration was investigated. Fig. 8 shows the time-resolved degradation of MB for sample S1 with 5, 10 and 15 mg of catalyst. The degradation efficiency curve, disclosed in Fig. 8(d), shows the percentage of MB degradation. After the irradiation for 36 min, 14.3, 95.3 and 30.4% of MB was decomposed by the catalyst S1 with 5, 10 and 15 mg of catalyst, respectively. The optimal catalyst dosage of 10 mg showed fast degradation compared to other catalyst dosage. Recently, Han et al. studied the adsorption capability with 10 mg of MoS2 catalyst and matched the theoretical studies with isotherm and kinetics studies.45 The experimental degradation data were fitted with pseudo-first order kinetic plot, as shown in Fig. 8(f).
| ln(C0/Ct) = −kappt | (2) |
The apparent rate constant Kapp of the kinetic degradation is 0.0012, 0.043, and 0.0039 for 5, 10 and 15 mg catalyst, respectively. The removal rate of MB at 10 mg catalyst was found to be higher than that for the catalysts with other dosages. Hence, the dosage effect demonstrates that on increasing the dosage from 5 to 10 mg, the pollutant degradation rate increased due to the availability of more active sites in the catalyst for the absorption of photons and more interactions with MB molecules.47,48 Moreover, the increase in degradation efficiency was related to the enhanced generation of oxidizing radicals, which consequently increased the degradation of dye. In further increase in the dosage to 15 mg, the degradation rate was decreased due to the occurrence of light scattering effect.49–51 Thus, the particle–particle interaction will be increased rather than particle–dye interaction, resulting in a decrease in catalyst surface area for the absorption of photons. The sample subjected to photocatalytic process was extracted to check its stability. Fig. ES1(a)† shows the XRD pattern of MoS2 before and after the photocatalytic reaction. It can be clearly observed that the phase and structure of the sample remains unchanged even after the photocatalytic reaction. Fig. ES1(b and c)† show the XPS spectra of sample S1 before and after the photocatalytic reaction. The high resolution XPS spectrum of Mo 3d has two predominant peaks at 231.4 eV and 228.1 eV, corresponding to 3d3/2 and 3d5/2 with the separation energy of 3.2 eV. The high resolution XPS spectrum of S 2p has two asymmetric peaks at 162.4 eV and 161.1 eV, which are attributed to 2p1/2 and 2p3/2, respectively. No peak shift for Mo 3d and S 2p was observed in the XPS spectrum of sample S1 before and after the photocatalytic reaction. Thus, the structural and elemental analysis suggests that MoS2 is stable after the photocatalytic reaction.
Fig. 9 shows the photocatalytic performance of sample S1 under UV and visible light irradiation. UV absorption spectra were recorded at various time intervals during the degradation of MB by sample S1 under UV light irradiation, as shown in Fig. 9(a). Under UV light irradiation, sample S1 showed less degradation rate of MB. The degradation percentage of MB was about 91.3% in 105 min of irradiation. However, the same sample exhibited a degradation percentage of 95.3% in 36 min under visible light irradiation. Thus, it is clear that visible light drives the photocatalytic process as sample S1 shows the best enhancement in the photodecomposition of MB under visible light irradiation. Upon irradiation of visible light, electrons (e−) will get excited from valence band (VB) to the conduction band (CB) by leaving behind holes (h+) in the valence band. The excited electrons will react with oxygen to produce superoxide radicals (˙O2−) and subsequently react with water to form OH−˙ radicals in the reaction pathway. Moreover, the h+ in the VB will react with OH− and adsorbed H2O to produce reactive OH−˙ radicals. Thus, the generated ˙O2− and OH−˙ are responsible for the degradation of the dye. When the catalyst was illuminated with light of lesser/higher energy than that of the bandgap of the photocatalyst, the electron and hole recombination rate increased.52,53 Thus, the number radicals to degrade the dye will be insufficient. Thus, the degradation is higher under visible light compared to UV light irradiation. The variation in the n → π* energy transition of the source and the corresponding dye azo linkage is the crucial factor that affects the degradation rate.
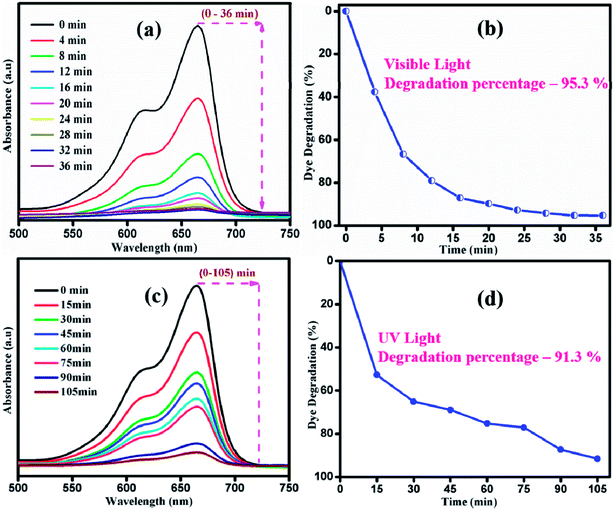 | ||
| Fig. 9 Time dependent of UV-vis absorbance spectra of MB under (a) visible and (c) UV irradiation. Degradation percentage of MB under (b) visible and (d) UV light irradiation of sample S1. | ||
A comprehensive study of the different photocatalytic performance for the degradation of different dyes (MB and RhB) under visible light irradiation was conducted in this study. The degradation of MB and RhB was demonstrated and 95.3% and 41.1% of the dyes were degraded, as shown in Fig. 10(a). The apparent rate constant Kapp from the pseudo-first order kinetic plot (Fig. 10(b)) were calculated as 0.043 and 0.029 for MB and RhB, respectively. Though RhB and MB are cationic dyes, the photocatalytic response is less for RhB. This may be due to the adsorption of the onto nanostructured surface of the photocatalyst. However, the variation in the reaction rate is due to the different chemical structures and the adsorption characteristics that will vary the activation energy of the catalytic activity. The strong absorption of light might have an inhibitive effect on the photogeneration of holes or hydroxyl radicals in RhB due to the insufficient direct contact between the photons and immobilized catalyst material. This causes the dye molecules to adsorb light and prevent the photons from reaching the photocatalyst surface, thus reducing the photodegradation efficiency. The photocatalytic performance of MoS2 developed in this study was compared with recent reports, as shown in Table 1. It can be observed that ultrathin layered MoS2 nanosheets synthesized in this study showed enhanced activity with a greater amount of dye loading (100 mg L−1). The ultrathin layered MoS2 nanosheets exhibited the degradation percentage of 95.3% in 36 min under visible light irradiation, which is higher than other reported values.
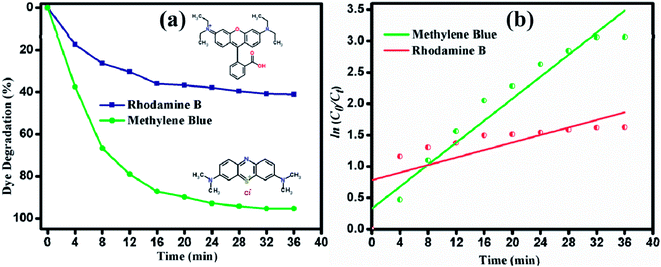 | ||
| Fig. 10 (a) Degradation percentage. (b) Pseudo first-order kinetic plot of degradation of MB and RhB under visible light irradiation. | ||
| Materials | Morphology | Light source | Dye | Catalyst amount (mg L−1) | Degradation percentage (%) | Time taken for degradation (min) | Ref. |
|---|---|---|---|---|---|---|---|
| MoS2 | Porous | 100 W Xenon lamp | MB | 10 | 89.2 | 150 | 17 |
| MoS2 | Microspheres | Solar light | MB | 100 | 98.6 | 180 | 32 |
| RhB | 100 | 97.9 | 180 | ||||
| MoS2 | Flower-like spheres | 150 W xenon lamp | MB | 40 | 95.6 | 90 | 55 |
| MoS2/TiO2 | Nanospheres | 500 W Xenon lamp | RhB | 10 | 81.8 | 180 | 56 |
| MoS2/GO | Nanosheets | 500 W Xenon lamp | MB | 10 | 99 | 60 | 57 |
| MoS2 | Ultrathin nanosheets | 400 W Asahi spectra (Xenon lamp) | MB | 100 | 95.3 | 36 min | This work |
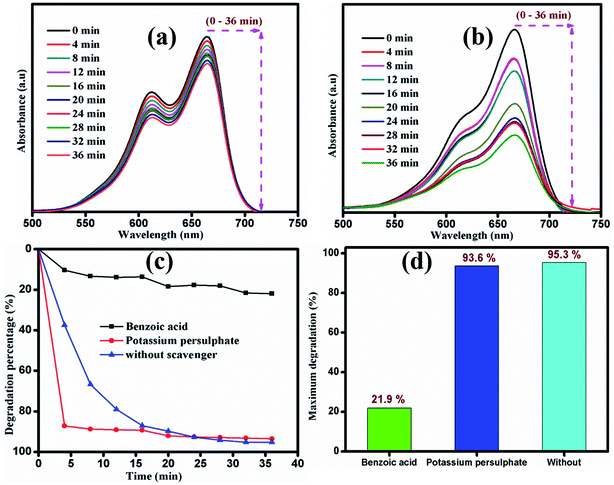
The photocatalytic mechanism of the catalyst during the degradation process was investigated using scavengers K2S2O8 and C7H6O2 as inorganic oxidants and organic anions, respectively. About 21.9% of the dye was degraded after the addition of benzoic acid, whereas potassium persulphate-containing dye solution was degraded up to 93.6% within 36 min of irradiation time, as shown in Fig. 11. During the reaction process, MB molecules were adsorbed on the surface of photocatalyst and further decomposed into intermediates via opening of the central aromatic ring under light irradiation. The enhanced degradation of the dye in the presence of potassium persulphate is attributed to the following possible mechanism.
| MoS2 + hγ → MoS2 (eCB− + hVB+) | (3) |
| S2O82−+ eCB− → SO4−˙ + SO42− | (4) |
| SO4−˙ + H2O + MB → OH−˙ + SO42−˙ + H+ + MB+˙ | (5) |
| OH−˙ + SO42−˙ + H+ + MB +˙ → SO42−˙ + CO2 + NO3− + NH4+ + Cl− + H2O | (6) |
The photon energy absorbed by MoS2 was high compared to the bandgap of the material. This results in photogenerated holes (hVB+) and photogenerated electrons (eCB−). The photogenerated electrons could easily produce SO4−˙ and SO42− (sulphate radical anions and sulphate anions) from the fragmented molecule of potassium sulphate ions (S2O82−). SO4−˙ radicals are powerful oxidants that can attack at various positions in the dye molecule. They can attack the aromatic carbon rapidly by adding hydrogen, thus increasing the degradation rate. The sulphate radical anion has more possible ways to degrade the dye molecules, namely, removing the electron from carboxylate anion and from reliable neutral molecules.54 Additionally, it may also trap the photogenerated electron/generated hydroxyl radical. The sulphate radical anion decomposes MB into MB radical cations with the intermediates of hydroxyl radicals under visible light irradiation. Hence, the large number of initially formed OH−˙ radicals results in the faster dye degradation. Furthermore, the organic compounds were decomposed into harmless intermediates, namely, CO2, SO42−, NH4+ and NO3−.
Through the HRTEM results, it was revealed that the numerous edge active sites are occupied in the highly crystalline sample S1. It was previously demonstrated that MoS2 with large number of edge active sites possess high photocatalytic degradation of methyl orange.33 Our study demonstrates that a decrease in the thickness of MoS2 layer leads to an increase in the number edge active sites and the fast degradation of MB (within 36 min) was observed under visible light irradiation. Hence, the ultrathin layered MoS2 nanosheets (S1) synthesized without any capping ligands or dopant showed enhanced photocatalytic activity. The ultrathin MoS2 nanosheets of sample S1 possess high adsorption stability and increased active edge sites. The large number of edge active sites may support the hydroxyl radicals (˙OH) and superoxide radicals (˙O2−) for decomposing the organic dyes.
6. Conclusion
Ultrathin layered MoS2 nanosheets with edge-rich active sites were successfully synthesized by a hydrothermal method at optimized pH value of 1. The XRD results revealed the formation of pure phase of hexagonal 2H MoS2 and the interplanar spacing is in good agreement with that obtained through the HRTEM results. The sheet thickness of the ultrathin MoS2 nanosheets was reduced to 10–28 nm compared to other samples. The photocatalytic activity of ultrathin layered MoS2 nanosheets has been estimated by decomposition of MB dye under UV and visible light irradiation. The optimized dosage concentration for degradation was estimated to be 10 mg. The enhanced activity was observed under visible light, as MB was decomposed in 36 min, which is attributed to the formation of large number of edge active sites. The fast decomposition of MB in the presence of K2S2O8 compared to that in presence of C7H6O2 scavenger indicates the larger rate formation of hydroxyl radicals (˙OH) that may be involved in the degradation process rather than superoxide radicals (˙O2−).Conflicts of interest
There are no conflicts to declare.Acknowledgements
The authors would like to thank Prof. K. Murakami, Mr T. Koyama and Mr W. Tomoda, Center for Nanodevice fabrication and analysis for instrument facilities.References
- J. Brivio, D. T. L. Alexander and A. Kis, Nano Lett., 2011, 11, 5148 CrossRef PubMed.
- H. Yu, J. Xu, H. Guo, Y. Li, Z. Liu and Z. Jin, RSC Adv., 2017, 7, 56417 RSC.
- B. Chai, C. Liu, C. Wang, J. Yan and Z. Ren, Chin. J. Catal., 2017, 38, 2067 CrossRef.
- Y. Suo, H. Liu, S. Huang, Y. Zhang and K. Ding, Appl. Surf. Sci., 2017, 17, 33664 Search PubMed.
- Q. Xiang, J. Yu and M. Jaroniec, J. Am. Chem. Soc., 2012, 134, 6575 CrossRef PubMed.
- Y. Liu, K. Hu, E. Hu, J. Guo, C. Han and X. Hu, Appl. Surf. Sci., 2017, 392, 1144 CrossRef.
- Z. Yu, J. Ye, W. Chen and S. Xu, Mater. Lett., 2017, 188, 48 CrossRef.
- M. R. Gao, M. K. Y. Chan and Y. Sun, Nat. Commun., 2015, 6, 7493 CrossRef PubMed.
- M. V. Bollinger, J. V. Lauritsen, K. W. Jacobsen, J. K. Nørskov, S. Helveg and F. Besenbacher, Phys. Rev. Lett., 2001, 87, 196803 CrossRef PubMed.
- M. Li, D. Wang, J. Li, Z. Pan, H. Ma, Y. Jiang and Z. Tian, RSC Adv., 2016, 75, 71534 RSC.
- J. Xie, J. Zhang, S. Li, F. Grote, X. Zhang, H. Zhang, R. Wang, Y. Lei, B. Pan and Y. Xie, J. Am. Chem. Soc., 2013, 135, 17881 CrossRef PubMed.
- J. Kibsgaard, Z. Chen, B. N. Reinecke, T. F. Jaramillo, N. Saigal, V. Sugunakar and S. Ghosh, Nat. Mater., 2012, 11, 963 CrossRef PubMed.
- N. Saigal, V. Sugunakar and S. Ghosh, Appl. Phys. Lett., 2016, 108, 132105 CrossRef.
- M. Yamamoto, T. L. Einstein, M. S. Fuhrer and W. G. Cullen, J. Phys. Chem. C, 2013, 117, 25643 CrossRef.
- J. B. Wu, H. Zhao, Y. Li, D. Ohlberg, W. Shi, W. Wu, H. Wang and P. H. Tan, Adv. Opt. Mater., 2016, 4, 756 CrossRef.
- M. Sabarinathan, S. Harish, J. Archana, M. Navaneethan, H. Ikeda and Y. Hayakawa, RSC Adv., 2017, 7, 24754 RSC.
- Z. Zhou, Y. Lin, P. Zhang, E. Ashalley, M. Shafa, H. Li, J. Wu and Z. Wang, Mater. Lett., 2014, 131, 122 CrossRef.
- M. Sabarinathan, S. Harish, J. Archana, M. Navaneethan, H. Ikeda and Y. Hayakawa, RSC Adv., 2017, 7, 24754 RSC.
- V. Lauritsen, M. Nyberg, J. K. Nørskov, B. S. Clausen, H. Topsøe, E. Lægsgaard and F. Besenbacher, J. Catal., 2004, 224, 94 CrossRef.
- J. Sun, X. Li, W. Guo, M. Zhao, X. Fan, Y. Dong, C. Xu, J. Deng and Y. Fu, Crystals, 2017, 7, 198 CrossRef.
- Y. Lin, W. Zhang, J. K. Huang, K. K. Liu, Y. H. Lee, C. T. Liang, C. W. Chud and L. J. Li, Nanoscale, 2012, 4, 6637 RSC.
- S. V. P. Vattikuti, C. Byon, C. V. Reddy, J. Shim and B. Venkatesh, Appl. Phys. A: Mater. Sci. Process., 2015, 119, 813 CrossRef.
- X. Lu, Y. Lin, H. Dong, W. Dai, X. Chen, X. Qu and X. Zhang, Sci. Rep., 2017, 7, 42309 CrossRef PubMed.
- A. Midya, A. Ghorai, S. Mukherjee, R. Maiti and S. K. Ray, J. Mater. Chem. A, 2016, 4, 4534 RSC.
- N. Tian, Z. Li, D. Xu, Y. Li, W. Peng, G. Zhang, F. Zhang and X. Fan, Ind. Eng. Chem. Res., 2016, 55, 8726 CrossRef.
- W. Zhou, Z. Yin, Y. Du, X. Huang, Z. Zeng, Z. Fan, H. Liu, J. Wang and H. Zhang, Small, 2013, 9, 140–147 CrossRef PubMed.
- Q. Li, N. Zhang, Y. Yang, G. Wang and D. H. L. Ng, Langmuir, 2014, 30, 89652 Search PubMed.
- S. Muralikrishna, K. Manjunath, D. Samrat, V. Reddy, T. Ramakrishnappa and D. H. Nagarajud, RSC Adv., 2015, 5, 89389 RSC.
- X. Fan, P. Xu, D. Zhou, Y. Sun, Y. C. Li, M. A. T. Nguyen, M.Terrones and T. E. Mallouk, Nano Lett., 2015, 15, 5956 CrossRef PubMed.
- G. Z. Magda, J. Pető, G. Dobrik, C. Hwang, L. P. Biró and L. Tapasztó, Sci. Rep., 2015, 5, 14714 CrossRef PubMed.
- H. Li, F. Xie, W. Li, B. D. Fahlman, M. Chen and W. Li, RSC Adv., 2016, 6, 105222 RSC.
- J. Wang, S. Dong, T. Guo, J. Jin and J. Sun, Mater. Lett., 2016, 16, 31974 Search PubMed.
- W. Liu, Q. Hu, F. Mo, J. Hu, Y. Feng, H. Tang, H. Ye and S. Miao, J. Mol. Catal. A: Chem., 2014, 395, 322 CrossRef.
- H. J. Song, S. You and X. H. Jia, Appl. Phys. A, 2015, 121, 541 CrossRef.
- S. Harish, M. Navaneethan, J. Archana, A. Silambarasan, S. Ponnusamy, C. Muthamizhchelvan and Y. Hayakawa, Dalton Trans., 2015, 44, 10490 RSC.
- R. G. Dickinson and L. Pauling, J. Am. Chem. Soc., 1923, 45, 1466 CrossRef.
- R. Vinoth, I. M. Patil, A. Pandikumar, B. A. Kakade, N. M. Huang, D. D. Dionysios and B. Neppolian, ACS Omega, 2016, 1, 971 CrossRef.
- X. Wang, X. Shen, Z. Wang, R. Yu and L. Chen, ACS Nano, 2014, 8, 11394 CrossRef PubMed.
- Z. Wang, A. V. D. Bussche, Y. Qiu, T. M. Valentin, K. Gion, A. B. Kane and R. H. Hurt, Environ. Sci. Technol., 2016, 50, 7208 CrossRef PubMed.
- Q. Li, Z. Yao, J. Wu, S. Mitra, S. Hao, T. S. Sahu, Y. Liu, C. Wolverton and V. P. Dravid, Nano Energy, 2017, 38, 342 CrossRef.
- G. S. Bang, K. W. Nam, J. Y. Kim, J. Shin, J. W. Choi and S. Y. Choi, ACS Appl. Mater. Interfaces, 2014, 6, 7084 CrossRef PubMed.
- C. Li, J. Li, Z. Wang, S. Zhang, J. G. wei, J. Zhang, H. Wang and C. An, Inorg. Chem. Front., 2017, 4, 309 RSC.
- U. K. Sen and S. Mitra, ACS Appl. Mater. Interfaces, 2013, 5, 1240 CrossRef PubMed.
- X. Sun, Z. Wang, Z. Li and Y. Q. Fu, Sci. Rep., 2016, 6, 26666 CrossRef PubMed.
- S. Han, K. Liu, L. F. Hu, F. Teng, P. Yu and Y. Zhu, Sci. Rep., 2017, 7, 43599 CrossRef PubMed.
- F. Z. Wang, M. J. Zheng, B. Zhang, C. Q. Zhu, Q. Li, L. Ma and W. Z. Shen, Sci. Rep., 2016, 6, 31092 CrossRef PubMed.
- P. Saikia, A. T. Mia and P. P. Das, J. Chem. Sci., 2017, 129, 81 CrossRef.
- Q. X. F. Cheng and D. Lang, ChemSusChem, 2016, 9, 996 CrossRef PubMed.
- S. Rani, M. Aggarwal, M. Kumar, S. Sharma and D. Kumar, Water Science, 2016, 30, 51 CrossRef.
- D. Lang, T. Shen and Q. Xiang, ChemCatChem, 2015, 7, 943 CrossRef.
- K. He, J. Xie, M. Li and X. Li, Appl. Surf. Sci., 2018, 430, 208 CrossRef.
- T. Jia, A. Kolpin, C. Ma, R. C. T. Chan, W. M. Kwok and S. C. EdmanTsang, Chem. Commun., 2014, 50, 1185 RSC.
- H. Yu, P. Xiao, P. Wang and J. Yu, Appl. Catal., B, 2016, 193, 217 CrossRef.
- B. Neppolian, H. C. Choi, S. Sakthivel, B. Arabindoo and V. Murugesan, Chemosphere, 2002, 46, 1173 CrossRef PubMed.
- B. Sheng, J. Liu, Z. Li, M. Wang, K. Zhu, J. Qiu and J. Wang, Mater. Lett., 2015, 144, 153 CrossRef.
- W. Zhou, Z. Yin, Y. Du, X. Huang, Z. Zeng, Z. Fan, H. Liu, J. Wang and H. Zhang, Small, 2013, 9, 140 CrossRef PubMed.
- C. Wang, H. Lin, Z. Liu, J. Wu, Z. Xu and C. Zhang, Part. Part. Syst. Charact., 2016, 33, 221 CrossRef.
Footnote |
| † Electronic supplementary information (ESI) available. See DOI: 10.1039/c8ra02560f |
| This journal is © The Royal Society of Chemistry 2018 |

