DOI:
10.1039/C8RA02751J
(Paper)
RSC Adv., 2018,
8, 22559-22568
Microwave hydrothermal synthesis of α-MnMoO4 nanorods for high electrochemical performance supercapacitors
Received
29th March 2018
, Accepted 7th June 2018
First published on 20th June 2018
Abstract
Pristine α-MnMoO4 nanorods were facilely prepared via co-precipitation (Cp) and microwave hydrothermal (MH) methods. X-ray diffraction (XRD) patterns showed pure monoclinic crystalline phase α-MnMoO4 for the heat treated powder at 500 °C. Fourier Transform Infrared (FTIR) spectra showed that the chemical bond structure of α-MnMoO4 corresponds to the strong vibrational modes of Mo–O–Mo, Mo–O and Mo![[double bond, length as m-dash]](https://www.rsc.org/images/entities/char_e001.gif) O. Raman spectra showed the structural bonding and crystalline nature of α-MnMoO4. Field Emission Scanning Electron Microscope (FE-SEM) images exposed the nanorod shape of the α-MnMoO4 powder, with diameters of ∼200 nm and lengths of ∼1.6 μm. Electrochemical studies of the Cp- and MH-MnMoO4 nanorods with 2 M NaOH as the electrolyte showed specific capacitances of 143 F g−1 and 551 F g−1, respectively, at a 1 A g−1 constant discharge current density. Cyclic voltammetric (CV) studies of the MH-MnMoO4 nanorods at various scan rates revealed the presence of redox pairs, suggesting a pseudocapacitive nature. The structural stability at different current densities demonstrated the high rate performances and good reversible capacity retention of the calcined MH-MnMoO4 nanorods. A cycling life stability study of MH-MnMoO4 demonstrated a good capacity retention of 89% of the initial specific capacitance at 5 A g−1 after 1000 cycles.
O. Raman spectra showed the structural bonding and crystalline nature of α-MnMoO4. Field Emission Scanning Electron Microscope (FE-SEM) images exposed the nanorod shape of the α-MnMoO4 powder, with diameters of ∼200 nm and lengths of ∼1.6 μm. Electrochemical studies of the Cp- and MH-MnMoO4 nanorods with 2 M NaOH as the electrolyte showed specific capacitances of 143 F g−1 and 551 F g−1, respectively, at a 1 A g−1 constant discharge current density. Cyclic voltammetric (CV) studies of the MH-MnMoO4 nanorods at various scan rates revealed the presence of redox pairs, suggesting a pseudocapacitive nature. The structural stability at different current densities demonstrated the high rate performances and good reversible capacity retention of the calcined MH-MnMoO4 nanorods. A cycling life stability study of MH-MnMoO4 demonstrated a good capacity retention of 89% of the initial specific capacitance at 5 A g−1 after 1000 cycles.
1. Introduction
Recently, the design and manufacture of systems from simple electronic devices to hybrid electric vehicles has demonstrated a great need for a huge quantity of efficient energy-producing, energy-absorbing, and energy-storage technologies. The essential sustainable energy storage devices are electrochemical capacitors or supercapacitors, which have established conversion systems, fast charge–discharge processes, enhanced cycle stability, and higher power and energy density than batteries.1–4 Based on the charge storage mechanism, supercapacitors can be classified as electric double layer capacitors (EDLCs) and redox- or pseudocapacitors.5 The EDLC function is to accumulate electrical charge by electrostatic separation of charges at electrode/electrolyte interfaces with reversible electrolyte ion movement. For pseudocapacitors, charge transfer occurs by a fast reversible redox reaction and active ion interactions at the electrode surface results in fast charge–discharge rates.6–8
Among the two types of capacitor, the charge accumulated in pseudocapacitors is comparatively greater than in the EDLCs. However, the pseudocapacitor electroactive materials suffer from a major problem of shrinking or swelling, which reduces their stable cycling performances. In addition, the larger particle size of the electrode materials can lower the specific capacitance values, as only a smaller surface area is permitted to interact with the electrolyte ions participating in the redox reactions.9–13 As a result, many researchers have studied various combinations of electroactive materials, like single transition metal oxides/hydroxides (e.g. MnO2, SnO2, Co3O4, Co(OH)2 and Ni(OH)2) with carbonaceous substances such as CNT, activated carbon, and graphene, which could help to solve the problems. Also, the active electrode material particle size and morphology are significant in determining the capacitances.
In recent years, alternate electrode materials have been developed that are various combinations of binary and ternary transition metal oxides with different nanoscale morphologies, such as NiMoO4,14 CoMoO4,15 and MnMoO4.16 The formed oxide electrodes with characteristic redox reactions have demonstrated that they exhibit good electrochemical performances. Among the family of metal molybdates, MnMoO4 has been considered a potential candidate electrode for supercapacitor applications because of the enhanced electrochemical properties of the manganese ions.17 The metal oxide morphologies depend on different synthesis methods. Among them, one-dimensional morphology materials with good physical, chemical and electrochemical properties have been shown to be potential electrodes for supercapacitors. In the literature, there are many reports of one-dimensional nanomaterials synthesised via different synthesis routes. Mai et al. reported the capacitance of MnMoO4/CoMoO4 composite nanowires prepared via a micro-emulsion method as 187.1 F g−1 at 1 A g−1.18 In the reports of Yan et al., the specific capacitance of MnMoO4 nanosheets grown on nickel foam via hydrothermal synthesis and annealed in a hydrogen atmosphere to form H–MnMoO4 nanosheets was 376 F g−1, which is 17-fold greater than that of the pristine MnMoO4 nanosheets.19 Ghosh et al. reported that α-MnMoO4 nanoparticles prepared hydrothermally demonstrated a capacitance of 234 F g−1 at 2 A g−1.20 In the reports of Wang et al., 3D fan-like α-MnMoO4 nanostructures exhibited a specific capacitance of 562 F g−1 at 1 A g−1.21 Senthilkumar et al. reported a solution combustion method synthesis of MnMoO4 that gave a specific capacitance of 126 F g−1 at a current density of 5 mA cm−2.22 Thus, maintaining the size and morphology of the electrode materials through various synthesis methods has provided a way to enhance the electrochemical properties, conductivity, cyclability and energy and power densities.23 Recently, a microwave hydrothermal (MH) assisted synthesis method has been extensively used to prepare nanosized sulfides, hydroxides, and oxides with various morphologies. The microwave hydrothermal (MH) method is simple, clean, requires a short time to attain the appropriate reaction temperature, and allows controlled morphology of particles without thermal gradient effects.24–27
The present work demonstrates facile synthetic methods for developing pristine α-MnMoO4 nanorods via co-precipitation (Cp) and microwave hydrothermal (MH) methods. The synthesized α-MnMoO4 was characterized using XRD, FTIR, and Raman spectroscopy, and FE-SEM. The electrochemical performances and cycling stability were studied and compared with the literature reports.
2. Experiment
2.1. Materials and methods
Analytical grade sodium molybdate dihydrate (Na2MoO4·2H2O), manganese chloride tetrahydrate (MnCl2·4H2O), and sodium hydroxide (NaOH) were purchased from Merck (India). Carbon black, polyvinylidene difluoride (PVdF) and N-methyl-2-pyrrolidone (NMP) were purchased from Sigma Aldrich. All chemicals were used as-received without further purification. Nickel foam (1.6 mm thickness) was purchased from MTI Corporation (China). The microwave-assisted synthesis was carried out in a microwave reaction system (SOLV Multiwave PRO, Anton Paar, Germany).
2.2. Preparation of Cp-MnMoO4 nanorods
In a typical procedure, 0.2 mol of MnCl2·4H2O and 0.2 mol of Na2MoO4·2H2O were dissolved in 160 ml of distilled water and thoroughly stirred for 1 h to form a complete precipitate. The addition of 3 M NaOH to the precipitated solution altered the pH to 7 after the solution was continuously stirred for 1 h. The precipitate was filtered and washed three times with distilled water and two times with absolute ethanol. The precipitate MnMoO4·xH2O powder was dried in an oven maintained at 60–70 °C. The powder was calcined at 500 °C for 3 h.
2.3. Preparation of MH-MnMoO4 nanorods
The above-obtained precipitate was transferred into quartz vessels that were positioned on a turntable stage, which rotates the quartz vessels to maintain uniform distribution at 180 °C for 15 min in a microwave reaction system (SOLV, Multiwave PRO Anton-Paar). The program was preset to automatically alter the applied power in order to reach a fixed temperature (180 °C) and a pressure of up to 80 bar. After the completion of the reaction, the quartz vessels in the MW hydrothermal oven were allowed to attain ambient conditions using the inbuilt rapid cooling system. The MW precipitate MnMoO4·xH2O was filtered and washed three times with distilled water and two times with absolute ethanol. Then the obtained MnMoO4·xH2O powders were dried in an oven maintained at 60–70 °C for 12 h. The powder was calcined at 500 °C for 3 h. Henceforth, the co-precipitate and microwave hydrothermal method prepared and heat treated MnMoO4 powders are denoted Cp-MnMoO4 and MH-MnMoO4, respectively.
2.4. Material characterization
The prepared powders were characterized using a Powder X-ray diffractometer (X’pert PRO MPD, PANalytical), using Cu-Kα radiation (λ = 0.15406 nm) and an angle 2 theta range from 10° to 80° in steps of 0.02. The average crystallite sizes of the prepared powders were calculated using the Scherrer formula. The structural bonding nature of the thin transparent pellets was recorded using a Thermo Nicolet Fourier Transform Infrared FTIR-6700 spectrometer between 400 and 4000 cm−1 for 30 scans. The transparent pellet was made using powders calcined at 500 °C for 3 h and pure KBr crystalline powder, ground in a ratio of 1![[thin space (1/6-em)]](https://www.rsc.org/images/entities/char_2009.gif) :
:![[thin space (1/6-em)]](https://www.rsc.org/images/entities/char_2009.gif) 20. Raman spectra were recorded in the range 100–2000 nm using a Renishaw inVia confocal Raman microscope, UK, with an argon ion laser of 785 nm line, keeping the maximum output power at 100 mW. The morphology and microstructure of the powder calcined at 500 °C for 3 h were identified using a field emission scanning electron microscope (FE-SEM, JSM-6700F, JEOL Ltd).
20. Raman spectra were recorded in the range 100–2000 nm using a Renishaw inVia confocal Raman microscope, UK, with an argon ion laser of 785 nm line, keeping the maximum output power at 100 mW. The morphology and microstructure of the powder calcined at 500 °C for 3 h were identified using a field emission scanning electron microscope (FE-SEM, JSM-6700F, JEOL Ltd).
2.5. Electrochemical characterization
The working electrode was prepared by mixing the active material α-MnMoO4 powder, carbon black as a conducting agent and polyvinylidene difluoride (PVDF) as a binder in a mass ratio of 80![[thin space (1/6-em)]](https://www.rsc.org/images/entities/char_2009.gif) :
:![[thin space (1/6-em)]](https://www.rsc.org/images/entities/char_2009.gif) 10
10![[thin space (1/6-em)]](https://www.rsc.org/images/entities/char_2009.gif) :
:![[thin space (1/6-em)]](https://www.rsc.org/images/entities/char_2009.gif) 10 to obtain a homogeneous slurry with N-methyl pyrrolidone (NMP). For the substrate electrode material prior to coating, several pieces of nickel (Ni) foam were washed with 6 M HCl solution in an ultrasonic bath for 25 min to remove the NiO layer on the surface, and it was cleaned with deionized water followed by absolute ethanol. Then the homogeneous slurry was coated and pressed onto the Ni foam and dried under vacuum at 80 °C for 24 h. A three-electrode cell that consisted of the working electrode, platinum as the counter electrode and saturated calomel electrode (SCE) as a reference electrode was used, and 2 M sodium hydroxide (2 M NaOH) was used as the electrolyte at room temperature. The electrochemical behavior of the α-MnMoO4 electrodes was characterized using cyclic voltammetry (CV), galvanostatic charge–discharge, electrochemical impedance spectroscopy (EIS) and cycling stability using a PARSTAT MC Multi-Channel Electrochemical workstation (Ametek, USA). EIS was conducted in the frequency range from 104 to 0.01 Hz with a perturbation amplitude of 10 mV at open circuit potential.
10 to obtain a homogeneous slurry with N-methyl pyrrolidone (NMP). For the substrate electrode material prior to coating, several pieces of nickel (Ni) foam were washed with 6 M HCl solution in an ultrasonic bath for 25 min to remove the NiO layer on the surface, and it was cleaned with deionized water followed by absolute ethanol. Then the homogeneous slurry was coated and pressed onto the Ni foam and dried under vacuum at 80 °C for 24 h. A three-electrode cell that consisted of the working electrode, platinum as the counter electrode and saturated calomel electrode (SCE) as a reference electrode was used, and 2 M sodium hydroxide (2 M NaOH) was used as the electrolyte at room temperature. The electrochemical behavior of the α-MnMoO4 electrodes was characterized using cyclic voltammetry (CV), galvanostatic charge–discharge, electrochemical impedance spectroscopy (EIS) and cycling stability using a PARSTAT MC Multi-Channel Electrochemical workstation (Ametek, USA). EIS was conducted in the frequency range from 104 to 0.01 Hz with a perturbation amplitude of 10 mV at open circuit potential.
3. Results and discussion
3.1. Characterization of MnMoO4
The α-MnMoO4 powders were prepared via co-precipitation (Cp) and microwave hydrothermal methods (MH) using manganese chloride tetrahydrate and sodium molybdate dihydrate as precursors. In both of the preparation methods, the manganese (Mn2+) and molybdate (MoO42−) ions react with each other, resulting in the formation of the MnMoO4·xH2O ceramic. Finally, MnMoO4·xH2O was calcined at 500 °C for 3 h to attain the phase pure α-MnMoO4 rod like nanocrystalline ceramics. The overall reaction is represented as follows:
| Na2MoO4·2H2O → 2Na+ + MoO42− |
The XRD patterns of the as-prepared MH-MnMoO4 dried at 60 °C, and the Cp-MnMoO4 and MH-MnMoO4 powders heat treated at 500 °C, are shown in Fig. 1. In Fig. 1(a), the characteristic peaks of hydrated MnMoO4·4H2O are observed, which indicates that further calcination is required to dehydrate the MnMoO4 powder. The XRD pattern is well in agreement with the standard diffraction pattern of MnMoO4·4H2O (JCPDS no. 01-078-0220).20 In Fig. 1(b and c), the XRD patterns of the Cp-MnMoO4 and MH-MnMoO4 powders heat treated at 500 °C for 3 h showed that peaks appear at 25.2, 31.2, 32.4, 38.5, 44.7 and 52.4, which are assigned to (220), (112), (022), (113), (225) and (440) planes, respectively. The diffraction peaks are well in agreement with the standard monoclinic phase α-MnMoO4 (JCPDS card no. 01-072-0285). Moreover, the presence of the major (220) reflection in the XRD spectra indicates the presence of the α-phase.19,28 The crystallite sizes of the Cp-MnMoO4 and MH-MnMoO4 powders were calculated using the Scherrer equation: t = 0.9λ/βcos![[thin space (1/6-em)]](https://www.rsc.org/images/entities/char_2009.gif) θ, where t is the average crystallite size, λ is the wavelength of the incident X-rays of Cu-Kα radiation, β is the full width half maxima of the diffraction peak and θ is the Bragg diffraction angle.29 The crystallite sizes of Cp-MnMoO4 and MH-MnMoO4 are found to be 43 nm and 26 nm, respectively.
θ, where t is the average crystallite size, λ is the wavelength of the incident X-rays of Cu-Kα radiation, β is the full width half maxima of the diffraction peak and θ is the Bragg diffraction angle.29 The crystallite sizes of Cp-MnMoO4 and MH-MnMoO4 are found to be 43 nm and 26 nm, respectively.
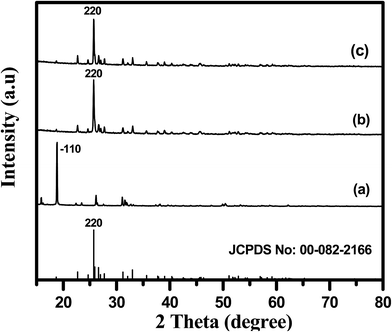 |
| | Fig. 1 XRD patterns of (a) as-prepared MH-MnMoO4 and (b and c) MH-MnMoO4 and Cp-MnMoO4 samples calcined at 500 °C for 3 h. | |
The FTIR spectra of Cp-MnMoO4 and MH-MnMoO4 powders calcined at 500 °C for 3 h are shown in Fig. 2(a and b), respectively. From Fig. 2(a and b), it is observed that the synthesized α-MnMoO4 showed four strong FTIR bands at 724, 799, 868 and 948 cm−1. The 948 cm−1 strong band corresponds to the stretching vibration of the Mo![[double bond, length as m-dash]](https://www.rsc.org/images/entities/char_e001.gif) O group. The 868 cm−1 band is attributed to the bending vibration of the Mo–O–Mo group. The bands at 724 and 799 are characteristic bands of the Mo–O stretching vibration in the tetrahedral MoO4 groups.30–32 The presence of the strong bands confirms the formation of tetrahedrally coordinated Mo on the surface of α-MnMoO4.
O group. The 868 cm−1 band is attributed to the bending vibration of the Mo–O–Mo group. The bands at 724 and 799 are characteristic bands of the Mo–O stretching vibration in the tetrahedral MoO4 groups.30–32 The presence of the strong bands confirms the formation of tetrahedrally coordinated Mo on the surface of α-MnMoO4.
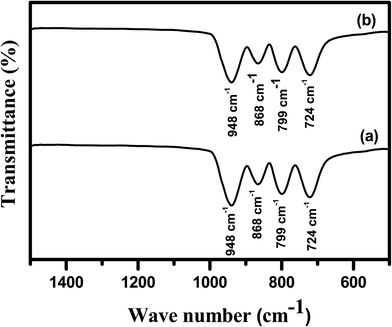 |
| | Fig. 2 FTIR spectra of the (a) Cp-MnMoO4 and (b) MH-MnMoO4 powders calcined at 500 °C for 3 h. | |
The Raman spectra of the Cp-MnMoO4 and MH-MnMoO4 powders, each as-prepared and each calcined at 500 °C for 3 h, are shown in Fig. 3(a, b, c and d), respectively. From Fig. 3(a and b), it is observed that the as-prepared Cp-MnMoO4 and MH-MnMoO4 powders exhibit a high intensity band at 926 cm−1, moderate intensity bands at 862 cm−1 and 328 cm−1, and low intensity bands at 820 cm−1, 796 cm−1 and 363 cm−1, which are the characteristic bands of MnMoO4·H2O.20 In accordance with group theory, the α-MnMoO4 ceramic has 13 Raman active modes of vibration (3Ag + 5Bg + 5Eg). From Fig. 3(c and d), it is observed that the calcined Cp-MnMoO4 and MH-MnMoO4 powders show that the bands at 944, 932 and 822 cm−1 are assigned to the Ag mode, and the bands at 883 and 343 cm−1 are assigned to the Bg (+Ag) and Ag (+Bg) modes. The band present at 402 cm−1 is assigned to the Bg mode and the bands at 372 and 279 cm−1 are assigned to the Abg (Bg) modes. The highly intense bands at 933 and 822 cm−1 are due to M(1)O(2) and M(1)O(1) symmetric stretching vibrations, respectively, and the assigned modes are in accordance with the reported data.28
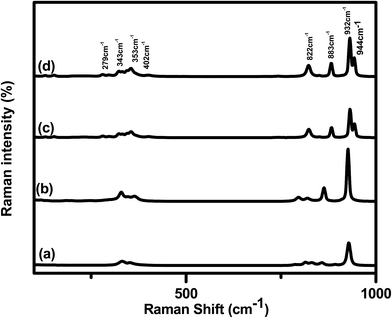 |
| | Fig. 3 Raman spectra of (a) the as-prepared Cp-MnMoO4 (b) and the as-prepared MH-MnMoO4, and (c and d) the Cp-MnMoO4 and MH-MnMoO4 samples calcined at 500 °C for 3 h. | |
Field-emission scanning electron microscope (FE-SEM) images of the Cp-MnMoO4 and MH-MnMoO4 powders are shown in Fig. 4. From Fig. 4(a and b), it is observed that the FE-SEM images of Cp-MnMoO4 reveal a smooth surface nanorod morphology, and that the nanorods are ∼200 nm in diameter and ∼1.6 μm in length. From Fig. 4(c and d), it is observed that the FE-SEM images of MH-MnMoO4 reveal that five to six nanorods of diameter 100–150 nm aligned to form tube-like morphology and the tube-like structure is about ∼600 nm in diameter and ∼1.6 μm in length. In order to study the chemical composition, elemental analysis was performed using energy-dispersive spectrometry (EDS). The EDS spectra showed the presence of Mn, Mo and O. The atomic percentage composition of Mn, Mo and O of the nanorods clearly confirmed that the Mn, Mo and O atomic ratio of 1![[thin space (1/6-em)]](https://www.rsc.org/images/entities/char_2009.gif) :
:![[thin space (1/6-em)]](https://www.rsc.org/images/entities/char_2009.gif) 1
1![[thin space (1/6-em)]](https://www.rsc.org/images/entities/char_2009.gif) :
:![[thin space (1/6-em)]](https://www.rsc.org/images/entities/char_2009.gif) 4 was present in the aggregated nanorods forming the tube-like morphology, as shown in Fig. 5. Furthermore, to study the elemental distribution of the MH-MnMoO4 sample, elemental mapping was carried out and the mapping of the surface showed a uniform distribution of Mn, Mo and O, as shown in Fig. 6. The uniform distribution of these elements would most likely facilitate the formation of pure MnMoO4. The aggregated nanorods forming a tube-like morphology make an easy path for the transport of ions, resulting in enhanced electrochemical performance.
4 was present in the aggregated nanorods forming the tube-like morphology, as shown in Fig. 5. Furthermore, to study the elemental distribution of the MH-MnMoO4 sample, elemental mapping was carried out and the mapping of the surface showed a uniform distribution of Mn, Mo and O, as shown in Fig. 6. The uniform distribution of these elements would most likely facilitate the formation of pure MnMoO4. The aggregated nanorods forming a tube-like morphology make an easy path for the transport of ions, resulting in enhanced electrochemical performance.
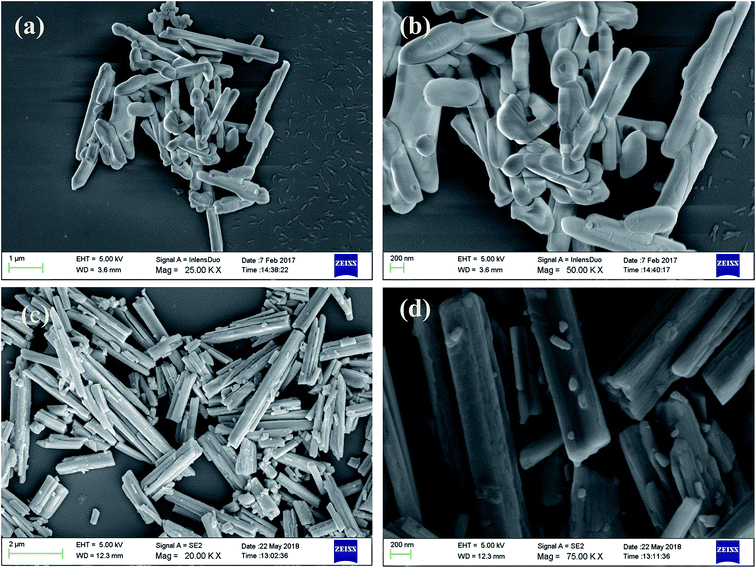 |
| | Fig. 4 FE-SEM images of (a and b) Cp-MnMoO4 and (c and d) MH-MnMoO4 powders calcined at 500 °C for 3 h. | |
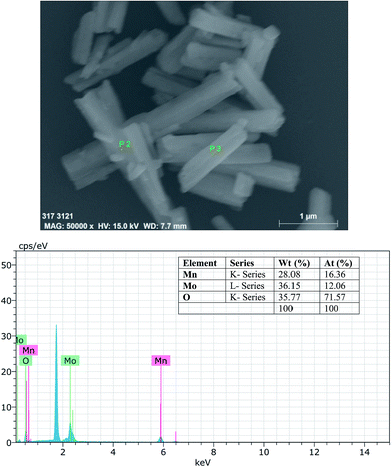 |
| | Fig. 5 EDS spectra of MH-MnMoO4 powders calcined at 500 °C for 3 h. | |
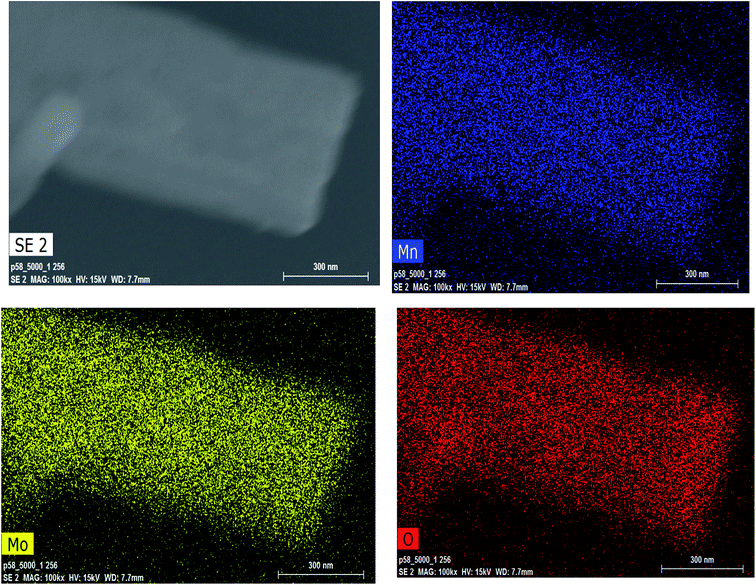 |
| | Fig. 6 SEM-EDS elemental mapping of Mn, Mo and O for MH-MnMoO4 powders calcined at 500 °C for 3 h. | |
3.2. Electrochemical studies
The cyclic voltammetric (CV) curves of the Cp-MnMoO4 and MH-MnMoO4 nanorod electrodes at various scan rates from 10 to 100 mV s−1 using 2 M NaOH as the electrolyte in the potential range of 0–0.6 V are shown in Fig. 7(a and b). In Fig. 7(a and b), the CV curves show the presence of a redox peak, which is attributed to the transition of Mn(2+)/Mn(3+).18 The anodic peak at around 0.3 V corresponds to the oxidation process of Mn2+ to Mn3+. The cathodic peak at around 0.15 V refers to the reduction process of Mn3+ to Mn2+. At different scan rates, 10–100 mV s−1, the shapes of the CV curves do not change, but the CV curve peak positions widely shift. The anodic peaks gradually move to higher potentials, whereas the cathodic peaks shift to lower potentials in the opposite direction. As a result, it is identified that at higher scan rates, the electronic and ionic movements are rapid and a fast redox reaction occurs at the interface of electroactive material/electrolyte.33,34 In addition, during the CV analysis, molybdate (Mo) ions do not participate in the redox process, but they promote the electrical conductivity at ambient temperature.18 Using the CV data and galvanostatic charge/discharge data in eqn (1) and (2), respectively, the specific capacitances are calculated for the Cp-MnMoO4 and MH-MnMoO4 nanorod electrodes.| |
 | (1) |
| |
 | (2) |
where Cs is the specific capacitance, Q is the average charge of the electrode (Coulomb), ΔV is the potential window, m (g) is the loaded mass of the active material, I (A) is the discharge current and Δt (s) is the discharge time.35,36
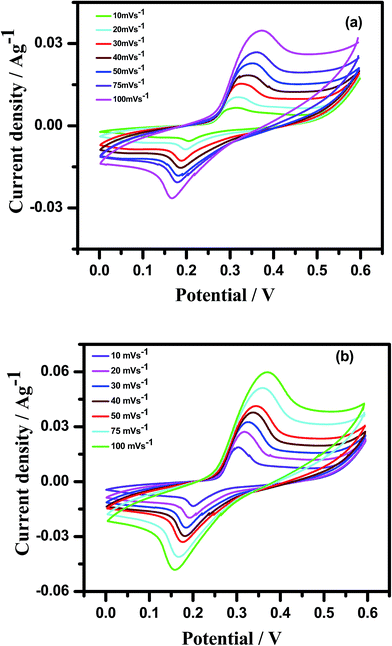 |
| | Fig. 7 Cyclic voltammetric curves of (a) Cp-MnMoO4 and (b) MH-MnMoO4 in 2 M NaOH electrolyte at different scan rates. | |
The Cp-MnMoO4 and MH-MnMoO4 nanorod electrodes demonstrated that the specific capacitance decreases as the scan rate increases, which is consistent with the literature reports, as shown in Fig. 8. The calculated Cs values for the Cp-MnMoO4 nanorods are 281, 181, 119, 94, 92, 85, and 65 F g−1 at scan rates of 10, 20, 30, 40, 50, 75 and 100 mV s−1, respectively. On the other hand, the MH-MnMoO4 nanorod electrodes reveal significantly enhanced Cs values of 689, 469, 389, 349, 328, 228 and 259 F g−1 at scan rates of 10, 20, 30, 40, 50, 75 and 100 mV s−1, respectively. From Fig. 8, it is observed that the calculated specific capacitance decreases from 281 to 65 F g−1 and 689 to 259 F g−1 as the scan rate increases for the Cp-MnMoO4 and MH-MnMoO4 nanorod electrodes. The decrease in Cs may be due to the faster mobility of the electrolyte ions at higher scan rates, and as a result the ions are not able to utilize the active material completely.37 Moreover, the nanorods prepared via the MH method show a significantly higher Cs, which may be due to their aspect ratio and the easy interaction mobility of the electrolyte ions. From Fig. 8, it is observed that the literature report samples have lower specific capacitances than the samples in the present work prepared via the MH method, which showed higher specific capacitances.
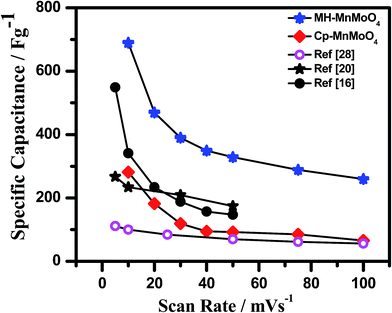 |
| | Fig. 8 Comparison of specific capacitances of Cp-MnMoO4 and MH-MnMoO4 calculated from CV curves with other reported results. | |
The galvanostatic charge–discharge curves at different current densities with a potential window between 0 and 0.45 V for Cp-MnMoO4 and MH-MnMoO4 nanorod electrodes are shown in Fig. 9(a and b). From Fig. 9(a and b), it is observed that the quasi-symmetric charge–discharge profile suggests that the pseudocapacitive behavior of the material and the specific capacitances were calculated using eqn (2). Fig. 10 shows the decrease in specific capacitance values of 142, 99, 76, 59 and 51 F g−1 with respect to the different discharge current densities of 1, 2, 3, 4, and 5 A g−1, respectively, for Cp-MnMoO4. On the other hand, the powder prepared via the MH method, resulting in fine nanorods, demonstrates specific capacitance values of 551, 389, 326, 289, and 253 F g−1 at the current densities of 1, 2, 3, 4 and 5 A g−1, respectively, which are higher than the those in the compared literature reports.18,39,40 From Fig. 10, it is observed that an increase in the current density decreases the capacitance value, which may be because of a decrease in the diffusion ions in the inner active sites of the electrode material.38 The increase in the specific capacitance value of 551 F g−1 at a current density of 1 A g−1 may be because of the one-dimensional morphological structure. The well-defined nanorods enable the surface of the nanorods to be effectively accessible to the electrolyte and allow faster mobility of the electrons in the electrode. As a result, an improved high specific capacitance and enhanced electrochemical kinetics at high current densities are obtained for the nanorods. From Fig. 10, it is observed that the present MnMoO4 prepared via the MH method showed higher specific capacitance than that of the MnMoO4 samples reported in the literature. Table 1 compares the specific capacitances measured at different scan rates and current densities for the MnMoO4 electrodes prepared via various synthesis methods. From Table 1, it is noted that the MH-MnMoO4 electrode shows high specific capacitance as compared with the electrodes from the literature reports, such as MnMoO4 (200 F g−1 at 1.6 A g−1),39 the MnMoO4 (9.7 F g−1 at 1 A g−1) and MnMoO4/CoMoO4 nanocomposite (187.1 F g−1 at 1 A g−1),18 and the MnMoO4/PPy nanocomposite (462.9 F g−1 at 5 mV s−1).40
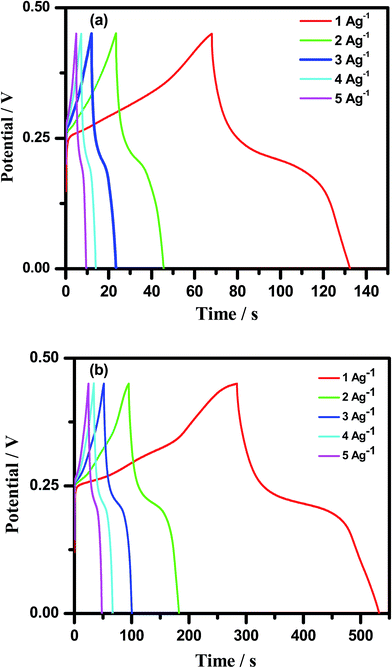 |
| | Fig. 9 Galvanostatic charge–discharge curves of (a) Cp-MnMoO4 and (b) MH-MnMoO4 with different discharge current densities in 2 M NaOH. | |
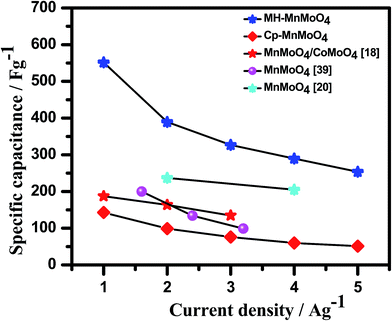 |
| | Fig. 10 Comparison of the specific capacitances of Cp-MnMoO4 and MH-MnMoO4 calculated from GCD analysis with the literature reports. | |
Table 1 Comparison of the specific capacitances of Cp-MnMoO4 and MH-MnMoO4 nanorod electrodes with the literature reports for supercapacitor applications
| S. no. |
Material |
Method |
Specific capacitance (F g−1) |
Scan rate mV s−1 (or) current density (A g−1) |
Ref. |
| 1 |
MnMoO4 |
Co-precipitation |
281 F g−1, 142 F g−1 |
10 mV s−1, 1 A g−1 |
Present work |
| 2 |
MnMoO4 |
Microwave hydrothermal method |
689 F g−1, 551 F g−1 |
10 mV s−1, 1 A g−1 |
Present work |
| 3 |
MnMoO4 |
Precipitation technique |
200 F g−1 |
1.6 A g−1 |
39 |
| 4 |
MnMoO4/graphene |
Hydrothermal method |
364 F g−1 |
2 A g−1 |
20 |
| 5 |
MnMoO4 |
Micro-emulsion method |
9.7 F g−1, 187 F g−1 |
1 A g−1, 1 A g−1 |
18 |
| MnMoO4/CoMoO4 |
| 6 |
MnMoO4 nanoparticles |
Simple method |
371 F g−1, 469 F g−1 |
1 A g−1, 1 A g−1 |
21 |
| MnMoO4 nanorods |
| 7 |
MnMoO4/PPy |
In situ oxidative polymerization |
462.9 F g−1, 374.8 F g−1 |
5 mV s−1, 0.2 A g−1 |
40 |
| 8 |
MnMoO4 |
Hydrothermal method |
234 F g−1 |
10 mV s−1 |
18 |
| 9 |
Amorphized MnMoO4 |
Hydrothermal method |
373 F g−1 |
5 mV s−1 |
25 |
| 10 |
MnMoO4·H2O |
Hydrothermal method |
549 F g−1 |
5 mV s−1 |
19 |
| 11 |
MnMoO4/polyaniline |
In situ oxidative polymerization |
396 F g−1 |
5 mV s−1 |
23 |
The cycling stability study of the Cp-MnMoO4 and MH-MnMoO4 nanorod electrodes was carried out using galvanostatic charge–discharge measurements at a constant current density of 5 A g−1 for 1000 cycles. The specific capacitance and the capacitance retention with respect to the number of cycles are shown in Fig. 11, and the inset figure shows the first ten charge–discharge cycles of MH-MnMoO4. From Fig. 11, it is observed that about 89% of the initial capacitance was retained even after 1000 cycles at a high current density, which demonstrates the good cycling stability of the MH-MnMoO4 nanorods that aggregated to form a tube-like morphology electrode at a high current density. A small increase in the charge transfer resistance that is observed for the Cp-MnMoO4 electrode reveals 87.6% capacitance retention after 1000 cycles.
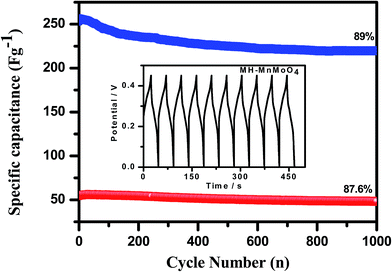 |
| | Fig. 11 Cycling performance of the Cp-MnMoO4 and MH-MnMoO4 electrodes at a current density of 5 A g−1 (the inset figure shows the first ten galvanostatic charge–discharge profiles of the MH-MnMoO4 electrode at 5 A g−1). | |
The galvanostatic charge–discharge measurements were carried out at different current densities of 1, 2, 3, 4 and 5 A g−1 for 100 cycles, as shown in Fig. 12. From Fig. 12 it is observed that the MH-MnMoO4 nanorods that aggregated to form a tube-like morphology electrode material exhibit high reversible capacity, high capacitance retention performance and excellent cycling stability as the cycling current varies from low (1 A g−1) to high (5 A g−1) current with changes every 10 cycles, and reverses back to a low current of 1 A g−1. Thus, the high rate performance and good reversible capacity retention at different current densities demonstrate the structural stability of the calcined MH-MnMoO4 nanorods, which are capable of delivering the required high energy at various load levels and are confirmed to be a promising electrode material for supercapacitor applications.41
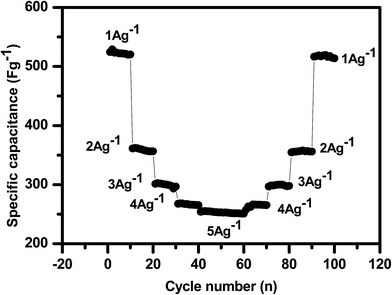 |
| | Fig. 12 Cycling stability test of the MH-MnMoO4 electrode at various current densities for 100 cycles. | |
Electrochemical impedance spectroscopy (EIS) of the Cp-MnMoO4 and MH-MnMoO4 electrodes was performed at open circuit potential with a frequency range from 10 kHz to 0.01 Hz after the 1st and 1000th cycles at a current density of 5 A g−1. The EIS spectra of the Cp-MnMoO4 and MH-MnMoO4 electrodes after the 1st and 1000th cycle are shown in Fig. 13(a and b). From Fig. 13(a and b), the presence of a semi-circle at the higher frequency range is observed, which is due to the capacitance in parallel with the ionic charge transfer resistance. The presence of a linear part in the low-frequency region, called the Warburg resistance (Zw), is also observed, which is due to the frequency dependent ion diffusion or transport in the electrolyte to the electrode surface.36 From Fig. 13(a and b), it is noted that the slight increase in the radius of the depressed semi-circle in the high-frequency region after the 1000th cycle compared to the 1st cycle reveals the small decrease in the interfacial charge transfer conductivity of the Cp-MnMoO4 and MH-MnMoO4 electrodes. In the low-frequency region, the Warburg resistance slightly increased after 1000 cycles and the slope was not altered, which suggests that the mobility of the ions from the electrolyte to the electrode surface was not relatively altered. The internal drop in the specific capacitance can be attributed to the slight decrease in the interfacial charge transfer conductivity, which causes a decrease in the retention from the initial capacitance for Cp-MnMoO4 (87.6%) and MH-MnMoO4 (89%) during the cycling performance.
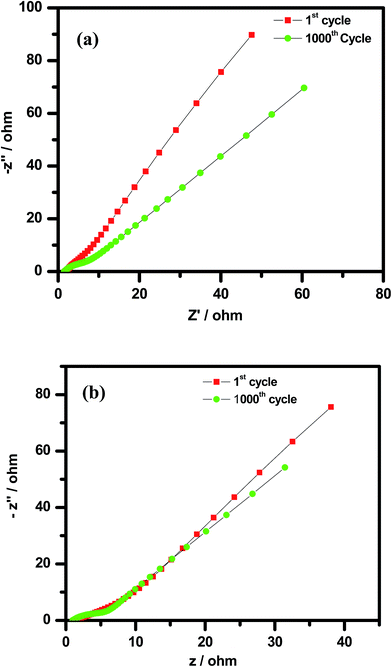 |
| | Fig. 13 Electrochemical impedance spectra of the (a) Cp-MnMoO4 and (b) MH-MnMoO4 electrodes after the 1st and 1000th galvanostatic charge–discharge cycles at a current density of 5 A g−1. | |
The variation of energy density as a function of power density for the Cp-MnMoO4 and MH-MnMoO4 electrodes is shown in Fig. 14. The energy density and power density were derived from the charge/discharge curves at various current densities and these can be calculated from the following equations.34
| |
 | (3) |
| |
 | (4) |
where
P is the power density (W kg
−1),
E is the energy density (W h kg
−1),
Cs is the specific capacitance based on the mass of the electroactive material (F g
−1),
Q is the total charge delivered (C), Δ
V is the potential window of discharge (V), and
T is the discharge time (s). From
Fig. 14, it is observed that the energy density decreases with an increase in power density. The maximum energy density obtained for the Cp-MnMoO
4 and MH-MnMoO
4 electrodes is 4.01 and 15.5 W h kg
−1 at the power density of 224.8 and 224.9 W kg
−1, respectively. The high energy density without any significant loss of power density demonstrated that the MH-MnMoO
4 nanorods that aggregated to form a tube-like morphology electrode could vitally be considered as an efficient supercapacitor electrode material.
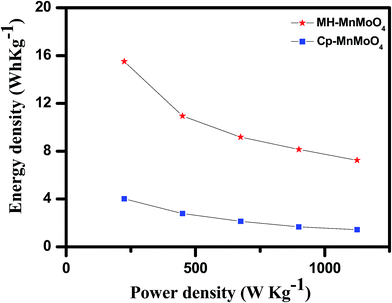 |
| | Fig. 14 Ragone plots (power density vs. energy density) of the Cp-MnMoO4 and MH-MnMoO4 electrodes. | |
4. Conclusion
One dimensional α-MnMoO4 nanorods have been successfully synthesized via co-precipitation, and the nanorods aggregated to form a tube-like morphology via a microwave hydrothermal method. The MH-MnMoO4 electrode exhibited a maximum specific capacitance value of 551 F g−1 at a current density of 1 A g−1, compared with the Cp-MnMoO4 nanorod electrode. The cycling stability revealed a good reversibility with a cycling efficiency of 89% after 1000 cycles at 5 A g−1. The high rate performances and good reversible capacity retention at different current densities demonstrated the structural stability of the calcined MH-MnMoO4. Thus, the facile microwave hydrothermal approach to synthesise α-MnMoO4 nanorods that aggregated to form a tube-like morphology is a valuable method to obtain promising electrodes with high energy density and without significant loss of power density for high electrochemical performance supercapacitors.
Conflicts of interest
There are no conflicts to declare.
Acknowledgements
The authors are grateful to PFRC and BRNS, DAE, Govt., of India, for the financial assistance through Research Projects, and the authors are also grateful to FCIPT, IPR for supporting the SEM facility.
References
- X. Peng, L. Peng, C. Wu and Y. Xie, Chem. Soc. Rev., 2014, 43, 3303 RSC.
- Y. Shao, M. F. El-Kady, L. J. Wang, Q. Zhang, Y. Li, H. Wang, M. F. Mousavi and R. B. Kaner, Chem. Soc. Rev., 2015, 44, 3639 RSC.
- H. Wang, Y. Yang, Y. Liang, J. T. Robinson, Y. Li, A. Jackson, Y. Cui and H. Dai, Nano Lett., 2011, 11, 2644 CrossRef PubMed.
- Q. Zhang, Y. Deng, Z. Hu, Y. Liu, M. Yao and P. Liu, Phys. Chem. Chem. Phys., 2014, 16, 23451 RSC.
- D. S. Patil, J. S. Shaikh, D. S. Dalavi, S. S. Kalagi and P. S. Patil, Mater. Chem. Phys., 2011, 128, 449 CrossRef.
- K. Chen and D. Xue, Chem. Rec., 2018, 18, 282 CrossRef PubMed.
- K. Chen and D. Xue, Nanotechnology, 2018, 29, 024003 CrossRef PubMed.
- K. Chen, F. Liu, X. Liang and D. Xue, Surf. Rev. Lett., 2017, 24(03), 1730005 CrossRef.
- K. Chen and D. Xue, Mater. Res. Bull., 2017, 96, 281 CrossRef.
- K. Chen and D. Xue, Mater. Res. Bull., 2016, 83, 201 CrossRef.
- K. Chen, G. Li and D. Xue, Funct. Mater. Lett., 2016, 9, 1640001 CrossRef.
- K. Chen and D. Xue, Sci. China: Technol. Sci., 2015, 58, 1768 Search PubMed.
- K. Chen, S. Song, F. Liu and D. Xue, Chem. Soc. Rev., 2015, 44, 6230 RSC.
- Z. Yin, S. Zhang, Y. Chen, P. Gao, C. Zhu, P. Yang and L. Qia, J. Mater. Chem. A, 2015, 3(2015), 739 RSC.
- G. K. Veerasubramani, K. Krishnamoorthy and S. J. Kim, RSC Adv., 2015, 5, 16319 RSC.
- Y. Cao, W. Li, K. Xu, Y. Zhang, T. Ji, R. Zou, J. Yang, Z. Qin and J. Hu, J. Mater. Chem. A, 2014, 2, 20723 RSC.
- S. S. Kim, S. Ogura, H. Ikuta, Y. Uchimoto and M. Wakihara, Chem. Lett., 2001, 8, 760 CrossRef.
- L. Q. Mai, F. Yang, Y. L. Zhao, X. Xu, L. Xu and Y. Z. Luo, Nat. Commun., 2011, 2, 381 CrossRef PubMed.
- X. Yan, L. Tian, J. Murowchick and X. Chen, J. Mater. Chem. A, 2016, 4, 3683 RSC.
- D. Ghosh, S. Giri, Md. Moniruzzaman, T. Basu, M. Mandala and C. K. Das, Dalton Trans., 2014, 43, 11067 RSC.
- L. Wang, L. Yue, X. Zang, H. Zhu, X. Hao, Z. Leng, X. Liu and S. Chen, CrystEngComm, 2016, 18, 9286 RSC.
- B. Senthilkumar, K. Vijaya Sankar, R. Kalai Selvan, M. Danielle and M. Manickam, RSC Adv., 2013, 3, 352 RSC.
- J. Yesuraj, V. Elumalai, M. Bhagavathiachari, A. S. Samuel, E. Elaiyappillai and P. M. Johnson, J. Electroanal. Chem., 2017, 797, 78 CrossRef.
- K. Chen, Y. D. Noh, R. R. Patel and D. Xue, Ceram. Int., 2014, 40, 8183 CrossRef.
- K. Chen, Y. D. Noh, W. Huang and D. Xue, Ceram. Int., 2014, 40, 2877 CrossRef.
- K. Chen, Y. D. Noh, A. C. Donahoe and D. Xue, Ceram. Int., 2014, 40, 3155 CrossRef.
- K. Chen, Y. D. Noh, K. Li, S. Komarneni and D. Xue, J. Phys. Chem. C, 2013, 117, 10770 CrossRef.
- G. Veerasubramani, K. Krishnamoorthy, R. Sivaprakasam and S. J. Kim, Mater. Chem. Phys., 2014, 147, 836 CrossRef.
- A. Mirmohsenia, M. S. Seyed Dorrajia and M. G. Hosseinib, Electrochim. Acta, 2012, 70, 182 CrossRef.
- S. J. Lei, K. B. Tang, Q. C. Liu, Z. Fang, Q. Yang and H. G. Zheng, J. Mater. Sci., 2006, 41, 473 CrossRef.
- T. S. Sian and G. B. Reddy, Appl. Surf. Sci., 2004, 236, 1 CrossRef.
- L. Seguin, M. Figlarz, R. Cavagnat and J.-C. Lasskgues, Spectrochim. Acta, Part A, 1995, 51, 1323 CrossRef.
- D. Cai, B. Liu, D. Wang, Y. Liu, L. Wang, H. Li, Y. Wang, C. Wang, Q. Li and T. Wang, Electrochim. Acta, 2014, 125, 294 CrossRef.
- I. Shakir, M. Shahid, H. W. Yang and D. J. Kang, Electrochim. Acta, 2010, 56, 376 CrossRef.
- P. Vinothbabu and P. Elumalai, RSC Adv., 2014, 4, 31219 RSC.
- K. Liu, Z. Hu, R. Xue, J. Zhang and J. Zhu, J. Power Sources, 2008, 179, 858 CrossRef.
- S. Saranya, R. K. Selvan and N. Priyadharsini, Appl. Surf. Sci., 2012, 258, 4881 CrossRef.
- P. Justin and G. R. Rao, Int. J. Hydrogen Energy, 2010, 35, 9709 CrossRef.
- B. Senthilkumar, R. Kalai Selvan, D. Meyrick and M. Minakshi, Int. J. Electrochem. Sci., 2015, 10, 185 Search PubMed.
- H. Wang, Y. Song, J. Zhou, X. Xu, W. Hong, J. Yan, R. Xue, H. Zhao, Y. Liu and J. Gao, Electrochim. Acta, 2016, 212, 775 CrossRef.
- S. Devaraj, H. Y. Liu and P. Balaya, J. Mater. Chem. A, 2014, 2, 4276 RSC.
|
| This journal is © The Royal Society of Chemistry 2018 |
Click here to see how this site uses Cookies. View our privacy policy here.  Open Access Article
 *b
*b
![[double bond, length as m-dash]](https://www.rsc.org/images/entities/char_e001.gif) O. Raman spectra showed the structural bonding and crystalline nature of α-MnMoO4. Field Emission Scanning Electron Microscope (FE-SEM) images exposed the nanorod shape of the α-MnMoO4 powder, with diameters of ∼200 nm and lengths of ∼1.6 μm. Electrochemical studies of the Cp- and MH-MnMoO4 nanorods with 2 M NaOH as the electrolyte showed specific capacitances of 143 F g−1 and 551 F g−1, respectively, at a 1 A g−1 constant discharge current density. Cyclic voltammetric (CV) studies of the MH-MnMoO4 nanorods at various scan rates revealed the presence of redox pairs, suggesting a pseudocapacitive nature. The structural stability at different current densities demonstrated the high rate performances and good reversible capacity retention of the calcined MH-MnMoO4 nanorods. A cycling life stability study of MH-MnMoO4 demonstrated a good capacity retention of 89% of the initial specific capacitance at 5 A g−1 after 1000 cycles.
O. Raman spectra showed the structural bonding and crystalline nature of α-MnMoO4. Field Emission Scanning Electron Microscope (FE-SEM) images exposed the nanorod shape of the α-MnMoO4 powder, with diameters of ∼200 nm and lengths of ∼1.6 μm. Electrochemical studies of the Cp- and MH-MnMoO4 nanorods with 2 M NaOH as the electrolyte showed specific capacitances of 143 F g−1 and 551 F g−1, respectively, at a 1 A g−1 constant discharge current density. Cyclic voltammetric (CV) studies of the MH-MnMoO4 nanorods at various scan rates revealed the presence of redox pairs, suggesting a pseudocapacitive nature. The structural stability at different current densities demonstrated the high rate performances and good reversible capacity retention of the calcined MH-MnMoO4 nanorods. A cycling life stability study of MH-MnMoO4 demonstrated a good capacity retention of 89% of the initial specific capacitance at 5 A g−1 after 1000 cycles.![[thin space (1/6-em)]](https://www.rsc.org/images/entities/char_2009.gif) :
:![[thin space (1/6-em)]](https://www.rsc.org/images/entities/char_2009.gif) 20. Raman spectra were recorded in the range 100–2000 nm using a Renishaw inVia confocal Raman microscope, UK, with an argon ion laser of 785 nm line, keeping the maximum output power at 100 mW. The morphology and microstructure of the powder calcined at 500 °C for 3 h were identified using a field emission scanning electron microscope (FE-SEM, JSM-6700F, JEOL Ltd).
20. Raman spectra were recorded in the range 100–2000 nm using a Renishaw inVia confocal Raman microscope, UK, with an argon ion laser of 785 nm line, keeping the maximum output power at 100 mW. The morphology and microstructure of the powder calcined at 500 °C for 3 h were identified using a field emission scanning electron microscope (FE-SEM, JSM-6700F, JEOL Ltd).
![[thin space (1/6-em)]](https://www.rsc.org/images/entities/char_2009.gif) :
:![[thin space (1/6-em)]](https://www.rsc.org/images/entities/char_2009.gif) 10
10![[thin space (1/6-em)]](https://www.rsc.org/images/entities/char_2009.gif) :
:![[thin space (1/6-em)]](https://www.rsc.org/images/entities/char_2009.gif) 10 to obtain a homogeneous slurry with N-methyl pyrrolidone (NMP). For the substrate electrode material prior to coating, several pieces of nickel (Ni) foam were washed with 6 M HCl solution in an ultrasonic bath for 25 min to remove the NiO layer on the surface, and it was cleaned with deionized water followed by absolute ethanol. Then the homogeneous slurry was coated and pressed onto the Ni foam and dried under vacuum at 80 °C for 24 h. A three-electrode cell that consisted of the working electrode, platinum as the counter electrode and saturated calomel electrode (SCE) as a reference electrode was used, and 2 M sodium hydroxide (2 M NaOH) was used as the electrolyte at room temperature. The electrochemical behavior of the α-MnMoO4 electrodes was characterized using cyclic voltammetry (CV), galvanostatic charge–discharge, electrochemical impedance spectroscopy (EIS) and cycling stability using a PARSTAT MC Multi-Channel Electrochemical workstation (Ametek, USA). EIS was conducted in the frequency range from 104 to 0.01 Hz with a perturbation amplitude of 10 mV at open circuit potential.
10 to obtain a homogeneous slurry with N-methyl pyrrolidone (NMP). For the substrate electrode material prior to coating, several pieces of nickel (Ni) foam were washed with 6 M HCl solution in an ultrasonic bath for 25 min to remove the NiO layer on the surface, and it was cleaned with deionized water followed by absolute ethanol. Then the homogeneous slurry was coated and pressed onto the Ni foam and dried under vacuum at 80 °C for 24 h. A three-electrode cell that consisted of the working electrode, platinum as the counter electrode and saturated calomel electrode (SCE) as a reference electrode was used, and 2 M sodium hydroxide (2 M NaOH) was used as the electrolyte at room temperature. The electrochemical behavior of the α-MnMoO4 electrodes was characterized using cyclic voltammetry (CV), galvanostatic charge–discharge, electrochemical impedance spectroscopy (EIS) and cycling stability using a PARSTAT MC Multi-Channel Electrochemical workstation (Ametek, USA). EIS was conducted in the frequency range from 104 to 0.01 Hz with a perturbation amplitude of 10 mV at open circuit potential.
![[thin space (1/6-em)]](https://www.rsc.org/images/entities/char_2009.gif) θ, where t is the average crystallite size, λ is the wavelength of the incident X-rays of Cu-Kα radiation, β is the full width half maxima of the diffraction peak and θ is the Bragg diffraction angle.29 The crystallite sizes of Cp-MnMoO4 and MH-MnMoO4 are found to be 43 nm and 26 nm, respectively.
θ, where t is the average crystallite size, λ is the wavelength of the incident X-rays of Cu-Kα radiation, β is the full width half maxima of the diffraction peak and θ is the Bragg diffraction angle.29 The crystallite sizes of Cp-MnMoO4 and MH-MnMoO4 are found to be 43 nm and 26 nm, respectively.
![[double bond, length as m-dash]](https://www.rsc.org/images/entities/char_e001.gif) O group. The 868 cm−1 band is attributed to the bending vibration of the Mo–O–Mo group. The bands at 724 and 799 are characteristic bands of the Mo–O stretching vibration in the tetrahedral MoO4 groups.30–32 The presence of the strong bands confirms the formation of tetrahedrally coordinated Mo on the surface of α-MnMoO4.
O group. The 868 cm−1 band is attributed to the bending vibration of the Mo–O–Mo group. The bands at 724 and 799 are characteristic bands of the Mo–O stretching vibration in the tetrahedral MoO4 groups.30–32 The presence of the strong bands confirms the formation of tetrahedrally coordinated Mo on the surface of α-MnMoO4.
![[thin space (1/6-em)]](https://www.rsc.org/images/entities/char_2009.gif) :
:![[thin space (1/6-em)]](https://www.rsc.org/images/entities/char_2009.gif) 1
1![[thin space (1/6-em)]](https://www.rsc.org/images/entities/char_2009.gif) :
:![[thin space (1/6-em)]](https://www.rsc.org/images/entities/char_2009.gif) 4 was present in the aggregated nanorods forming the tube-like morphology, as shown in Fig. 5. Furthermore, to study the elemental distribution of the MH-MnMoO4 sample, elemental mapping was carried out and the mapping of the surface showed a uniform distribution of Mn, Mo and O, as shown in Fig. 6. The uniform distribution of these elements would most likely facilitate the formation of pure MnMoO4. The aggregated nanorods forming a tube-like morphology make an easy path for the transport of ions, resulting in enhanced electrochemical performance.
4 was present in the aggregated nanorods forming the tube-like morphology, as shown in Fig. 5. Furthermore, to study the elemental distribution of the MH-MnMoO4 sample, elemental mapping was carried out and the mapping of the surface showed a uniform distribution of Mn, Mo and O, as shown in Fig. 6. The uniform distribution of these elements would most likely facilitate the formation of pure MnMoO4. The aggregated nanorods forming a tube-like morphology make an easy path for the transport of ions, resulting in enhanced electrochemical performance.


