 Open Access Article
Synthesis of surfactant free stable nanofluids based on barium hexaferrite by pulsed laser ablation in liquid
Archana V. N.ab,
Jacob Johnyb,
Marco A. Garza-Navarrob,
S. Shaji b,
Senoy Thomasa and
Anantharaman M. R.
 *ac
*ac
aDepartment of Physics, Cochin University of Science and Technology, Cochin 682022, India. E-mail: mraiyer@gmail.com
bFacultad de Ingeniería Mecánica y Eléctrica, Universidad Autónoma de Nuevo León, Av. Pedro de Alba s/n, Ciudad Universitaria, San Nicolás de Los Garza, Nuevo León 66455, Mexico
cInter University Centre for Nanomaterials and Devices (IUCND), Cochin University of Science and Technology, Cochin 682022, India
First published on 24th May 2018
Abstract
Barium hexaferrite nanofluids based on five different solvents have been prepared by employing Pulsed Laser Ablation in Liquid (PLAL) at two different wavelengths of 532 nm and 1064 nm. They were then characterized using Transmission Electron Microscopy (TEM), Scanning Electron Microscopy (SEM), X-ray Photoelectron Spectroscopy (XPS), UV-Vis spectroscopy, and Vibrating Sample Magnetometry (VSM). The chemical states of the ablated nanoparticles were identified from XPS analysis and found to be matching with that of the target. The crystallinity of the nanoparticles were confirmed from high resolution TEM (HRTEM) images and SAED patterns. It is found that different liquid environments lead to the formation of barium ferrite nanoparticles with different particle diameters. The plausible mechanism involved in this process is discussed. This study can pave way for the synthesis of stable magnetic nanofluids of permanent magnets. Further, this technique could be utilized for tailoring the morphology of nanoparticles with a judicious choice of the solvents and other ablation parameters.
1. Introduction
Nanofluids are important technological materials and are hotly pursued by scientists and engineers because of their potential applications in the field of engineering and biomedicine. Magnetic nanofluids (ferrofluids) are synthesized by dispersing surfactant coated nanoparticles having a critical diameter in both aqueous and non aqueous media like kerosene and ethylene glycol. Hydrocarbon based magnetic fluids find applications in coolants, sealants and in rotating X-ray tubes and rotary vacuum feedthroughs.1 Whereas biocompatible ferrofluids based on aqueous media is used for biomedical applications like drug targeting, drug delivery, contrast enhancement in MRI imaging and also for cancer treatment using the principle of magnetic hyperthermia. At present these ferrofluids are prepared with the aid of a surfactant like citric acid or oleic acid to prevent clumping.2 However surfactant free synthesis of nanofluids possess a challenge and an important area of research.Pulsed Laser Ablation in Liquid (PLAL) is one of the efficient methods for the preparation of surfactant free stable nanofluids. Though the technique of Pulsed Laser Deposition (PLD) for the fabrication of thin film is in vogue from early 1970's, the technique of PLAL is rather new and novel. PLAL refers to the ablation of solids in liquids. It makes use of room temperature synthesis and the diverse options in selecting solvents as well as target materials make PLAL unique and advantageous. It is a contamination free technique unlike conventional chemical methods where surfactants, catalysts, byproducts and ions are involved. No further purification is needed in this technique after the synthesis of nanoparticles.3 Hence PLAL can be adopted for synthesizing stable nanofluids and is a one step process.
The three stages of pulsed laser ablation in liquid are plasma phase, gas phase/cavitation bubble phase and phase in which particles are dispersed and interact (or react) with liquid molecules after bubble collapse.4,5 The interaction/reaction with the molecules from the solvent can start inside the vapour bubble.6,7 The macroscopic target and the formed plasma, atoms and clusters make PLAL a physicochemical combined top down and bottom up method.5 Compared to ablation in vacuum, the quenching time is much shorter in liquid.8 Barcikowski et al. reported a lower ablation rate in a liquid environment.9 Nanoparticles formed by PLAL maintain the same composition as that of the target and is one of the most important feature of this technique. The possibility of tuning the nanoparticle morphology is yet another added advantage of this technique.
Hard magnetic materials are known for their excellent magnetic properties namely high saturation magnetization, high coercive force, high Curie temperature and chemical inertness. Barium hexaferrite belongs to M type hexagonal ferrite where M can be Ba, Sr or Pb.10 They are characterized by their high BHmax product and employed in permanent magnets and electric motors.11 Barium hexaferrite (BAF) is a hard magnetic material and have been in the focus of research as a material for high energy applications and also as a core magnetic memory element in the past.12 Recently barium hexaferrite is also viewed as a potential candidate for perpendicular magnetic recording.13
The final size of dispersed nanoparticles in the medium are dependent on various parameters such as laser wavelength, polarity of liquid medium and the evolution, expansion, and collapse time of plasma plume.14 Tuning of laser parameters can control the size and shape of nanoparticles formed.4 Laser wavelength, fluence, irradiation time and surfactants can affect the size and shape of ablated nanoparticles.5 The thermodynamic and optical properties of liquid medium also determine the different parameters of plasma and cavitation bubble.15 The pressure and temperature of plasma plume and the decay process of its temperature and pressure are also influenced by the different properties of the solvent used.16
Solvent properties such as viscosity, refractive index and dipole moment play an important role in the life time of cavitation bubble which in turn affects the morphology of nanoparticles.17,18 High specific heat of solvent induces fast creation of plasma and cavitation bubbles. In PLAL, the morphology and size of nanoparticles is influenced by the liquid medium used.19
BaFe12O19 is difficult to be dispersed and hence the synthesis of fluids based on these types of materials involve chemical processes. Attempts to synthesize nanofluids based on BAF using PLAL is not noticed in literature and hence thought as a virgin area of synthesis to disperse hard ferrites like BAF in any solvent of choice. In this investigation we propose to synthesize nanofluids based on BaFe12O19 by employing PLAL and using different solvents. It is our motive to study the role of different solvents and laser wavelength on the particle size of the dispersed nanoparticles in the media. Finally a stable nanofluid will be identified which can be employed for further applications.
2. Experimental
2.1 Synthesis of barium hexaferrite target
Barium hexaferrite powder was prepared by using mechanical alloying called high energy planetary type ball milling. Stoichiometric amounts of precursors BaCO3 and Fe2O3 with Fe![[thin space (1/6-em)]](https://www.rsc.org/images/entities/char_2009.gif) :
:![[thin space (1/6-em)]](https://www.rsc.org/images/entities/char_2009.gif) Ba mole ratio 12
Ba mole ratio 12![[thin space (1/6-em)]](https://www.rsc.org/images/entities/char_2009.gif) :
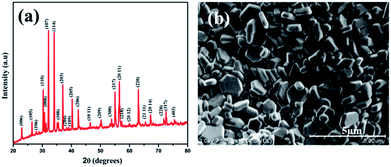
:![[thin space (1/6-em)]](https://www.rsc.org/images/entities/char_2009.gif) 1 were mixed and subjected to milling using acetone as a wet medium. Milling was carried out for 3 hours with 400 rpm using tungsten carbide vials and balls. The powder obtained was then calcined in air for 7 h at 900 °C. It is then ground and pressed into cylindrical pellets with 12 mm diameter and 4 mm thickness. The pellets were sintered at 1150 °C for 72 hours. X-ray diffraction of the pellet was carried out using a Bruker D8 Advance diffractometer with Cu-Kα radiation (λ = 1.54056 Å). Fig. 1(a) shows the X-ray diffraction pattern of BaFe12O19 sintered at 1150 °C. All the peaks can be indexed to barium hexaferrite (ICDD File no: 84-0757) with space group P63/mmc. Formation of hexagonal shaped grains is confirmed from the SEM image, shown in Fig. 1(b).
1 were mixed and subjected to milling using acetone as a wet medium. Milling was carried out for 3 hours with 400 rpm using tungsten carbide vials and balls. The powder obtained was then calcined in air for 7 h at 900 °C. It is then ground and pressed into cylindrical pellets with 12 mm diameter and 4 mm thickness. The pellets were sintered at 1150 °C for 72 hours. X-ray diffraction of the pellet was carried out using a Bruker D8 Advance diffractometer with Cu-Kα radiation (λ = 1.54056 Å). Fig. 1(a) shows the X-ray diffraction pattern of BaFe12O19 sintered at 1150 °C. All the peaks can be indexed to barium hexaferrite (ICDD File no: 84-0757) with space group P63/mmc. Formation of hexagonal shaped grains is confirmed from the SEM image, shown in Fig. 1(b).
2.2 Synthesis of barium hexaferrite nanofluids
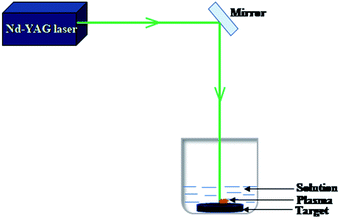
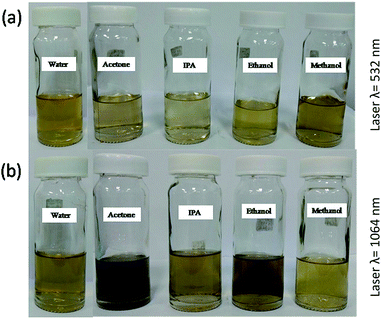
Surfactant free BAF nanofluids were prepared using pulsed laser ablation in liquid (PLAL) technique. The target was ablated for 5 minutes each in five different solvents such as acetone, isopropyl alcohol, methanol, ethanol and distilled water using a Nd-YAG laser (Model LQ 929, Solar laser system) with two different wavelengths such as 1064 nm (fundamental) and 532 nm (second harmonic), having a pulse repetition rate of 10 Hz and a pulse width of 10 ns. Fig. 2 shows the schematic diagram of PLAL. The laser spot size at this distance was 10 mm and the energy fluence was 0.57 J cm−2. The output energy of laser wavelengths was measured using a laser energy meter (Model PM100D, Thorlabs Inc.) and kept the same (450 mJ) at the aforementioned wavelengths. Fig. 3 shows the photograph of BAF nanofluids in different solvents at different ablation wavelengths (532 and 1064 nm). The most stable nanofluid is obtained at 532 nm in ethanol is shown in Fig. 3(a).The size and crystallinity of nanoparticles obtained by ablation in different conditions were analyzed using transmission electron microscope (TEM, model FEI Titan G2 80-300). The elemental analysis was performed using X-ray Energy Dispersive Spectroscopy (XEDS) at scanning transmission electron microscopy (STEM) mode in TEM. The colloids were drop casted on a silicon wafer and dried at room temperature for XPS and SEM analysis. The elemental composition and chemical states of the nanoparticles were studied using X-ray photoelectron spectroscopy (XPS). XPS analysis (Thermo Scientific Inc. Model K-Alpha) was done with monochromatized Al Kα radiation, E = 1.5 keV. The surface morphology was analyzed using field emission scanning electron microscope (FESEM, Hitachi SU8020). Optical absorption spectra of the colloids were measured using UV-Vis Spectrophotometer (Jasco V-770). Magnetic properties of the samples were analyzed using MPMS-SQUID VSM (Quantum Design). The results are presented in detail.
3. Results and discussion
3.1. Morphological analysis
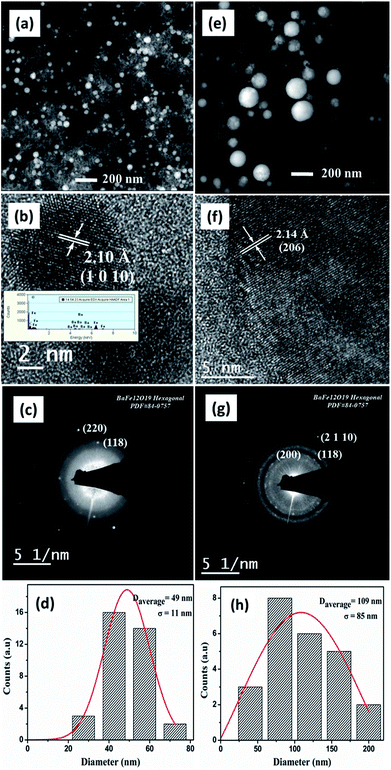
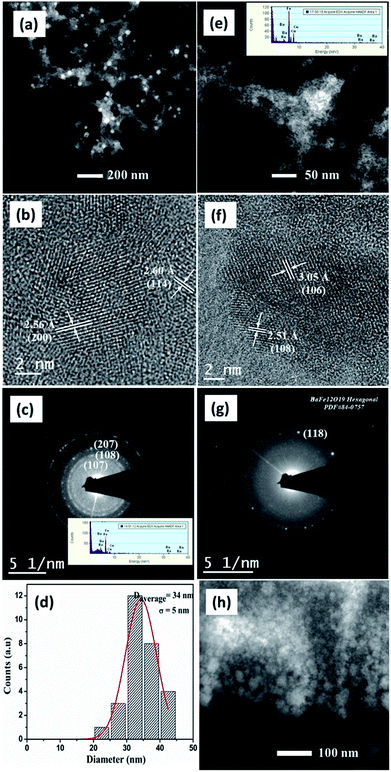
Fig. 4(a)–(d) shows the morphological and crystalline features of BAF nanoparticles prepared in acetone using Nd:YAG laser having a fluence of 0.57 J cm−2 at 532 nm. Fig. 4(a) shows spherical particles formed at 532 nm that display a large population of particles with an average size of 49 nm. The uniformity in size of the ablated particles can be confirmed from the log normal distribution, as shown in Fig. 4(d). The interplanar distance of 2.10 Å identified from HRTEM image corresponds to (1 0 10) plane of barium hexaferrite (ICDD File no: 84-0757) (Fig. 4(b)). Fe, Ba and O are detected in XEDS analysis as shown in the inset of Fig. 4(b). The SAED pattern indexed to (118) plane (Fig. 4(c)) again confirms the phase formed. TEM images of BAF nanoparticles ablated in acetone using 1064 nm are shown in Fig. 4(e)–(h). Well defined spherical particles having an average size 109 nm are obtained. As Fig. 4(f) shows, the nanoparticles show a lattice fringes with a regular spacing that agrees with those reported for (206) family planes of BaFe12O19. The diffraction rings in the SAED pattern reveals that the crystalline phase of the nanoparticles is congruent with that expected for barium hexaferrite (ICDD File no: 84-0757). As it is shown in Fig. 5(h), nanoparticles ablated using 1064 nm possess a broad particle size distribution, quite different from that of at 532 nm.The morphology of barium hexaferrite nanoparticles prepared in isopropyl alcohol (IPA) at 532 nm is shown in Fig. 5(a)–(d). The interplanar distances measured from lattice fringes in Fig. 5(b), 2.56 Å and 2.60 Å agrees with that reported for (200) and (114) family planes of BaFe12O19. SAED pattern obtained from this sample presents reflections related to (107), (108) and (207) family planes for hexagonal phase of barium ferrite. Nonetheless, the morphology of colloid prepared in IPA at 1064 nm suggests an agglomerated gel like material. Lattice spacing of 3.05 Å and 2.51 Å correspond to (106) and (108) planes of BAF respectively (Fig. 5(f)). Ba, Fe and O were identified using XEDS, as shown in the inset of Fig. 5(c).
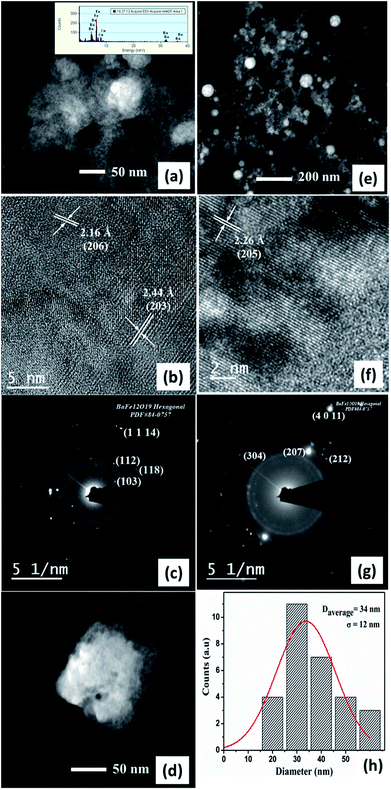
In the case of ablation of BAF target in methanol at 532 nm, the lattice spacing of 2.16 Å and 2.44 Å belongs to (206) and (203) planes (Fig. 6(b)). The diffraction spots obtained agrees with (103), (112), (118) and (1 1 14) planes of BAF. Here also a well defined shape of nanoparticles cannot be seen because of laser fragmentation of particles, which is discussed later. Spherical shaped nanoparticles with an average size of 34 nm are obtained in the case of colloids ablated in methanol using 1064 nm. Fig. 6(f) shows the high magnification image of the nanoparticles' lattice at 1064 nm. An interplanar distance 2.26 Å with miller indices (205) is compatible with phase pure barium hexaferrite. The SAED rings (207) and (212) are characteristic hkl planes of BAF.
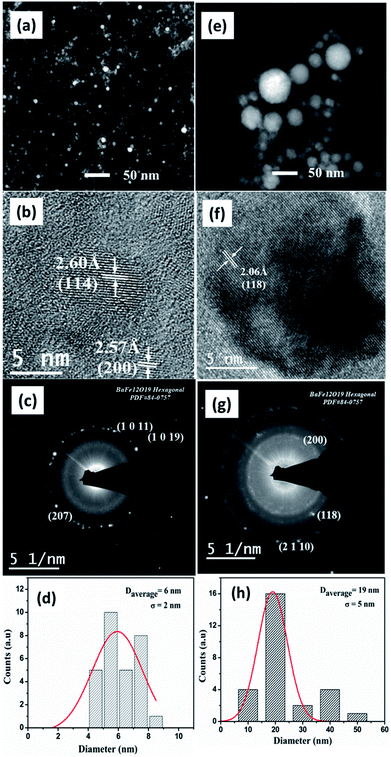
In the case of ablation of the prepared target in ethanol, nanoparticles having an average particle size 6 nm and 19 nm were obtained at wavelengths of 532 nm and 1064 nm respectively. At 532 nm, phase pure crystalline nanoparticles are observed and the measured interplanar distances of 2.57 Å and 2.60 Å are compatible with the target (Fig. 7(b)). The SAED pattern shows distinct bright spots corresponding to (207), (10 11) and (1 0 19) planes (see Fig. 7(c)). For nanoparticles ablated at 532 nm, an agglomerated pattern arises due to fragmentation of the particles. Laser fragmentation reduces the energy necessary for further ablation. A chain like interconnection is evident from the TEM image of nanoparticles ablated in ethanol using 1064 nm as shown in Fig. 7(e). The (118), (200) and (2 1 10) planes measured from HRTEM image matches with phase pure barium ferrite. The SAED rings observed are in agreement with BAF phase (ICDD File no: 84-0757).
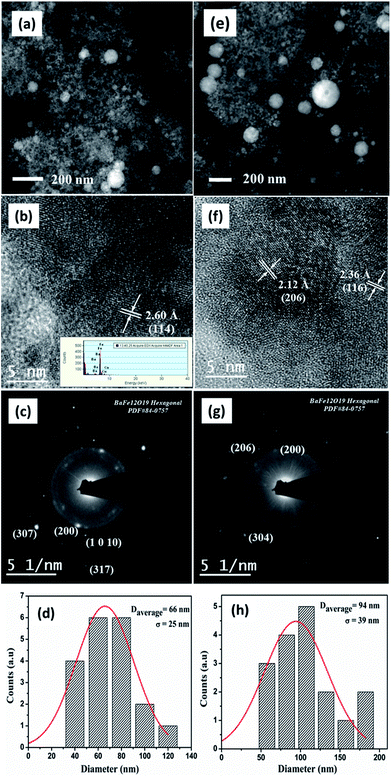
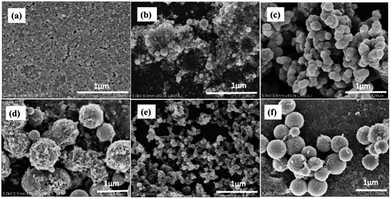
Fig. 8(a)–(d) represents the morphology of BAF nanoparticles ablated in distilled water at 532 nm. Spherical particles with an average size 66 nm are obtained with a broad particle size distribution compared to ablation in other solvents. The diffraction rings shown in Fig. 8(c) and lattice spacing (Fig. 8(b)) revealed the presence of phase pure BAF nanoparticles. Elements such as Fe, Ba and O are identified from the XEDS analysis shown in the inset of Fig. 8(b). In addition, the ablation in water at 1064 nm also resulted in spherical particles with a broad size distribution an having average size of 94 nm. The lattice spacing 2.12 Å and 2.56 Å shown in Fig. 8(f) correspond to (206) and (116) planes respectively. A gel like structure dominates in water based colloid at both wavelengths (Fig. 8(a) and (e)). This structure forms at the earlier stage of ablation reduces the fluence, thereby limits the further nucleation and growth of nanoparticles.20 Fig. 9 shows the SEM images of different nanoparticles prepared in two different solvents at 532 and 1064 nm.
In general the ablated particles are spherical in shape. Spherical surface has the lowest surface area among all other surfaces possessing a definite volume.21 Hence nanoparticle formed by condensation of plasma plume yields spherical morphology. TEM analysis confirms the formation of crystalline nanoparticles. The nanoparticle obtained by PLAL in all solvents maintained the same crystallinity as that of the target as evident from HRTEM and SAED analysis. No other impurities or phases were detected which implies that the ablation was non-reactive one so that there were no chemical reactions between the nanoparticles and the solvents used. Elemental composition and chemical states of the NPs were further confirmed by XPS analysis.
In reactive laser ablation, the solid and liquid medium will react after excitation by the laser medium.5 The wavelength dependence on nanoparticle size distribution is evident from the TEM analysis. The skin depth or ablation depth (δ) changes with the wavelength of incident laser.
 | (1) |
Nanoparticles synthesized at higher wavelengths possess large particle size compared to ablation at shorter wavelengths.23,24 Table 1 shows the particle size obtained at 532 and 1064 nm. A decrease in laser wavelength results in higher energy for ablation. Despite higher ablation at shorter wavelengths, the smaller particle size can be attributed to fragmentation of the synthesized nanoparticles called laser fragmentation in liquids (LFL) which in turn reduces the energy necessary for further ablation.5 However, Rayleigh–Plesset formula describes the dynamics of laser induced bubbles in the solution. The density of liquid affects the time from the formation of a bubble to its first collapse point (Tc). According to Rayleigh formula,
 | (2) |
| Solvent used | Diameter (nm) | |
|---|---|---|
| At 532 nm | At 1064 nm | |
| Ethanol | 6 | 19 |
| Acetone | 49 | 109 |
| Methanol | — | 34 |
| Water | 66 | 94 |
| IPA | 34 | — |
| Ethanol | Methanol | Acetone | IPA | Water | |
|---|---|---|---|---|---|
| Density (kg m−3) | 789 | 792 | 784 | 781 | 998 |
| Viscosity (mPa s) | 1.074 | 0.543 | 0.306 | 2.5 | 0.833 |
| Thermal conductivity (W m−1 K−1) | 0.179 | 0.2 | 0.16 | 15.49 | 0.5983 |
| Refractive index | 1.3611 | 1.3314 | 1.359 | 1.3763 | 1.3260 |
| Dipole moment | 1.69 | 1.7 | 2.69 | 1.66 | 1.8546 |
| Dielectric constant | 24.5 | 32.7 | 20.7 | 17.9 | 80.1 |
| Temperature of vaporization (°C) | 78.24 | 64.7 | 56 | 82.6 | 100 |
| Vapour pressure (kPa) | 5.95 | 13.02 | 30.06 | 4.7 | 3.1690 |
| Surface tension at 20 °C (mN m−1) | 22.10 | 22.70 | 25.20 | 23 | 72.80 |
| Specific heat capacity (J mol−1 K−1) | 112.4 | 79.5 | 125.5 | 1.54 | 75.26 |
As reported by Tilaki et al.,27 the easy and flexible way to control the particle size distribution is changing the liquid media. Size of the nanoparticles decrease with an increase in the dipole moment of the liquid medium. The increased dipole moment increases the electrostatic interaction which creates a strong electrical double layer in the nanoparticle's surface.28 The interaction between plume and nanoparticle depends on all attractive and repulsive forces between nanoparticles and plume species include the attractive van der Waals forces that cause growth/aggregation and electrostatic repulsive force generating due to the overlapping of electrical double layers. Magnetic interaction also should be taken into account in the case of a magnetic target. It is most likely that the combination of several factors leads to the observed changes of the nanoparticles formed.
Another factor which affects the shape of the ablated nanoparticles is the viscosity of the solvent. The expansion of plasma plume is affected by the density and viscosity of liquid environment.15 The higher opposing force caused by higher viscosity of the solvent results in difference in the expansion dynamics of the plume which in turn exert influence on the homogeneity of the plume.29
Nanoparticle characteristics are affected by target material properties also. Thermal conductivity of materials determines the time period during which the particles are in molten form. The gradual decrease in the pressure and temperature of plume is influenced by the thermal conductivity of liquids. Table 2 shows the different properties of the selected solvents. Compared to other solvents distilled water has high density, dielectric constant and surface tension.15 Since mechanism of laser ablation depends on laser characteristics, target properties and properties of solvents, predicting the size properties or morphology will be very difficult in pulsed laser ablation in liquid (PLAL) technique. Here, ablation carried out with different liquid media possessing different thermodynamic properties and laser wavelength may cause the formation of cavitation bubbles with varied lifetimes and sizes. This in turn results in the formation of nanoparticles with different size and morphology.
In order to corroborate the chemical states of the NPs, we proceed to perform XPS analysis.
3.2. XPS analysis
The composition and chemical states of BAF nanoparticles obtained by laser ablation in different solvents were analysed using X-ray photoelectron spectroscopy (XPS). C 1s peak at 284.6 eV was used as the reference peak for the binding energy correction of all spectra. Deconvolution of peaks was done using a Shirley type background calculation. The presence of all the elements were confirmed and marked as shown in Fig. 10–12.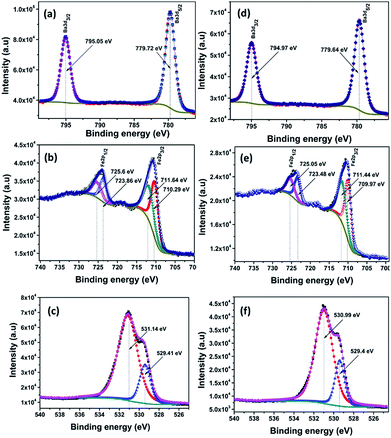 | ||
| Fig. 10 XPS fine spectra of BAF nanoparticles ablated in acetone using 532 nm (a–c) and 1064 nm (d–f). | ||
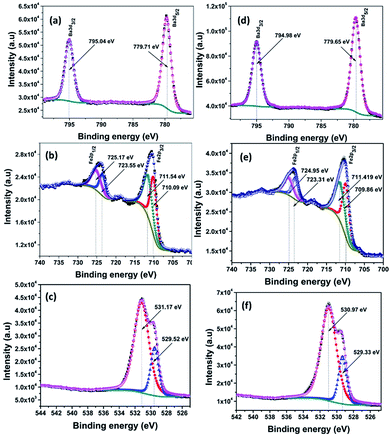 | ||
| Fig. 11 XPS fine spectra of BAF nanoparticles ablated in isopropyl alcohol using 532 nm (a–c) and 1064 nm (d–f). | ||
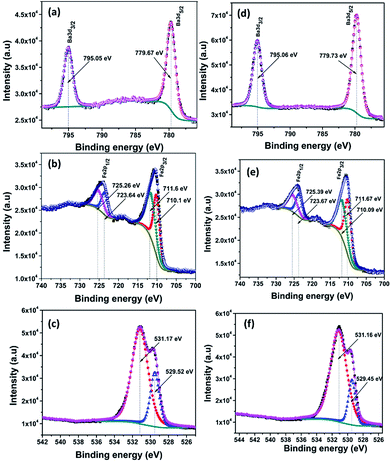 | ||
| Fig. 12 XPS fine spectra of BAF nanoparticles ablated in methanol using 532 nm (a–c) and 1064 nm (d–f). | ||
Fig. 10(a)–(f) shows the constituent element core levels of the nanoparticles ablated in acetone at wavelengths 532 and 1064 nm. The binding energies of Ba 3d5/2 and Ba 3d3/2 obtained are 779.72 eV and 795.05 eV respectively for nanoparticles ablated using 532 nm (Fig. 10(a)). In the case of Fe, the main peaks fitted at 710.29 and 723.86 eV belong to 2p3/2 and 2p1/2 levels respectively as shown in Fig. 10(b).30 The peaks at 710.29 and 711.64 eV confirm the presence of Fe2+ and Fe3+ oxidation states. In addition, 2p3/2 peak at 725.6 eV indicates the presence of Fe3+.31 A satellite peak is observed at 718.1 eV again confirms the presence of Fe3+.30 Fig. 10(c) and (f) shows the XPS spectra of O 1s orbitals at wavelengths 532 and 1064 nm respectively. The peak at 529.41 nm is ascribed to lattice oxygen. The peak at 531.14 nm can be attributed to the presence of non lattice oxygen.32
Fig. 11(a)–(f) shows the XPS spectra of nanoparticles ablated in isopropyl alcohol using 532 and 1064 nm. Here also all the peaks are fitted and are in good agreement with the spectra of samples prepared in acetone. From the fine spectra of Ba, Fe and O for nanoparticles prepared in methanol shown in Fig. 12, it is clear that all the binding energy values matches with the reported one (Table 3).
| Ablation wavelength (nm) | Liquid medium | Fe 2p3/2 (eV) | Fe 2p1/2 (eV) | Ba 3d5/2 (eV) | Ba 3d3/2 (eV) | O 1s (eV) |
|---|---|---|---|---|---|---|
| BAF target | 709.18 | 722.52 | 779.09 | 794.46 | 530.45 | |
| 532 | Acetone | 710.29 | 723.86 | 779.7 | 795.05 | 531.14 |
| IPA | 710.09 | 723.55 | 779.71 | 795.04 | 531.17 | |
| Methanol | 710.1 | 723.64 | 779.67 | 795.05 | 531.17 | |
| Ethanol | 710.08 | 723.55 | 779.74 | 795.09 | 531.23 | |
| Water | 710.09 | 723.68 | 779.74 | 795.08 | 531.74 | |
| 1064 | Acetone | 709.97 | 723.48 | 779.64 | 794.97 | 530.99 |
| IPA | 709.86 | 723.31 | 779.65 | 794.98 | 530.97 | |
| Methanol | 710.09 | 723.67 | 779.73 | 795.06 | 531.16 | |
| Ethanol | 710.06 | 723.59 | 779.69 | 795.09 | 531.08 | |
| Water | 710.03 | 723.64 | 779.8 | 795.32 | 531.7 |
3.3. UV-Vis absorption spectroscopy
The changes in peak position and in its shape can give information related to modifications in particle size and also in particle morphology. The quantum size effect on the ablated nanoparticles were studied by estimating the optical band gap of these nanoparticles. Absorption spectra of all the colloids were measured just after the synthesis using Jasco V 770 spectrophotometer. Fig. 13 shows the optical absorption spectra of colloids. The bandgap of the nanoparticles were calculated using Tauc plot and is shown in the inset of Fig. 13. The difference in absorption at different wavelengths can be understood from the absorption spectra.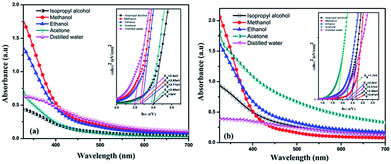 | ||
| Fig. 13 Optical absorption spectra and bandgaps for BAF nanocolloids in different solvents at (a) 532 nm (b) 1064 nm. | ||
According to Mie theory, size, shape and nature of material plays a key role in the optical absorption spectrum of a particle.27 Since the bandgap lies in the visible region, the absorption coefficient of BAF target at 532 nm may be high compared to that of at 1064 nm. As shown in Fig. 4, colloids ablated at 1064 nm are darker than that of at 532 nm. The decreased absorbance of colloids ablated at 532 nm can be attributed to the particle shielding at lower wavelengths.33 The nanoparticles first generated absorb the laser pulses and fragmentation of the already formed particles can happen. This in turn reduces the absorption of light and further the ablation. This self absorption explains the particle size dependence on laser wavelength. Here, the higher self absorption of BAF colloids at shorter wavelengths leads to less ablation efficiency compared to that of at longer wavelength. Thus the size of particles obtained at shorter wavelengths is less compared to mean particle size obtained at longer wavelengths.34 Table 1 shows the mean diameters of nanoparticles obtained in different solvents at two different wavelengths. TEM analysis also shows that ablation at shorter wavelength yields small sized nanoparticles. The extrapolation of Tauc plot gives bandgap. The optical bandgaps of the colloids are illustrated in the inset of Fig. 13. It should be noted that both the average size and bandgap varies at different experimental conditions. For e.g.. nanoparticles ablated in acetone at 532 nm has a band gap of 2.95 eV, whereas ablation at 1064 nm has 1.7 eV. For nanoparticles ablated in ethanol we obtain a bandgap of 2.71 eV and 2.2 eV at 532 and 1064 nm respectively. The ablation in isopropyl alcohol yields nanoparticles with bandgap 3 eV at 532 nm and 2.44 eV at 1064 nm. The nanoparticles ablated in different solvents at 532 nm has bandgap in the range 2.5–3 eV, whereas for ablated nanoparticles at 1064 nm it is 1.7–2.67 eV. Largest average particle size and hence lowest optical bandgap is obtained for nanoparticles in acetone at 1064 nm. Table 4 shows the variation in optical bandgap with ablation wavelength and solvent used. The blue shift in bandgap at 1064 nm can be attributed to the increased size of ablated nanoparticles. The variation in bandgap at different experimental parameters can be attributed to the difference in size and morphology among the particles and is consistent with the experimental evidence obtained from TEM analysis of the samples.35 These observations suggest that the size distribution of nanoparticles depend on the nature of the surrounding liquid environments during ablation.
| Solvent used | Bandgap (eV) | |
|---|---|---|
| At 532 nm | At 1064 nm | |
| Ethanol | 2.71 | 2.2 |
| Acetone | 2.95 | 1.7 |
| Methanol | 2.65 | 2.67 |
| Water | 2.5 | 2.37 |
| IPA | 3 | 2.44 |
3.4. Magnetic properties
The magnetic properties of the target and representative ablated nanoparticles at low temperature and at room temperature are illustrated in Fig. 14 and 15 respectively. Bulk barium hexaferrite possess a saturation magnetization of 80 emu g−1 and a coercivity of 1500 Oe at room temperature. From the hysteresis loop measurements carried out at room temperature and low temperature it can be seen that saturation magnetization and remanent magnetization is substantially reduced when compared to the bulk. One can also notice a drastic reduction in the loop area with a considerable reduction in coercivity. Ablated nanoparticles in acetone at 532 nm displayed a maximum magnetization (Mmax) of 30 emu g−1 and a coercivity of 114 Oe while the same particles ablated at 1064 nm have an Mmax of 24.4 emu g−1 and an Hc of 28 Oe at room temperature. Whereas at 4.5 K, ablated nanoparticles in acetone at 532 nm displayed an Mmax of 36 emu g−1 and a coercivity of 187 Oe while the same particles ablated at 1064 nm have an Mmax of 29 emu g−1 and an Hc of 72 Oe. For the samples ablated in IPA at room temperature, the value of Mmax and Hc are 16 emu g−1 and 93 Oe respectively. The magnitude of coercivity and remanent magnetization for ablated nanoparticles is much lower than that obtained from target. The reduction in the magnetic properties caused by the ablation is due to the potentially induced crystal defects and stress. It has been reported that reduced magnetization of the oxide magnetic particles with decreasing particle size is because of the incomplete coordination of atoms on the particle surface which lead to a noncollinear spin configuration and due to thermal fluctuation of magnetic moments, which significantly diminishes the total magnetic moment at a given magnetic field.36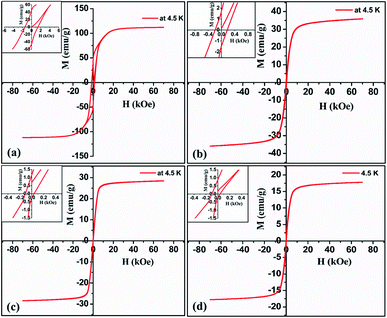 | ||
| Fig. 14 Low temperature magnetization curve of (a) target (b) & (c) nanoparticles ablated in acetone at 532 and 1064 nm (d) nanoparticles ablated in isopropyl alcohol at 1064 nm. | ||
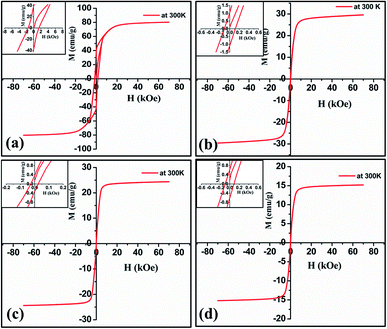 | ||
| Fig. 15 Room temperature magnetization curve of (a) target (b) & (c) nanoparticles ablated in acetone at 532 and 1064 nm (d) nanoparticles ablated in isopropyl alcohol at 1064 nm. | ||
The size effects on the magnetic properties of these nanoparticles is clearly visible from the representative graphs. The variation of coercivity with particle size is a clear indication that the particles tend to become superparamagnetic. Though at this stage, the reduction in Mmax, Mr and Hc cannot be explained, it is to be borne in mind that factors like crystal defects, incomplete coordination of atoms on the particle size which lead to non-collinear spin could be contributing to the modified magnetic properties. This requires elaborate studies and is on.
Fig. 15(b) and (c) shows the magnetization curves of nanoparticles ablated in acetone at 532 and 1064 nm respectively. For nanoparticles ablated at 532 nm, the magnitude of coercivity and remanent magnetization are higher compared to that of particles ablated at 1064 nm. The remanent magnetization at 532 and 1064 nm are 0.98 and 0.36 emu g−1 respectively. The coercivity and magnetization values of nanoparticles ablated in isopropyl alcohol at 1064 nm are less compared to nanoparticles ablated in acetone. The low value of coercivity may be partially induced by smaller size of ablated nanoparticles under the critical size of superparamagnetism.33 The nanoparticles may contain different materials from ferromagnetic iron over amorphous, a mixture of magnetic finite size and surface effects determine their magnetic properties. For example, saturation magnetization of ferromagnetic particles increases with decreasing size while this behaviour is reversed in oxide/ionic compounds.37 Thus, it is clear that the liquid environment plays a role in tuning the magnetic properties of the ablated sample.
4. Conclusions
Stable nanofluids based on barium hexaferrite were synthesized by the method of PLAL. Studies carried out on these fluids indicate that the nature of the solvent has a profound influence on the particle size and optical properties of the resulting fluid. Wavelength of the laser also influences the size of the particles dispersed in the fluid. With further optimization of the PLAL process parameters, morphology of the particles can be tuned with an appropriate choice of the carrier fluid. Magnetic properties of the particles can be tuned, which determine the magnetic properties of the fluid. This technique can be adopted for synthesizing surfactant free fluids.Conflicts of interest
There are no conflicts of interest.Acknowledgements
AVN acknowledges KSCSTE (Govt. of Kerala) for providing financial support in the form of fellowship (No. 056/FSHP – PSS/2013/KSCSTE). MRA acknowledges MHRD (Govt. of India) for awarding UGC-BSR Faculty fellowship (No. F.18-1/2011(BSR) dated 04/01/2017).References
- R. Mehta and R. Upadhyay, Curr. Sci., 1999, 76, 305 Search PubMed
.
- C. Scherer and A. M. Figueiredo Neto, Braz. J. Phys., 2005, 35, 718 CrossRef
.
- Z. Yan and D. B. Chrisey, J. Photochem. Photobiol. C: Photochem. Rev., 2012, 13, 204 CrossRef
.
- J. Xiao, P. Liu, C. Wang and G. Yang, Prog. Mater. Sci., 2017, 87, 140 CrossRef
.
- D. Zhang, B. Gökce and S. Barcikowski, Chem. Rev., 2017, 117, 3990 CrossRef PubMed
.
- A. Tamura, A. Matsumoto, K. Fukami, N. Nishi and T. Sakka, J. Appl. Phys., 2015, 117, 173304 CrossRef
.
- J. Lam, J. Lombard, C. Dujardin, G. Ledoux, S. Merabia and D. Amans, Appl. Phys. Lett., 2016, 108, 074104 CrossRef
.
- G. Yang, Prog. Mater. Sci., 2007, 52, 648 CrossRef
.
- S. Barcikowski, A. Hahn, A. Kabashin and B. Chichkov, Appl. Phys. A, 2007, 87, 47 CrossRef
.
- K. Roshanaei, J. Mater. Sci.: Mater. Electron., 2017, 28, 4537 CrossRef
.
- L. Wang, J. Zhang, Q. Zhang, N. Xu and J. Song, J. Magn. Magn. Mater., 2015, 377, 362 CrossRef
.
- M. T. Ghahfarokhi, H. Saravani and M. R. Esmaeilzaei, J. Inorg. Organomet. Polym. Mater., 2017, 27, 818 CrossRef
.
- M. Manikandan and C. Venkateswaran, J. Magn. Magn. Mater., 2014, 358, 82 CrossRef
.
- V. Amendola and M. Meneghetti, Phys. Chem. Chem. Phys., 2013, 15, 3027 RSC
.
- M. H. Mahdieh and B. Fattahi, Appl. Surf. Sci., 2015, 329, 47 CrossRef
.
- A. Kanitz, J. S. Hoppius, M. Fiebrandt, P. Awakowicz, C. Esen, A. Ostendorf and E. L. Gurevich, Appl. Phys. A, 2017, 123, 674 CrossRef
.
- H. Liu, F. Chen, X. Wang, Q. Yang, H. Bian, J. Si and X. Hou, Thin Solid Films, 2010, 518, 5188 CrossRef
.
- J. Johny, S. Sepulveda-Guzman, B. Krishnan, D. A. Avellaneda, J. A. Aguilar Martinez and S. Shaji, ChemPhysChem, 2017, 18, 1061 CrossRef PubMed
.
- H. Zeng, X. W. Du, S. C. Singh, S. A. Kulinich, S. Yang, J. He and W. Cai, Adv. Funct. Mater., 2012, 22, 1333 CrossRef
.
- G. Cristoforetti, E. Pitzalis, R. Spiniello, R. Ishak, F. Giammanco, M. Muniz-Miranda and S. Caporali, Appl. Surf. Sci., 2012, 258, 3289 CrossRef
.
- X. Song, Z. Qiu, X. Yang, H. Gong, S. Zheng, B. Cao, H. Wang, H. Möhwald and D. Shchukin, Chem. Mater., 2014, 26, 5113 CrossRef
.
- D. Reyes, M. Camacho, M. Camacho, M. Mayorga, D. Weathers, G. Salamo, Z. Wang and A. Neogi, Nanoscale Res. Lett., 2016, 11, 424 CrossRef PubMed
.
- J. Kim, D. A. Reddy, R. Ma and T. K. Kim, Solid State Sci., 2014, 37, 96 CrossRef
.
- T. Tsuji, K. Iryo, Y. Nishimura and M. Tsuji, J. Photochem. Photobiol., A, 2001, 145, 201 CrossRef
.
- Z. Yan, R. Bao, Y. Huang and D. B. Chrisey, J. Phys. Chem. C, 2010, 114, 11370 Search PubMed
.
- J. Johny, S. Sepulveda-Guzman, B. Krishnan, D. Avellaneda and S. Shaji, Appl. Surf. Sci., 2018, 435, 1285 CrossRef
.
- R. Tilaki and S. Mahdavi, Appl. Phys. A, 2006, 84, 215 CrossRef
.
- D. Oseguera-Galindo, A. Martinez-Benitez, A. Chavez-Chavez, G. Gomez-Rosas, A. Perez-Centeno and M. Santana-Aranda, J. Nanopart. Res., 2012, 14, 1133 CrossRef
.
- D. E. Martínez-Tong, M. Sanz, T. A. Ezquerra, A. Nogales, J. F. Marco, M. Castillejo and E. Rebollar, Appl. Surf. Sci., 2016, 418, 522 CrossRef
.
- R. Pattanayak, S. Panigrahi, T. Dash, R. Muduli and D. Behera, Phys. B, 2015, 474, 57 CrossRef
.
- A. Shayan, M. Abdellahi, F. Shahmohammadian, S. Jabbarzare, A. Khandan and H. Ghayour, J. Alloys Compd., 2017, 708, 538 CrossRef
.
- C. Liu, Y. Zhang, Y. Tang, Z. Wang, N. Ma and P. Du, J. Mater. Chem. C, 2017, 5, 3461 RSC
.
- G. Chen, M. Hong, B. Lan, Z. Wang, Y. Lu and T. Chong, Appl. Surf. Sci., 2004, 228, 169 CrossRef
.
- T. Tsuji, K. Iryo, N. Watanabe and M. Tsuji, Appl. Surf. Sci., 2002, 202, 80 CrossRef
.
- G. G. Guillen, M. I. M. Palma, B. Krishnan, D. A. Avellaneda and S. Shaji, J. Mater. Sci.: Mater. Electron., 2016, 27, 6859 CrossRef
.
- M. Drofenik, I. Ban, D. Makovec, A. Žnidaršič, Z. Jagličić, D. Hanžel and D. Lisjak, Mater. Chem. Phys., 2011, 127, 415 CrossRef
.
- A. Kanitz, J. S. Hoppius, M. del Mar Sanz, M. Maicas, A. Ostendorf and E. L. Gurevich, ChemPhysChem, 2017, 18, 1155 CrossRef PubMed
.
| This journal is © The Royal Society of Chemistry 2018 |

