 Open Access Article
Li+ conductivity of tungsten bronze LixSr1−0.5xTa2O6 studied by neutron diffraction analysis†
Hyeon-Dong Hana,
Maxim Avdeev bc and
Young-Il Kim
 *a
*a
aDepartment of Chemistry, Graduate School, Yeungnam University, Gyeongsan 38541, Republic of Korea. E-mail: yikim@ynu.ac.kr; Fax: +82 53 810 4613
bAustralian Centre for Neutron Scattering, Australian Nuclear Science and Technology Organisation, Locked Bag 2001, Kirrawee DC, NSW 2232, Australia
cSchool of Chemistry, The University of Sydney, Sydney, NSW 2006, Australia
First published on 4th May 2018
Abstract
The crystal structures of tetragonal tungsten bronze, LixSr1−0.5xTa2O6 (x = 0.08, 0.17, 0.25) were investigated by neutron diffraction analysis, focusing on the geometry of the oxide framework as well as the Li distribution. The Rietveld refinement and Fourier mapping of nuclear density indicated that Li atoms are distributed in the pentagonal and rectangular channels of the tungsten bronze lattice, which provide 15-fold and 12-fold coordinated cavities, respectively. Those cavities are interconnected to form a three-dimensional network, which can serve as the Li+ conduction pathway in LixSr1−0.5xTa2O6. It is proposed that the rhombic faces of the 12-coordinated polyhedra (distorted cuboctahedra) act as the bottleneck for long-range Li+ migration.
1. Introduction
Tungsten bronze type structures possess unique 1-dimensional channels running along the crystal c-axis, which is promising for the insertion/exchange of small cations such as Li+.1–8 In the tetragonal tungsten bronzes (TTBs), three types of c-directional channels are found: the ab unit area (≈12.4 × 12.4 Å2) contains four pentagonal channels, two quadrangular channels, and four triangular channels, with 15, 12, and 9-coordinated cavities, respectively (Fig. 1).9,10 The ionic conductivity of tungsten bronzes has been reported from several different phases such as A0.6(M, Nb)O3 (A = Sr, Ba; M = Mg, Ti), Pb5−xK6(1−x)Li4(1−x)Ta10O30, Ba0.22TaO0.72, and Na1−xHxNbWO6·yH2O.11–18 In the above, the position of mobile Li+ or H+ has been estimated diversely depending on the composition, triangular channel in Pb5−xK6(1−x)Li4(1−x)Ta10O30 and Pb5(1−x)Li10xTa10O30,12,15 and pentagonal channel in H0.8Na0.4Nb1.2W0.8O6.16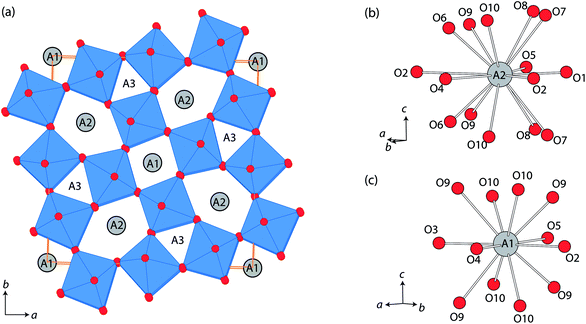 | ||
| Fig. 1 (a) Crystal structure of tetragonal tungsten bronze projected along c-axis, and the coordination environments of (b) A2 and (c) A1 sites, using a particular example of β-SrTa2O6. | ||
Recently, lithiation of the TTB oxide β-SrTa2O6 was accomplished by a solid state ion exchange of Sr2+ → 2Li+.19 The ionic conductivity of LixSr1−0.5xTa2O6, as a function of Li content, 0 < x ≤ 0.31, was highest for x ≈ 0.17 (σ = 10−5 Ω−1 cm−1 at 540 K). The scanning and transmission electron microscopic studies strongly suggested that the Li+/Sr2+ diffusion in LixSr1−0.5xTa2O6 occurred along the channel direction (c-axis). As the Sr2+ ions in β-SrTa2O6 occupy the pentagonal and tetragonal channels, it can be conjectured that Li+ ions enter either or both of the above sites, although the distribution of Li+ has not been definitely judged for LixSr1−0.5xTa2O6.
For better understanding the cation exchange process and the ionic transport in LixSr1−0.5xTa2O6, neutron powder diffraction was carried out for three different compositions, x = 0.08, 0.17, and 0.25. The Rietveld refinement and Fourier mapping of the nuclear scattering density were performed, focusing on the Li+ locations in LixSr1−0.5xTa2O6. It is shown that the 12-coordinate cavities inside the quadrangular channel of LixSr1−0.5xTa2O6 are capped with six rhombic faces, the size of which varies along the progress of the lithiation, possibly impacting on the activation barrier of the ion hopping.
2. Experimental
The tungsten bronze oxide β-SrTa2O6 was prepared via a solid state reaction using SrCO3 (Alfa Aesar, 99.95%) and Ta2O5 (Alfa Aesar, 99.95%), with a final heating temperature of 1673 K.20 For preparing LixSr1−0.5xTa2O6 (x = 0.08, 0.17, and 0.25), a mixture of polycrystalline Li2CO3 (Aldrich, 99.99%) and β-SrTa2O6 was heated to 873 K in air for 12 h. After heating, the sample was rinsed with distilled water, and dried in air at 328 K for 12 h.19 The Li concentration of the product sample was controlled by varying the Li![[thin space (1/6-em)]](https://www.rsc.org/images/entities/char_2009.gif) :
:![[thin space (1/6-em)]](https://www.rsc.org/images/entities/char_2009.gif) Sr ratio in the starting reactant mixture. The chemical analysis, lattice constants, and ionic conductivity of LixSr1−0.5xTa2O6 were reported in a previous work.19
Sr ratio in the starting reactant mixture. The chemical analysis, lattice constants, and ionic conductivity of LixSr1−0.5xTa2O6 were reported in a previous work.19
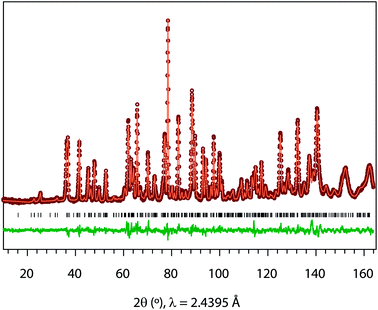
Powder neutron diffraction (ND) was measured for LixSr1−0.5xTa2O6 (x = 0.08, 0.17, and 0.25) in the powder diffractometer, Echidna, at the Australian Nuclear Science Technology Organisation's OPAL facility. The ND data was recorded using ≈2 g of powder sample loaded in a vanadium can, with λ = 2.4395 Å over the 2θ range, 10–164°, at a step size 0.05°. The Rietveld refinement and Fourier map calculation were carried out using the GSAS-EXPGUI software suite.21,22
3. Results and discussion
Fig. 2 shows the ionic conductivity of LixSr1−0.5xTa2O6 as a function of x, measured in the temperature range 298–540 K. The above data were acquired in the dry N2 atmosphere and represent the Li+ conductivity (σLi) of LixSr1−0.5xTa2O6. Notably, the maximal σLi occurred around x = 0.17, which was interpreted as the compromise between structural and compositional factors. The increase of Li content in LixSr1−0.5xTa2O6 accompanied the contractions of the ab-dimension and hence the cross-sectional area of the potential Li pathways. That is, the increase of carrier concentration was likely counteracted by the decrease of carrier mobility.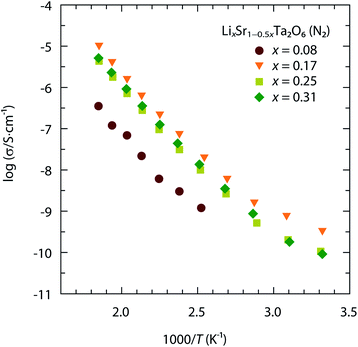 | ||
| Fig. 2 Temperature-dependent ionic conductivity of LixSr1−0.5xTa2O6 (x = 0.08, 0.17, 0.25, and 0.31) measured in N2. | ||
Although the previous study by synchrotron X-ray diffraction (XRD) determined the crystal symmetry and lattice constants of LixSr1−0.5xTa2O6,19 the detailed information on Li occupancy could not be obtained mainly due to its insignificant scattering power. As a complementary approach, neutron powder diffraction was employed here. The neutron scattering length (b) of Li is of comparable magnitude to those of other elements contained in LixSr1−0.5xTa2O6,23,24 which makes the ND data useful for the structural study.
It was supposed that LixSr1−0.5xTa2O6 had quite similar structures to that of β-SrTa2O6, and therefore the neutron Rietveld refinements of LixSr1−0.5xTa2O6 used a structure model based on β-SrTa2O6 (Fig. 1).20 In practice, the Rietveld refinement of LixSr1−0.5xTa2O6 was conducted in a semi-constrained manner. While the lattice constants and all the atomic positions were fully refined, the site occupancies for Sr/Li were subjected to two constraints. First, the amounts of Li and Sr were fixed according to the result of chemical analysis for three samples, which were Li0.08Sr0.96Ta2O6, Li0.17Sr0.92Ta2O6, and Li0.25Sr0.88Ta2O6, respectively. Second, Li was distributed only to pentagonal and quadrangular channels, i.e., the A2 and A1 sites shown in Fig. 1.
Fig. 3 shows, as an example, the refinement profile for Li0.08Sr0.96Ta2O6, and Table 1 lists the corresponding atomic parameters. The plots for x = 0.17 and 0.25, and the associated structural parameters are included in ESI.† Fig. 4 summarizes the structural evolutions upon the Li introduction to β-SrTa2O6. The unit cell volume of LixSr1−0.5xTa2O6 gradually decreased with increasing x (Fig. 4c), which confirmed the observation from the previous XRD study.19 Such a result is attributed mainly to the smaller size of Li+ as compared with Sr2+.25
| Atom | x | y | z | Uiso (Å2) | occ | |
|---|---|---|---|---|---|---|
| a Space group Pnam (Z = 10), a = 12.3604(3) Å, b = 12.4137(4) Å, c = 7.7207(2) Å.b Sr1 site corresponds to quadrangular cavity (A1 in Fig. 1); Sr2 and Sr3 sites correspond to pentagonal cavity (A2 in Fig. 1).c Fixed.d Occupancy factors (occ) for Sr1, Sr2, and Sr3 sites represent the combined contribution from Sr and Li, and are expressed in terms of the neutron scattering length of Sr. | ||||||
| Sr1b | 4c | 0.997(1) | 0.001(2) | 0.25 | 0.001c | 0.581(7)d |
| Sr2b | 4c | 0.3487(8) | 0.1859(9) | 0.25 | 0.015c | 0.885(4)d |
| Sr3b | 4c | 0.3374(8) | 0.1869(1) | 0.75 | 0.015c | 0.885(4)d |
| Ta1 | 4b | 0 | 0.5 | 0.5 | 0.0015c | 1 |
| Ta2 | 8d | 0.0735(4) | 0.2080(4) | 0.4985(8) | 0.0015c | 1 |
| Ta3 | 8d | 0.2860(4) | 0.4242(4) | 0.5049(9) | 0.0015c | 1 |
| O1 | 4c | 0.9824(8) | 0.4721(8) | 0.25 | 0.0174(9) | 1 |
| O2 | 4c | 0.0525(8) | 0.2195(10) | 0.25 | 0.0174(9) | 1 |
| O3 | 4c | 0.1121(9) | 0.1914(8) | 0.75 | 0.0174(9) | 1 |
| O4 | 4c | 0.3199(7) | 0.4201(9) | 0.25 | 0.0174(9) | 1 |
| O5 | 4c | 0.2726(8) | 0.4143(10) | 0.75 | 0.0174(9) | 1 |
| O6 | 8d | 0.2234(5) | 0.2743(5) | 0.4767(8) | 0.002(1) | 1 |
| O7 | 8d | −0.0006(6) | 0.3463(6) | 0.5385(9) | 0.019(1) | 1 |
| O8 | 8d | 0.3414(6) | 0.0066(6) | 0.5361(9) | 0.019(1) | 1 |
| O9 | 8d | 0.1344(6) | 0.0621(6) | 0.468(1) | 0.027(1) | 1 |
| O10 | 8d | 0.4353(7) | 0.3537(6) | 0.530(1) | 0.027(1) | 1 |
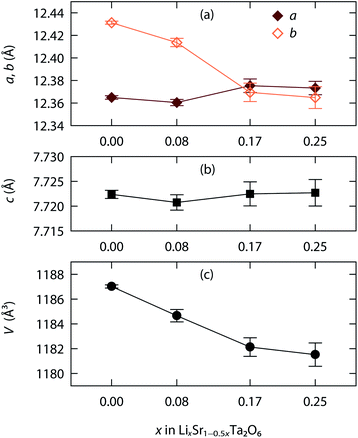 | ||
| Fig. 4 Lattice evolution upon the Li+/Sr2+ ion exchange in β-SrTa2O6: (a) a, b parameters, (b) c parameter, and (c) unit cell volume. | ||
In the neutron Rietveld refinement, it was of main interest to examine the occupancies (occ) of A1 and A2 sites. The model structure of β-SrTa2O6, which is an orthorhombic TTB, is rather complex and includes a large number of structural variables.20 Partly because of such a complexity, the site occupancies of LixSr1−0.5xTa2O6 were refined under the aforementioned constraints.
The coherent neutron scattering lengths of Li and Sr are −1.90 fm and 7.02 fm, respectively. Therefore, either the Li population or the Sr vacation will only decrease the nuclear density for a given site (A1 or A2). Fig. 5 shows the effective neutron scattering lengths (beff) for the A1 and A2 sites, where beff = 7.02 × occ(Sr) − 1.90 × occ(Li). With the increase of x in LixSr1−0.5xTa2O6, the beff(A1) decreased more rapidly than beff(A2). It implies that the Sr2+ → 2Li+ exchange occurred more frequently in the quadrangular channel than in the pentagonal channel, and also that Li+ preferred the A1 site. Such a result is reasonable when considering the small size of Li+. In fact, there were several cases where Li+ occupied even the 9-coordinated A3 site within the triangular channel.9,12,15
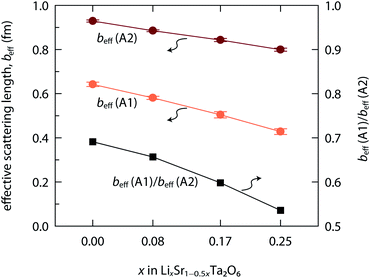 | ||
| Fig. 5 Effective neutron scattering lengths (beff) evaluated for Sr/Li sites, A1 and A2, in LixSr1−0.5xTa2O6 (x = 0, 0.08, 0.17, and 0.25). | ||
The orthorhombic distortion of β-SrTa2O6 was lessened by the Li/Sr exchange, and this can also be attributed to the size effect. The A1 site of β-SrTa2O6 is somewhat smaller than Sr2+. As a quick indicator, the bond valence sum (BVS) for Sr, when located at the A1 site of β-SrTa2O6, is calculated to be 2.53 valence units20 and the corresponding value becomes even larger in LixSr1−0.5xTa2O6. On the other hand, Li is grossly underbonded at the A1 site in LixSr1−0.5xTa2O6, with BVS values of ≈0.5. Therefore, it is presumed that the Li/Sr mixing and disorder on the A1 site could alleviate the orthorhombic distortion. In this respect, it is noteworthy that LixSr1−0.5xTa2O6 may have rather complex local structures. In particular, it is highly probable that Li is displaced from the ideal A1 site, and/or that the A1-centered polyhedra are distinctly relaxed depending on the cation occupancy (Sr, Li, or vacancy).
To examine whether it is legitimate to rule out the occupation of the A3 site by Li, Fourier nuclear density calculation was employed. Table 2 briefly lists the most prominent peaks from the observed (ρobs) and difference (ρdiff = ρobs − ρcalc) profiles for Li0.08Sr0.96Ta2O6, Li0.17Sr0.92Ta2O6, Li0.25Sr0.88Ta2O6, and β-SrTa2O6. Fig. 6 shows the two-dimensional contour diagrams of ρdiff, taken for the ab-plane with z = 1/4 which corresponds to the c-axial height of the A1, A2, and A3 sites. In each of the above four phases, the maximum and minimum values of ρdiff were significantly smaller than the respective ρobs values. This supports the reliability of the Rietveld analysis. Particularly the absence of the notable minima (negative peak) around the A3 site strongly indicates that Li resides mostly on A1 or A2 sites.26
| β-SrTa2O6 | Li0.08Sr0.96Ta2O6 | Li0.17Sr0.92Ta2O6 | Li0.25Sr0.88Ta2O6 | |
|---|---|---|---|---|
| ρobs, max | 1.690 | 1.702 | 1.684 | 1.679 |
| ρobs, min | −0.505 | −0.448 | −0.405 | −0.414 |
| ρdiff, max | 0.028 | 0.033 | 0.078 | 0.079 |
| ρdiff, min | −0.025 | −0.028 | −0.067 | −0.069 |
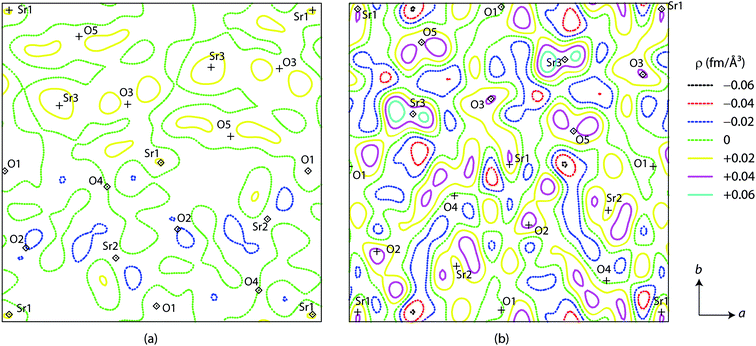 | ||
| Fig. 6 Difference Fourier nuclear density for LixSr1−0.5xTa2O6: (a) x = 0.08 and (b) x = 0.17. Each contour diagram shows an area of 13 × 13 Å centered at (1/2, 1/2, 1/4) and perpendicular to c. | ||
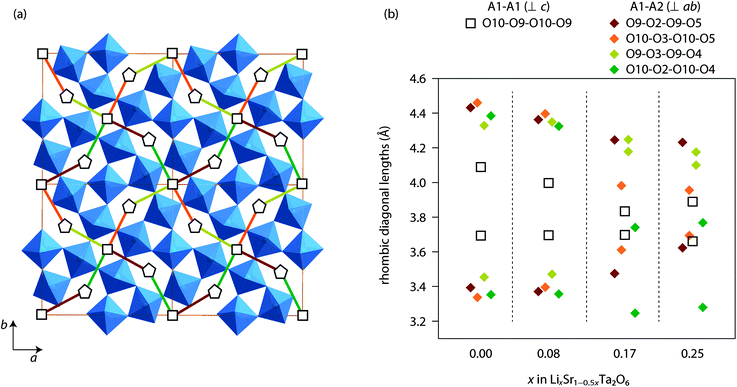
Based on the Rietveld refinement, the Li+ conduction pathways in LixSr1−0.5xTa2O6 can be proposed as follows. Both A1 and A2 sites are partially filled with Li and Sr, while the A1 site has the greater vacancy fraction than A2 (Fig. 5). Apparently the Li+ hopping may occur along the c-axis, that is, between A2 sites through a pentagonal window or between A1 sites through a quadrangular window. But such a migration is not likely to extend to a long range due to the presence of intervening Sr. On the other hand, the A1 and A2 sites also share faces with each other in the ab-plane. Each A1 site is capped with six pseudo-rhombic faces, four of which are shared by A2-centered polyhedra. Meanwhile, each A2 site is immediately surrounded by two A1 sites and three A3 sites on the ab-plane. Therefore, a three-dimensional network of Li+ pathway can be suggested as shown in Fig. 7a, where all the A1 and A2 sites are interconnected with one another. Here, the pseudo-rhombic faces of the A1-centered polyhedra are considered to be potential bottlenecks for the Li+ migration.
Fig. 7b compares the window sizes, represented by the two diagonal lengths, of the rhombic faces adjoining A1 and A1 sites (along 〈001〉), and those adjoining A1 and A2 sites (along 〈120〉 or 〈210〉). In β-SrTa2O6 and Li0.08Sr0.92Ta2O6, the four faces between A1 and A2 sites were similar in size and were more distorted than those between A1 sites. However, in the phases with x = 0.17 and 0.25, the A1-centered polyhedra (distorted cuboctahedra) were formed with more irregular shapes. In any case, the rhombic windows, either the A1–A2 or A1–A1 types, were smaller than the pentagonal window between two A2 sites. This implies that the Li+ hopping should be faster in the c-direction than in the ab-plane. However, it should be reminded that the long range Li+ migration in LixSr1−0.5xTa2O6 will necessarily include the hopping between A1 and A2 sites. As the Li content in LixSr1−0.5xTa2O6 increases, the A1–A2 window gets smaller, which seems to be in part responsible for the decrease of the overall Li+ mobility. Moreover, the increase of Li content concurrently removes the vacancy of the A1/A2 sites, for instance, from Li0.08Sr0.96□0.16Ta2O6 (x = 0.08) to Li0.25Sr0.88□0.07Ta2O6 (x = 0.25). In this regard, the observed variation of σLi in LixSr1−0.5xTa2O6 can be explained by taking into account the carrier concentration, site availability, and the activation of carrier migration. It is suggested that the ionic conductivity of the TTB phase would be optimized far below the full occupation of the A1 and A2 sites, and also by using a composition that can provide enlarged windows for the A1-centered cavities.
4. Conclusions
Neutron Rietveld and Fourier map analyses were employed to examine the intracrystalline structure of TTB LixSr1−0.5xTa2O6, from which a three-dimensional Li+ pathway is suggested. A close examination indicated that the A1 sites, which have the distorted cuboctahedral environments, play an essential role for the long-range Li+ migration within LixSr1−0.5xTa2O6. The increase of x in LixSr1−0.5xTa2O6 leads to the higher carrier concentration, but accompanies an adverse structural effect on the Li+ mobility. Particularly, in the region of x > 0.17, the increase of Li+ concentration is more than offset by the combined effect of two factors: the distortion of the rhombic window of the A1-centered polyhedra and the annihilation of the vacancy sites.Conflicts of interest
There are no conflicts to declare.Acknowledgements
This work was supported by the Yeungnam University Research Grant (2016A380034).References
- A. Magneli, Crystal structure of tetragonal potassium tungsten bronze, Ark. Kemi, 1949, 1, 213–221 CAS.
- A. Magneli and B. Blomberg, Contribution to the knowledge of the alkali tungsten bronzes, Acta Chem. Scand., 1951, 5, 372–378 CrossRef CAS.
- A. Magneli, Studies on the hexagonal tungsten bronzes of potassium, rubidium, and cesium, Acta Chem. Scand., 1953, 7, 315–324 CrossRef CAS.
- P. G. Dickens and M. S. Whittingham, The tungsten bronzes and related compounds, Q. Rev., Chem. Soc., 1968, 22, 30–44 RSC.
- J. D. Guo and M. S. Whittingham, Tungsten oxides and bronzes: Synthesis, diffusion and reactivity, Int. J. Mod. Phys. B, 1993, 7, 4145–4164 CrossRef CAS.
- Y. Han, M. Yang, Y. Zhang, J. Xie, D. Yin and C. Li, Tetragonal tungsten bronze framework as potential anode for Na-ion batteries, Chem. Mater., 2016, 28, 3139–3147 CrossRef CAS.
- Y. Lee, T. Lee, W. Jang and A. Soon, Unraveling the intercalation chemistry of hexagonal tungsten bronze and its optical responses, Chem. Mater., 2016, 28, 4528–4535 CrossRef CAS.
- J. Hu, Y. Zhang, D. Cao and C. Li, Dehydrating bronze iron fluoride as a high capacity conversion cathode for lithium batteries, J. Mater. Chem. A, 2016, 4, 16166–16174 CAS.
- A. Simon and J. Ravez, Solid-state chemistry and non-linear properties of tetragonal tungsten bronzes materials, C. R. Chim., 2006, 9, 1268–1276 CrossRef CAS.
- X. Zhu, M. Fu, M. C. Stennett, P. M. Vilarinho, I. Levin, C. A. Randall, J. Gardner, F. D. Morrison and I. M. Reaney, Crystal-chemical framework for relaxor versus normal ferroelectric behavior in tetragonal tungsten bronzes, Chem. Mater., 2015, 27, 3250–3261 CrossRef CAS.
- E. Kendrick, M. S. Islam and P. R. Slater, Investigation of proton conduction in the tetragonal tungsten bronze niobates: A0.6(M, Nb)O3 (A = Sr, Ba; M = Mg, Ti), Solid State Ionics, 2005, 176, 2975–2978 CrossRef CAS.
- V. Hornebecq, J. M. Reau, A. Villesuzanne, C. Elissalde and J. Ravez, Ionic conductivity, ferroelectricity and chemical bonding in TKWB type ceramics of the K6Li4Ta10O30−Pb5Ta10O30 system, J. Mater. Chem., 1998, 8, 2423–2428 RSC.
- X. Kuang, F. Pan, J. Cao, C. Liang, M. R. Suchomel, F. Porcher and M. Allix, Defect structure, phase separation, and electrical properties of nonstoichiometric tetragonal tungsten bronze Ba0.5−xTaO3−x, Inorg. Chem., 2013, 52, 13244–13252 CrossRef CAS PubMed.
- A. Kuhn, H. Bashir, A. L. Dos Santos, J. L. Acosta and F. Garcia-Alvarado, New protonic solid electrolyte with tetragonal tungsten bronze structure obtained through ionic exchange, J. Solid State Chem., 2004, 177, 2366–2372 CrossRef CAS.
- V. Hornebecq, J. M. Reau and J. Ravez, New Li+ ferroelectric conductors with tetragonal tungsten bronze structure, Solid State Ionics, 2000, 127, 231–240 CrossRef CAS.
- M. L. Sanjuan, A. Kuhn, M. T. Azcondo and F. Garcia-Alvarado, Proton and deuteron exchange in TTB-like Na1.2Nb1.2W0.8O6: structural characterization and spectroscopic study, Eur. J. Inorg. Chem., 2008, 49–58 CrossRef CAS.
- L. Huo, H. Zhao, F. Mauvy, S. Fourcade, C. Labrugere, M. Pouchard and J. C. Grenier, Synthesis and mixed conductivity of ammonium tungsten bronze with tunneling structures, Solid State Sci., 2004, 6, 679–688 CrossRef CAS.
- I. M. Szilagyi, J. Madarasz, G. Pokol, P. Kiraly, G. Tarkanyi, S. Saukko, J. Mizsei, A. L. Toth, A. Szabo and K. Varga-Josepovits, Stability and controlled composition of hexagonal WO3, Chem. Mater., 2008, 20, 4116–4125 CrossRef CAS.
- H. D. Han, C. S. Park, B.-K. Min, Y. Paik, W. Jung and Y. I. Kim, Tungsten bronze Li+ conductor LixSr1−0.5xTa2O6 (0 < x ≤ 0.31) prepared by solid state ion exchange, J. Alloys Compd., 2017, 726, 913–921 CrossRef CAS.
- E. Lee, C. H. Park, D. P. Shoemaker, M. Avdeev and Y. I. Kim, Crystal structure analysis of tungsten bronzes β-SrTa2O6 and β′-SrTa2O6 by synchrotron X-ray and neutron powder diffraction, J. Solid State Chem., 2012, 191, 232–238 CrossRef CAS.
- A. C. Larson, R. B. von Dreele, General Structure Analysis System (GSAS), Los Alamos National Laboratory Report No. LAUR 86-748, 1994 Search PubMed.
- B. H. Toby, EXPGUI, a graphical user interface for GSAS, J. Appl. Crystallogr., 2001, 34, 210–213 CrossRef CAS.
- V. F. Sears, Neutron scattering lengths and cross sections, Neutron News, 1992, 3, 26–37 CrossRef.
- Coherent neutron scattering lengths (b in fm) are −1.90 (Li), 7.02 (Sr), 6.91 (Ta), and 5.803 (O).
- R. D. Shannon, Revised effective ionic radii and systematic studies of interatomic distances in halides and chalcogenides, Acta Crystallogr., 1976, A32, 751–767 CrossRef CAS.
- M. Perez-Estebanez, J. Isasi-Marin, D. M. Tobbens, A. Rivera-Calzada and C. Leon, A systematic study of Nasicon-type Li1+xMxTi2−x(PO4)3 (M: Cr, Al, Fe) by neutron diffraction and impedance spectroscopy, Solid State Ionics, 2014, 266, 1–8 CrossRef CAS.
Footnote |
| † Electronic supplementary information (ESI) available. See DOI: 10.1039/c8ra02779j |
| This journal is © The Royal Society of Chemistry 2018 |

