 Open Access Article
A relationship between the V4+/V5+ ratio and the surface dispersion, surface acidity, and redox performance of V2O5–WO3/TiO2 SCR catalysts
Xuteng Zhao a,
Yongyi Yana,
Lei Mao
 a,
Maochen Fua,
Hairui Zhaoa,
Lvsheng Suna,
Youhong Xiaob and
Guojun Dong
 *a
*a
aCollege of Materials Science and Chemical Engineering, Key Laboratory of Superlight Materials and Surface Technology of Education Ministry, Harbin Engineering University, Harbin, 150001, China. E-mail: dgj1129@163.com
bCollege of Power and Energy Engineering of Harbin Engineering University, Harbin, 150001, China
First published on 4th September 2018
Abstract
A series of V2O5–WO3/TiO2 catalysts with different vanadium loading amounts were prepared by an impregnation method and were characterized by XRD, Raman spectroscopy, XPS, DRIFTS, Py-DRIFTS, NH3-TPD, H2-TPR, etc. The results show that the catalytic activity is related to the ratio of V4+/V5+. The variation of the V4+/V5+ ratio caused by the different dispersion states of vanadia oxide leads to changes in the surface acidity and redox properties of the catalysts. As the V4+/V5+ ratio reaches the maximum value, the apparent activation energy (Ea) required to form the transition state on the Brønsted acid sites is the lowest. Artificial regulation of vanadium loading to properly increase V4+/V5+ content may affect the interactions between V, W, O and Ti atoms, which enhances NH3-SCR reaction performance.
1 Introduction
Nitrogen oxides (NOx) cause many environmental issues, such as photochemical smog, acid rain, ozone depletion and the greenhouse effect. NH3 selective catalytic reduction (SCR) has attracted numerous researchers, who are showing interest in effective and fundamental technological applications of this reaction in environmental purification.1–3 It is necessary to pursue higher deNOx activity for the SCR catalysts used for mobile sources at low temperature on account of the relatively low temperature of exhaust gas. Thus, low-temperature SCR catalysts should be researched further. The V2O5–WO3/TiO2 catalyst system has been the most widely used catalyst in industrial applications for decades. Although this catalyst system is very old, it is still widely applied.4,5 It is known that V2O5–WO3/TiO2 catalysts exhibit high efficiency at 300 °C to 450 °C6 and V2O5–WO3/TiO2 catalysts with higher vanadium contents show much better catalytic performance at low temperature.2,7 However, excessive vanadium species not only generate large amounts of N2O by-products but are also volatilized during the catalyst operation, which is very hazardous to the environment and human health.6 Hence, it is necessary to clarify the operation mode of vanadium species on the catalyst surface.V2O5 is the active component and WO3 is the accelerator and stabilizer on a V2O5–WO3/TiO2 catalyst.8 Vanadium oxide surface sites are very active in the adsorption of organic molecules. This process follows a Mars-van Krevelen mechanism, where the adsorbed organic molecule is oxidized via reduction of the superficial metal cation.9–11,13 Ammonia is also readily and strongly adsorbed on the vanadium active sites.13 Many reports show that a variety of oxidation states of vanadium oxide can improve the catalytic activity; this is attributed to the rapid redox cycle of vanadium oxide.
The denitration activity of a VOx species has a relationship with its structure. Cai et al.12 found that the optimum vanadia loading appeared to fall between monolayer coverage and crystalline V2O5. By using structural calculations,14 with the condition that the surface monolayer vanadia has a similar molecular structure to crystalline V2O5, the monolayer surface coverage of V2O5 was estimated to be about 10 VOx per nm2. Furthermore, Deo et al.15 found that the monolayer surface coverage of vanadia is approximately 7 to 8 VOx per nm2 when the vanadia species is isolated on different carriers. However, Raman spectroscopy is sensitive to crystalline V2O5 and amorphous vanadia. By combining Raman spectroscopy with oxygen-18 isotopic labeling experiments, it can be illustrated that isolated vanadia species possess a terminal V![[double bond, length as m-dash]](https://www.rsc.org/images/entities/char_e001.gif) O bond and three bridging V–O–Ti bonds; also, the polymerized species possesses a terminal V
O bond and three bridging V–O–Ti bonds; also, the polymerized species possesses a terminal V![[double bond, length as m-dash]](https://www.rsc.org/images/entities/char_e001.gif) O bond, a bridging V–O–Ti bond and two bridging V–O–V bonds.16 Researchers have suggested that V2O5 has three states on the catalyst surface: monomeric vanadium species, polymeric vanadium species and crystalline vanadium species. Increasing the vanadia oxide loading amount can promote the transfer of monomeric vanadium species to polymeric and crystalline vanadium species.17,18 G. T. Went et al.19 suggested that polymeric vanadium species possess the highest catalytic activity based on in situ Raman studies; this activity is more than 10 times greater than that of the monomeric vanadium species in the NH3-SCR reaction.
O bond, a bridging V–O–Ti bond and two bridging V–O–V bonds.16 Researchers have suggested that V2O5 has three states on the catalyst surface: monomeric vanadium species, polymeric vanadium species and crystalline vanadium species. Increasing the vanadia oxide loading amount can promote the transfer of monomeric vanadium species to polymeric and crystalline vanadium species.17,18 G. T. Went et al.19 suggested that polymeric vanadium species possess the highest catalytic activity based on in situ Raman studies; this activity is more than 10 times greater than that of the monomeric vanadium species in the NH3-SCR reaction.
In our previous work, we adjusted the (V4+ + V3+)/V5+ or V4+/V5+ ratio by changing the pH value; the results demonstrated that the catalyst with the optimal performance of the best NOx conversion and N2 selectivity contained highly coordinated polymeric vanadia species when the amount of low valence state V was increased.20 Furthermore, according to our research on adjusting the (V4+ + V3+)/V5+ or V4+/V5+ ratio via changing the oxygen flux in the calcining process, we found that the V4+/V5+ ratio increased in an appropriate range; the amount of polymeric vanadia species also increased and Ea decreased.21 A report by M. J. Lázaro et al.22 showed that NO conversion reached a maximum because the vanadia-based catalyst has a higher Brønsted proton acid (V4+) concentration. The surface coverage of a sample doped with tungsten and vanadia reached approximately half a monolayer, and the higher NO conversion had a close relationship with the well-dispersed and dissociated vanadia species. It can be inferred that the Brønsted proton acid (V4+) variation is related to the structure variation of the vanadia species.
In the above reports, we can infer that relative content of active components in different valence states has a significant effect on the NO conversion. However, although the VWTi catalytic system has been studied for many years, there are few reports about the detailed relationship between the V4+/V5+ ratio and the dispersion state, surface acidity, adsorbed oxygen concentration and redox properties of this system. In this study, the vanadium content with different valencies on the support surface was controlled by adjusting the vanadium loading, and the relationship between the V4+/V5+ ratio and the influence of the relative content of vanadium species with different valence states on NO conversion was researched by XRD, Raman spectroscopy, XPS, in situ infrared spectroscopy, DRIFTS, etc.
2 Experimental
2.1 Catalyst preparation
A series of catalyst samples were prepared by the substep-wet impregnation method. All chemicals were analytical reagent grate. Commercial anatase TiO2 (SBET = 120 m2 g−1, Tianjing Guangfu Material Company) was added to a solution containing an appropriate amount of ammonium paratungstate dissolved in oxalic acid solution. After the solution was stirred for 24 h, the mixed solution was then heated at 100 °C for 2 h to remove water to obtain the dry solid product, which was then dried at 120 °C overnight and finally calcined in air at 500 °C for 3 h to obtain 8 wt% WO3/TiO2 support. After that, using oxalic acid as solvent, an appropriate amount of ammonium metavanadate was dissolved in solution; then, WO3–TiO2 carrier was added to this solution and the previous drying and calcining steps were repeated. Using the above method, a series of V2O5(n)WO3/TiO2 catalysts were successfully prepared, where n indicates the V2O5 content expressed in wt%. All the samples are abbreviated to VnW/Ti (n = 1, 3, 5, 7, 9, 11 and 13).2.2 Catalyst characterization
The XRD patterns were recorded on an X-ray diffractometer (Rigaku D/max-TTR-III) with Cu Kα radiation (λ = 0.15405 nm) operating at a scan rate of 10° min−1 with a 2θ angle range from 10° to 80°. The N2 adsorption–desorption isotherms were acquired at −196 °C using a Builder SSA-4300 instrument (China, Builder Company). Raman spectra were recorded under dehydrated conditions with a resolution of 1 cm−1 and a 785 nm laser using a Microscopic Confocal Raman Spectrometer (Perkin Elmer, station 400F). The X-ray photoelectron spectra (XPS) were recorded on a K-Alpha spectrometer (Thermo Fisher SCIENTIFIC, America) equipped with an Al Kα radiation (1486.6 eV) X-ray source.The temperature programmed reduction (TPR) was measured on a PCA 1000 automatic chemical adsorption instrument with a thermal conductivity detector (TCD). Firstly, 0.1 g catalyst was treated with an ultra-high-purity argon (30 mL min−1) flow at 50 °C for 30 min. Then, the reactor was heated from 50 °C to 800 °C at a rate of 10 °C min−1 under 5 vol% H2/Ar (30 mL min−1). The TPO test was performed after reduction of the sample with 5 vol% H2/Ar from 50 °C to 600 °C. After that, all samples were retreated under pure Ar (30 mL min−1) at 50 °C for 30 min; then, the TPO run was carried out in 5 vol% O2/Ar with 30 mL min−1 flow by increasing the temperature from 50 °C to 800 °C at a rate of 10 °C min−1.
The redox rate (in mol m−2 s−1) mentioned here refers to the average reduction rate and the average oxidation rate in the reduction or oxidation process, described as the hydrogen consumption or the oxygen consumption for a unit area of the catalyst in a unit of time, respectively. The hydrogen consumption and the oxygen consumption were obtained by calculating the peak area based on the TPR of standard CuO and the TPO of standard Cu. The slope of the TPO or TPR curve was described as the momentary rate of the oxidation or reduction process, respectively.
The NH3 adsorption FTIR spectra were recorded in the range of 1000 to 4000 cm−1 using an FTIR spectrometer (Nicolet 6700) equipped with an MCT detector (100 scans, 4 cm−1 resolution). Prior to the measurement, all calcined catalyst samples were placed in a Harrick DRIFTS cell and purged with Ar at 300 °C for 1 h to remove surface organic residues. After the sample was cooled to room temperature, the background spectrum was collected under flowing argon. Then, the sample was exposed to 0.1% (v/v) NH3/Ar (120 mL min−1) for half an hour and subsequently flushed with Ar. Finally, the NH3 adsorption FTIR spectra were collected. This device was also used for the in situ pyridine adsorption infrared test.
In order to further investigate the reactivity of adsorbed NH3 on the catalyst, NH3 in situ FTIR experiments were carried out using an FTIR spectrometer. The catalyst was purged in Ar (50 mL min−1) at 400 °C for 1 h, then cooled to 200 °C. The NH3 adsorption was carried out in 1000 ppm NH3/Ar (50 mL min−1) for 30 min; then, mixed gas of 1000 ppm NO/Ar and 5% O2 was used to react with the adsorbed ammonia on the catalyst surface. In situ FTIR spectra of the catalysts were collected at various times.
NH3-TPD measurements were carried out using a PCA 1000 automatic chemical adsorption instrument with a thermal conductivity detector (TCD). 0.1 g sample was packed in a quartz tube, treated at 400 °C for 30 min with Ar, and cooled to 50 °C; then, pure NH3 was adsorbed on the catalyst surface for 10 minutes. Then, the samples were ramped to 600 °C at a rate of 10 °C min−1 to desorb NH3.
2.3 Catalytic activity
The NH3-SCR activities of the catalysts were determined in a fixed-bed quartz tubular microreactor with the inlet and outlet gases monitored by a PFEIFFER GSD320 gas analysis system (ThermoStarTM, Germany). The 0.6 g catalyst sample was evaluated under simulated exhaust gas: 1000 ppm NO, 1000 ppm NH3, 5% O2/Ar and balance Ar. The total gas flow rate was 200 mL min−1, corresponding to a gas hourly space velocity (GHSV) of 20![[thin space (1/6-em)]](https://www.rsc.org/images/entities/char_2009.gif) 000 h−1. Prior to each experiment, the catalyst was purged with an Ar flow at 250 °C for 1 h, and the activity test was performed at atmospheric pressure from 150 °C to 410 °C at a heating rate of 10 °C min−1. The NOx conversion (%) was obtained using the following eqn (1):
000 h−1. Prior to each experiment, the catalyst was purged with an Ar flow at 250 °C for 1 h, and the activity test was performed at atmospheric pressure from 150 °C to 410 °C at a heating rate of 10 °C min−1. The NOx conversion (%) was obtained using the following eqn (1):
 | (1) |
3 Results and discussion
3.1 Surface structure analysis
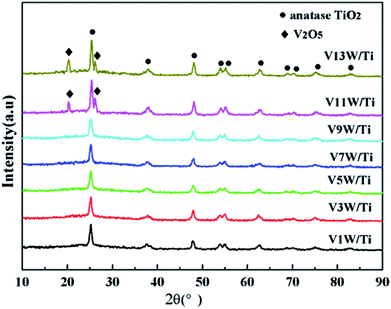
Fig. 1 shows the XRD patterns of the VnW/Ti catalysts with different vanadia loading amounts. The XRD patterns of the samples are mainly attributed to anatase phase TiO2 (JCPDS, PDF 21-1272). No obvious V2O5 crystal diffraction peak appears when the vanadium content is less than 9%, which shows that no crystalline vanadium oxide is generated under this condition. However, two weak diffraction peaks attributed to crystalline V2O5 appear at 26.1° and 20.3° in the spectra of V11W/Ti and V13W/Ti. The formation of crystalline vanadium oxides is a process of aggregation state transition. It has been reported that vanadia species transform from tetrahedral VO4 (ref. 23 and 24) to moderately distorted dimeric or oligomeric species,25,26 then to isolated polymers27 and finally to crystalline V2O5.28 In this work, with increasing vanadium content, the vanadium oxide gradually changes from a dispersed state to an aggregated state and finally forms crystals. It can be inferred that vanadium oxide in V9W/Ti may exist in the form of an intermediate state of aggregation; in addition, according to the catalytic activity tests, V9W/Ti has the best catalytic activity. Therefore, the presence of transitional state oxides may improve the catalytic activity. To further verify the existence of this transitional state, the number of atoms per unit area have been calculated as follows (2).30
 | (2) |
The BET results, crystallite sizes of V2O5, percentages of vanadium atom and V atomic numbers per unit area of the VnW/Ti catalysts have been summarized in Table 1. The monolayer surface coverage of the vanadia oxide overlayer on different oxide supports has been found to be approximately 7 to 8 atoms per nm2; this monolayer coverage corresponds to 6 wt% V2O5 on the TiO2 support.31 The number of vanadium atoms in the V9W/Ti catalyst is approximately 8.4/nm2. Obviously, increasing the vanadium content and the addition of tungsten slightly increase the content of V dispersed on the support surface. Additionally, the large increase of Nnumber and the sum of the V atoms in V11W/Ti and V13W/Ti proves the formation of crystalline vanadium. These results indicate that vanadium oxide may be in a transitional state from the dispersed state to the crystalline state in the V9W/Ti catalyst. Interestingly, although the amount of tungsten was not changed, the number of tungsten atoms increased sharply when the crystalline vanadium oxide was formed; this indicates that the dispersion of tungsten oxide on the support surface was also changed by the formation of crystalline vanadium oxide.
| Sample | Specific surface area (m2 g−1) | Percentage of V atom (at% by XPS) | Atomic number (nm−2) | V2p | W4f | O1s | Crystallite size of V2O5 (nm) | ||
|---|---|---|---|---|---|---|---|---|---|
| V | W | V4+/V5+ | (V4+ + V3+)/V | W6+/W | Oα/(Oα + Oβ) | ||||
| TiO2 | 120 | — | — | ||||||
| W/Ti | 77.45 | — | — | 2.5 | |||||
| V1W/Ti | 73.50 | 0.62 | 0.8 | 2.6 | 0.49 | 0.41 | 0.55 | 0.23 | — |
| V3W/Ti | 68.39 | 0.80 | 2.6 | 2.7 | 0.53 | 0.41 | 0.63 | 0.28 | — |
| V5W/Ti | 65.13 | 1.48 | 4.5 | 2.8 | 0.99 | 0.52 | 0.68 | 0.34 | — |
| V7W/Ti | 60.91 | 1.52 | 6.6 | 2.9 | 1.47 | 0.61 | 0.71 | 0.36 | — |
| V9W/Ti | 60.68 | 2.28 | 8.4 | 2.9 | 1.73 | 0.64 | 0.93 | 0.38 | — |
| V11W/Ti | 30.13 | 2.94 | 20.3 | 5.6 | 0.88 | 0.56 | 0.81 | 0.31 | 14.1 |
| V13W/Ti | 26.15 | 3.54 | 27.1 | 6.5 | 0.50 | 0.49 | 0.69 | 0.30 | 15.5 |
The specific surface area of V1W/Ti–V9W/Ti decreases slightly with increasing vanadium loading amount. However, V9W/Ti exhibits the best catalytic performance. It should be noted that the specific surface area decreases significantly in V11W/Ti and V13W/Ti, which can be attributed to the formation of crystalline V2O5. It can be inferred that the catalytic activity is not affected by a decrease in specific surface area in this catalytic system.
Although the formation of crystalline V2O5 was detected in the XRD patterns, the detailed structural characteristics of the vanadate species could not be determined from the XRD results. Therefore, Raman spectra were used to study the structural characteristics of the vanadium species in the VnW/Ti samples (Fig. 2).
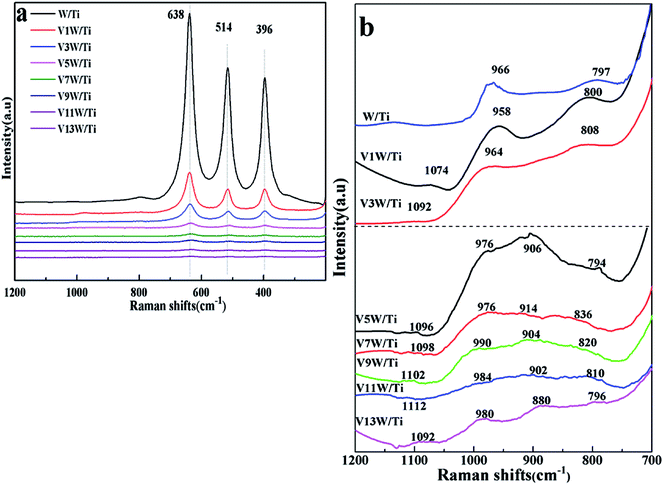 | ||
| Fig. 2 Raman spectra of the VnW/Ti catalysts ((a) Raman bands in the 200 to 1200 cm−1 region; (b) Raman bands in the 700 to 1200 cm−1 region). | ||
V–O, W–O, V![[double bond, length as m-dash]](https://www.rsc.org/images/entities/char_e001.gif) O and W
O and W![[double bond, length as m-dash]](https://www.rsc.org/images/entities/char_e001.gif) O on the catalyst surface changed with increasing loading amount of vanadium. The peaks at 396, 514 and 638 cm−1 shown in Fig. 2(a) are attributed to the symmetrical stretching vibration and the symmetrical and unsymmetrical bending vibrations of anatase TiO2, respectively.32 Also, the peaks at 1074 to 1112 cm−1 in Fig. 2(b) are attributed to the V
O on the catalyst surface changed with increasing loading amount of vanadium. The peaks at 396, 514 and 638 cm−1 shown in Fig. 2(a) are attributed to the symmetrical stretching vibration and the symmetrical and unsymmetrical bending vibrations of anatase TiO2, respectively.32 Also, the peaks at 1074 to 1112 cm−1 in Fig. 2(b) are attributed to the V![[double bond, length as m-dash]](https://www.rsc.org/images/entities/char_e001.gif) O stretching vibration.27 The relative strengths of the interactions between V, W and O change, with slight shifts in the wavenumbers of the individual peak positions. No peaks of V
O stretching vibration.27 The relative strengths of the interactions between V, W and O change, with slight shifts in the wavenumbers of the individual peak positions. No peaks of V![[double bond, length as m-dash]](https://www.rsc.org/images/entities/char_e001.gif) O and V–O appear in the spectrum of the W/Ti catalyst. When the vanadium content is low, the interaction between vanadium species and the catalyst support is mainly represented by O
O and V–O appear in the spectrum of the W/Ti catalyst. When the vanadium content is low, the interaction between vanadium species and the catalyst support is mainly represented by O![[double bond, length as m-dash]](https://www.rsc.org/images/entities/char_e001.gif) V–O–Ti4+. With increasing vanadium loading amount, the vanadium species transition from a dispersed state to a concentrated state; the wavenumbers of the V
V–O–Ti4+. With increasing vanadium loading amount, the vanadium species transition from a dispersed state to a concentrated state; the wavenumbers of the V![[double bond, length as m-dash]](https://www.rsc.org/images/entities/char_e001.gif) O bond increase gradually from V1W/Ti to V11W/Ti and decrease sharply from V11W/Ti to V13W/Ti, corresponding to the same trend of interaction strength of the V
O bond increase gradually from V1W/Ti to V11W/Ti and decrease sharply from V11W/Ti to V13W/Ti, corresponding to the same trend of interaction strength of the V![[double bond, length as m-dash]](https://www.rsc.org/images/entities/char_e001.gif) O bonds, and O
O bonds, and O![[double bond, length as m-dash]](https://www.rsc.org/images/entities/char_e001.gif) V–O–V4+(V5+)–O–Ti4+ will also form. The radii of V4+ (53 pm) and V5+ (46 pm) are very close to the radius of Ti4+ (51 pm), and they exhibit a strong ability to attract electrons; thus, the attraction between V and O atoms in V
V–O–V4+(V5+)–O–Ti4+ will also form. The radii of V4+ (53 pm) and V5+ (46 pm) are very close to the radius of Ti4+ (51 pm), and they exhibit a strong ability to attract electrons; thus, the attraction between V and O atoms in V![[double bond, length as m-dash]](https://www.rsc.org/images/entities/char_e001.gif) O is enhanced. When the vanadium loading reaches 9%, the support surface is occupied by a large number of aggregated vanadium species, resulting in a suppression effect of the V
O is enhanced. When the vanadium loading reaches 9%, the support surface is occupied by a large number of aggregated vanadium species, resulting in a suppression effect of the V![[double bond, length as m-dash]](https://www.rsc.org/images/entities/char_e001.gif) O stretching vibration and an increase in the interaction strength of the V
O stretching vibration and an increase in the interaction strength of the V![[double bond, length as m-dash]](https://www.rsc.org/images/entities/char_e001.gif) O bond. Moreover, the sharp decreases of the wavenumbers in V11W/Ti and V13W/Ti are due to the formation of crystalline V2O5, which results in decreased V
O bond. Moreover, the sharp decreases of the wavenumbers in V11W/Ti and V13W/Ti are due to the formation of crystalline V2O5, which results in decreased V![[double bond, length as m-dash]](https://www.rsc.org/images/entities/char_e001.gif) O stretching vibrations and decreased interaction strength of the V
O stretching vibrations and decreased interaction strength of the V![[double bond, length as m-dash]](https://www.rsc.org/images/entities/char_e001.gif) O bonds. Thus, it can be inferred that highly dispersed and crystalline vanadium species can promote V
O bonds. Thus, it can be inferred that highly dispersed and crystalline vanadium species can promote V![[double bond, length as m-dash]](https://www.rsc.org/images/entities/char_e001.gif) O stretching vibrations and then decrease the energy required for the V
O stretching vibrations and then decrease the energy required for the V![[double bond, length as m-dash]](https://www.rsc.org/images/entities/char_e001.gif) O stretching vibrations; however, aggregated and transition state vanadium species exhibit the opposite trend. The vanadium species may be in transition from the aggregation state to the crystalline state when the vanadium loading is between 5% and 9%. As the loading continues to increase, crystalline vanadium is generated on the surface. In addition, the peaks located at 958 to 990 cm−1 are attributed to the W
O stretching vibrations; however, aggregated and transition state vanadium species exhibit the opposite trend. The vanadium species may be in transition from the aggregation state to the crystalline state when the vanadium loading is between 5% and 9%. As the loading continues to increase, crystalline vanadium is generated on the surface. In addition, the peaks located at 958 to 990 cm−1 are attributed to the W![[double bond, length as m-dash]](https://www.rsc.org/images/entities/char_e001.gif) O bond.33 Similarly, the frequencies of the W
O bond.33 Similarly, the frequencies of the W![[double bond, length as m-dash]](https://www.rsc.org/images/entities/char_e001.gif) O bond increase initially and then decrease. This indicates a changing trend of the interaction strength of the W
O bond increase initially and then decrease. This indicates a changing trend of the interaction strength of the W![[double bond, length as m-dash]](https://www.rsc.org/images/entities/char_e001.gif) O bond. When the vanadium loading exceeds 5%, the W
O bond. When the vanadium loading exceeds 5%, the W![[double bond, length as m-dash]](https://www.rsc.org/images/entities/char_e001.gif) O vibration is restrained and the interaction strength of the W
O vibration is restrained and the interaction strength of the W![[double bond, length as m-dash]](https://www.rsc.org/images/entities/char_e001.gif) O bond increases. However, the formation of crystalline V2O5 in V11W/Ti to V13W/Ti inhibits the interactions between V and W atoms; thus, the W
O bond increases. However, the formation of crystalline V2O5 in V11W/Ti to V13W/Ti inhibits the interactions between V and W atoms; thus, the W![[double bond, length as m-dash]](https://www.rsc.org/images/entities/char_e001.gif) O stretching vibration strengthens, resulting in a decrease of the interaction strength of the W
O stretching vibration strengthens, resulting in a decrease of the interaction strength of the W![[double bond, length as m-dash]](https://www.rsc.org/images/entities/char_e001.gif) O bond.
O bond.
The peaks located at 880 to 914 cm−1 and 794 to 836 cm−1 are attributed to the V–O bond27 and W–O bond.33 For V1W/Ti and V3W/Ti, no obvious V–O bonds are observed. However, V3W/Ti has an extremely weak peak at 900 cm−1 because of the formation of a small amount of the dimeric structural mode on the catalyst surface. In addition, due to the massive formation of V–O in V5W/Ti, the W–O frequencies decrease from 808 cm−1 to 794 cm−1, which indicates that V–O has combined with W–O to form V–O–W.34,35 This result causes enhancement of the W–O stretching vibration and a decrease of the interaction strength of the W–O bond. Moreover, the peaks of the V–O bond and W–O bond initially shift to higher Raman shifts in V5W/Ti to V7W/Ti and then to low frequencies in V9W/Ti to V13W/Ti. This indicates that V–O has combined with W–O to form V–O–W, resulting in red shifts of the V–O and W–O peaks in V9W/Ti to V13W/Ti; then, the formation of crystalline V2O5 enhances the trend of self-polymerization to form crystalline V2O5, and the V–O and W–O peaks thus shift to high frequencies. Based on the above results, it can be inferred that three valence states of vanadium lead to the formation of various VOx species on the catalyst surface. When the vanadium content is less than 5%, the V species is mainly present as a single vanadium and is highly dispersed on the support surface; when the vanadium content is in the range of 5% to 9%, the V species begin to accumulate in large amounts and transition from the aggregation state to the crystalline state; when the vanadium content reaches 11%, a large number of crystalline vanadium species appear. More importantly, the difference caused by vanadium loading is reflected by the regular change of the V4+/V5+ ratio, and the contents of V3+, V4+ and V5+ change with variation of the vanadium dispersion state. Therefore, XPS tests were performed, and the results are as follows.
3.2 Valence states of vanadium and their ratios
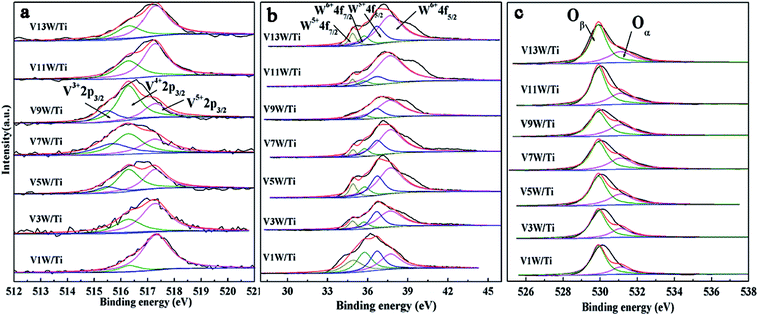
The XPS results are summarized in Table 1 according to the peak-fit processing for the V2p spectra in Fig. 3(a). The vanadium species mainly exist on the catalyst surface as V5+, V4+ and V3+, with binding energies of 517.3 eV, 516.3 eV and 515.5 eV assigned to V5+2p3/2, V4+2p3/2 and V3+2p3/2, respectively.36,37 With increasing vanadium loading, the contents of V4+ and V3+ also increase. When the vanadium loading reaches 9%, the amounts of V4+ and V3+ are the highest and the ratios of V4+/V5+ and (V4++V3+)/V5+ reach the maximum. The V4+/V5+ ratio decreases in V11W/Ti and V13W/Ti because of the formation of the V5+![[double bond, length as m-dash]](https://www.rsc.org/images/entities/char_e001.gif) O vanadium oxide species in the process of the formation of crystalline V2O5. Combined with the Raman test results, it can be inferred that the V species in the transition state between the aggregated and crystalline states will maintain a higher V4+/V5+ ratio.
O vanadium oxide species in the process of the formation of crystalline V2O5. Combined with the Raman test results, it can be inferred that the V species in the transition state between the aggregated and crystalline states will maintain a higher V4+/V5+ ratio.
In Fig. 3(b), the tungsten species exist as W6+ (W6+4f7/2 = 35.75 eV, W6+4f5/2 = 37.7 eV) and W5+ (W5+4f7/2 = 34.9 eV, W5+4f5/2 = 36.7 eV) valence states, but are mainly in the form of W6+. The addition of WO3 is essential in this catalytic system. WO3 has the effect of storing and transferring electrons to the vanadium oxide species, which can stabilize the valence states of V4+ and V3+.38,39 Thus, the V4+/V5+ ratio also has a great relationship with the W6+/W ratio. From Table 1, the valence states of W and V have the same trend. Interestingly, although the total amount of W has not changed, the content of W6+ changes with the vanadium loading. When the vanadium loading reaches 9%, the amounts of W6+ reach the maximum. It has been reported that an increase of V4+ is beneficial to the transition of tungsten to higher valence states to form V4+–O–W6+. Conversely, the increase of V5+ facilitates the transition of tungsten to low-valence states to form V5+–O–W5+.34,35 Increasing the W6+ content is favorable for the SCR reaction,40 and the V9W/Ti catalyst has the best catalytic activity according to the activity test results. It can be inferred that the changes in V4+/V5+ caused by different loads will affect the content of W6+.
The O1s peaks can be de-convoluted into two peaks: the lattice oxygen (O2−) peak at 529.9 eV (denoted as Oβ) and the chemisorbed oxygen (O22−, O−) peak at 531.1 eV (denoted as Oα), as shown in Fig. 3(c). Surface chemisorbed oxygen has been reported41 to be the most active oxygen and plays an important role in oxidation reactions; also, a higher relative ratio of Oα/(Oα + Oβ) on the catalyst surface can be correlated with high SCR activity. From Table 1, the ratio of Oα/(Oα + Oβ) has the same trend as V4+/V5+. The highest ratio of Oα/(Oα + Oβ) is 0.38 in the V9W/Ti catalyst. This is consistent with the results of the activity tests. It can be inferred that there is a strong relationship between V4+/V5+ and Oα/(Oα + Oβ). The same change trend of Oα/(Oα + Oβ) as V4+/V5+ may be due to the increased oxygen defect concentration caused by the increase of V4+/V5+. Based on the above test results, although the contents of V4+ and V5+ gradually increase during the addition of vanadium, the difference in the ratio of V4+/V5+ is a key factor in controlling the catalytic activity. The change trend of V4+/V5+ is very close to the variation trend of the dispersion state of the vanadium species and the concentration of chemically adsorbed oxygen. The relationship between the V4+/V5+ ratio and the changes in the surface acid sites will be further discussed below.
3.3 Surface acidity of catalysts
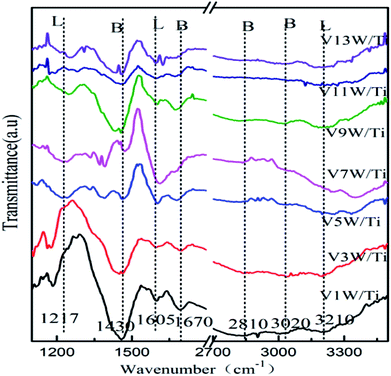
Surface acidity has a great influence on SCR reaction activity.42 The changes in the V4+/V5+ ratio caused by different loadings have great influence on the surface acidity in this catalytic system. The IR spectra of the VnW/Ti catalysts with NH3 adsorption at 50 °C are shown in Fig. 4. The peaks at 3210, 1605 and 1217 cm−1 are attributed to νs(N–H), δas(H–N–H) and δas(H–N–H), corresponding to adsorption of NH3 species on the Lewis acid sites of the catalyst surfaces, respectively. The peaks at 1430 and 1670 cm−1 are attributed to δas(H–N–H) and δs(H–N–H) and the peaks at 3020 and 2810 cm−1 are attributed to νs(N–H) and νas(N–H), corresponding to the adsorption of NH3 species on the Brønsted acid sites of the catalyst surfaces, respectively.42 Characteristic peaks in different catalysts may shift slightly, which reflects changes in the N–H bonding energy after NH3 adsorption.33,42 For clarification, all corresponding peak wavenumber values of VnW/Ti are shown in Table 2.| a a and b: pyrolysis peak. | |||||||
|---|---|---|---|---|---|---|---|
| Type | Brønsted acid site wavenumber (cm−1) | Lewis acid site wavenumber (cm−1) | |||||
| Vibration mode | νs(N–H) | νas(N–H) | δs(H–N–H) | δas(H–N–H) | νs(N–H) | δas(H–N–H) | δs(H–N–H) |
| V1W/Ti | 3038 | 2849 | 1695 | 1462 | 3212 | 1596 | 1185 |
| V3W/Ti | 3030 | 2849 | 1695 | 1458 | 3199 | 1599 | 1176 |
| V5W/Ti | 3021 | 2833 | 1678 | 1455a | 3251 | 1603 | 1230 |
| V7W/Ti | 3020 | 2825 | 1672 | 1451b | 3250 | 1609 | 1230 |
| V9W/Ti | 3011 | 2800 | 1672 | 1448 | 3232 | 1599 | 1246 |
| V11W/Ti | 3030 | 2825 | 1680 | 1462 | 3219 | 1596 | 1246 |
| V13W/Ti | 3032 | 2826 | 1681 | 1462 | 3216 | 1596 | 1229 |
The wavenumbers of all peaks corresponding to N–H bonds adsorbed on Brønsted acid sites decrease from V1W/Ti to V9W/Ti and increase from V9W/Ti to V13W/Ti, which indicates that the interaction strength of the N–H bonds of the NH3 species absorbed on the Brønsted acid sites decreases first and then increases. However, the changing trend of the wavenumbers of the peaks corresponding to N–H bonds adsorbed on the Lewis acid sites does not show obvious regularity. Combined with the Raman and XPS results, the interaction strength of the V![[double bond, length as m-dash]](https://www.rsc.org/images/entities/char_e001.gif) O bond increases with increasing V4+/V5+ ratio, resulting in enhanced interactions between V
O bond increases with increasing V4+/V5+ ratio, resulting in enhanced interactions between V![[double bond, length as m-dash]](https://www.rsc.org/images/entities/char_e001.gif) O and NH3 (V5+–O−⋯H⋯+NH3) and a decrease of the N–H stretching vibration of adsorbed NH3; therefore, the peak shifts to a lower wavenumber. When the vanadium loading exceeds 9%, crystalline V2O5 forms on the surface of the catalyst and the V4+/V5+ ratio begins to decrease. The V
O and NH3 (V5+–O−⋯H⋯+NH3) and a decrease of the N–H stretching vibration of adsorbed NH3; therefore, the peak shifts to a lower wavenumber. When the vanadium loading exceeds 9%, crystalline V2O5 forms on the surface of the catalyst and the V4+/V5+ ratio begins to decrease. The V![[double bond, length as m-dash]](https://www.rsc.org/images/entities/char_e001.gif) O stretching vibration is weak, resulting in a weakened link between V
O stretching vibration is weak, resulting in a weakened link between V![[double bond, length as m-dash]](https://www.rsc.org/images/entities/char_e001.gif) O and NH3; therefore, the N–H stretching vibration of adsorbed NH3 increases slightly.
O and NH3; therefore, the N–H stretching vibration of adsorbed NH3 increases slightly.
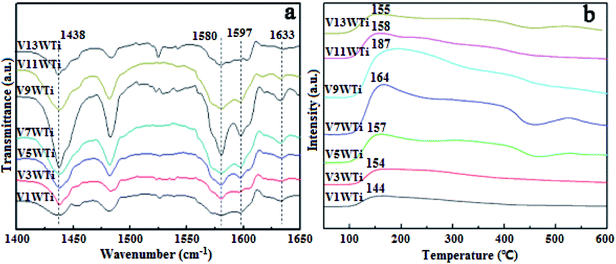
In order to further investigate the effects of changes in the V4+/V5+ ratio on the Brønsted acid and Lewis acid sites of the catalyst surface caused by different vanadium loadings, pyridine adsorption IR and NH3-TPD tests of the catalysts with different vanadium contents were performed. The infrared spectra of pyridine adsorbed on VnW/Ti with different vanadium contents at 50 °C are shown in Fig. 5(a), and the NH3-TPD spectra are shown in Fig. 5(b). The peaks at 1580 and 1633 cm−1 belong to Brønsted acid sites, and the peaks at 1597 and 1438 cm−1 are attributed to Lewis acid sites.45 The peak intensity increased first and then decreased with increasing vanadium content, and it reached the maximum value when the vanadium content was 9 wt%. The ratios of Brønsted acid and Lewis acid sites (B/L) calculated from the infrared characteristic peak areas, the numbers of acid sites per unit area and the total NH3 adsorption amounts calculated from the NH3-TPD peak areas are presented in Fig. 6. The results show that the numbers of B acid sites per unit area and the B/L values are in accordance with the NH3 adsorption capacity and reach the maximum value when the vanadium loading reaches 9%. At this point, the V9W/Ti catalyst exhibits the best catalytic activity. Correspondingly, the vanadium species on the support surface are in transition from the aggregation state to the crystalline state, and V4+/V5+ reaches the maximum value. The B/L and total amount of NH3 adsorption begin to decrease obviously in the catalysts with vanadium loadings of 11% and 13%. It can be inferred that the V4+/V5+ ratio is related to the number of B acid sites on the surface and that the formation of crystalline vanadium oxide has a negative effect on surface acidity. These results are consistent with previous tests. Interestingly, although the total amount of NH3 adsorption decreases, the amount of NH3 adsorbed and the L acid site per unit area continue to increase, which may be due to a large amount of crystallization of vanadium species on the support surface. In addition, this is related to a significant decrease in the specific surface area.
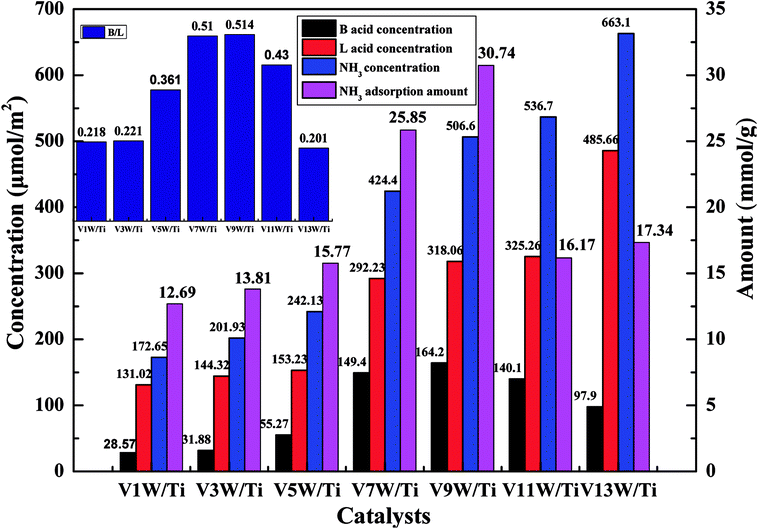 | ||
| Fig. 6 Numbers of acid sites per unit area and total amounts of NH3 for the VnW/Ti catalysts at 50 °C. | ||
Attack of NO + O2 on the adsorbed NH3 was studied as follows, and the in situ IR spectra of the VnW/Ti catalysts are shown in Fig. 7 and Fig. 8. The test conditions were an atmosphere of 1000 ppm NO and 5 vol% O2/Ar at various times after adsorption of 1000 ppm NH3/Ar at 200 °C for 30 min. Some peaks appeared after adsorption of NH3 at 3038, 2810, 1695, 1462 cm−1; these are attributed to V5+–O−⋯+H3N⋯H–O–V4+.43,44 The existence time of the transition state reflects the speed of the SCR reaction. Under attack of NO + O2, all the characteristic peaks disappeared gradually over time. NH3 adsorbed on V9W/Ti with the highest V4+/V5+ ratio exhibited the best catalytic performance, and no NH3 characteristic peaks could be observed after 5 min of reaction. This is consistent with the results of the activity tests below. For the V11W/Ti, V7W/Ti, V5W/Ti, V3W/Ti and V1W/Ti catalysts, the NH3 species were consumed completely after 9, 9, 10, 13 and 15 min, respectively. Therefore, the reactivity of adsorbed NH3 on the catalysts is in the order of V9W/Ti > V11W/Ti > V7W/Ti > V5W/Ti > V3W/Ti > V1W/Ti. In fact, macroscopic changes in the vanadium loading lead to microscopic changes in the V4+/V5+ ratio, regularly, and eventually indicate changes in the activation energy (Ea). Artificial regulation of vanadium loading to properly increase the V4+/V5+ content may replace the process of electron transfer between vanadium species, accelerating the disappearance of the transition state; this enhances the NH3-SCR reaction performance. The Ea for forming the transition state decreased as the vanadia loading amount increased and reached a minimum value for the V9W/Ti catalyst, which has the highest V4+/V5+ ratio; this indicates that the Brønsted acid sites on transition state vanadium enhance the reactivity of NH3. When crystalline V2O5 is formed on the catalyst surface, a large amount of V5+ appears and the V![[double bond, length as m-dash]](https://www.rsc.org/images/entities/char_e001.gif) O and V–O bonding energies decrease, resulting in weak interactions between the Brønsted acid sites (V5+–O–H) and NH3; therefore, the N–H stretching vibration of the adsorbed NH3 strengthens and, finally, Ea increases. It can be inferred that changes in the proportion of active components on the support surface profoundly affect the multiphase reaction process.
O and V–O bonding energies decrease, resulting in weak interactions between the Brønsted acid sites (V5+–O–H) and NH3; therefore, the N–H stretching vibration of the adsorbed NH3 strengthens and, finally, Ea increases. It can be inferred that changes in the proportion of active components on the support surface profoundly affect the multiphase reaction process.
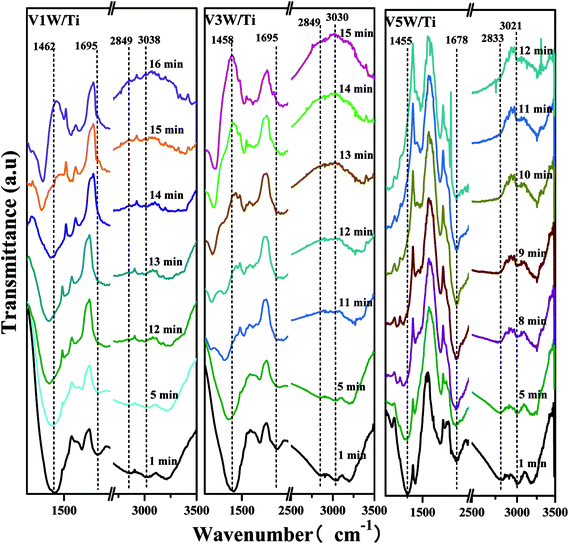 | ||
| Fig. 7 In situ IR spectra of the VnW/Ti (n = 1, 3, 5) catalysts under an atmosphere of 1000 ppm of NO and 5 vol% O2/Ar at different times after adsorption of 1000 ppm of NH3/Ar at 200 °C for 30 min. | ||
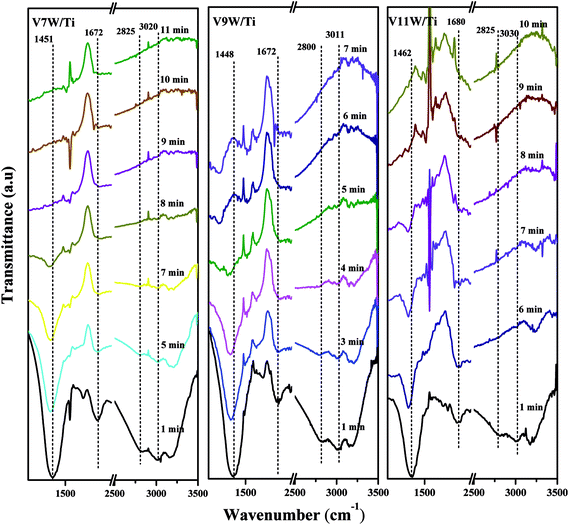 | ||
| Fig. 8 In situ IR spectra of the VnW/Ti (n = 7, 9, 11) catalysts under an atmosphere of 1000 ppm of NO and 5 vol% O2/Ar at different times after adsorption of 1000 ppm of NH3/Ar at 200 °C for 30 min. | ||
3.4 Redox properties of the catalysts
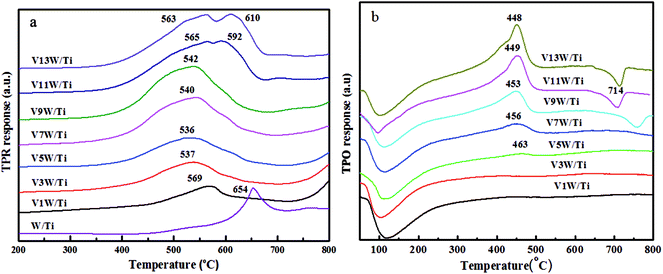
It has been reported29 that the oxidative dehydrogenation of ammonia species adsorbed by vanadia species is a key step in the SCR reaction. To investigate the redox capacity of vanadium ions with changing V4+/V5+ ratio, temperature programmed reduction (H2-TPR) and temperature programmed oxide (O2-TPO) spectra were obtained and are shown in Fig. 9.The peaks at 536 °C to 610 °C are ascribed to the reduction of vanadia, corresponding to the reduction of V5+ to V3+ and of V4+ to V3+.38,46 The stability of V2O3 did not decrease even at a higher temperature.47 The reduction temperature moves in the direction of low temperature from V1W/Ti to V5W/Ti and moves in the direction of high temperature in the range of V7W/Ti to V13W/Ti. The high dispersion of vanadium species with a small amount of V4+ on the support surface enhances the interaction between the vanadium species and the support. Therefore, the reduction temperature is higher. When the vanadium content is less than 5%, with increasing vanadium loading, the interaction between the vanadium species gradually strengthens and the interaction between vanadium and support weakens. This leads to a gradual decrease in the reduction temperature. When the vanadium loading is higher than 5%, the V4+/V5+ ratio increases significantly and polymeric and crystalline vanadia species, which are difficult to reduce, form on the support surface,48,49 resulting in an increase in the reduction temperature; this is consistent with the Raman results. In addition, two reduction peaks appear in the catalysts with 11 wt% and 13 wt% vanadium loading amounts; these correspond to the reduction of dispersed, polymeric and crystalline vanadia species50 coexisting on the catalyst surface,51 respectively. It must be noted that this change in the dispersion status is consistent with the trend of V4+/V5+. Moreover, tungsten oxide is difficult to reduce; the reduction peak of WO3 appears at around 654 °C in W/TiO2, but it does not appear at the same temperature position in the VnW/Ti catalyst. We believe that the reduction peak of WO3 in the VnW/Ti catalyst moves toward a higher temperature. This may be due to the interaction between vanadium and tungsten species.
The TPO results further illustrate that the vanadia species on the catalyst surface have been reduced to V2O3,46 as shown in Fig. 9(b). Therefore, the peaks at 448 °C to 463 °C belong to the oxidation of V2O3, corresponding to the oxidation of V3+ to V4+ and then to V5+.49 The peak at around 100 °C may be caused by residual water. When the loading amount of vanadium oxide increases from 1 wt% to 5 wt%, strong interactions between the highly dispersed vanadium oxide and the support result in a broader oxidation peak, and no maximum oxidation peak appears. A large number of aggregated vanadium oxides form when the vanadium oxide loading amount exceeds 5 wt%; therefore, the amount of V2O3 on the catalyst surface increases after H2-TPR under these conditions. The oxidation peak temperature decreases due to the weakened interactions between vanadium and the support. The decreased peak at 714 °C is attributed to the restraint of melting V2O5 to oxygen diffusion on the catalyst surface when the vanadium oxide loading amount exceeds 9 wt%. In order to more clearly analyze the redox properties of a series of catalysts, quantitative analysis of the TPR and TPO results has been further conducted as follows.
The H2 and O2 consumption and the oxidation and reduction rates (νTPO and νTPR, respectively) of the catalysts are listed in Table 3. The increased H2 and O2 consumption is due to the continuous addition of vanadium species to the support surface. For the reduction process, the dispersed vanadium species on the catalyst surface are difficult to reduce at low vanadium loadings due to the strong interactions between vanadium and the support. This interaction weakens as the vanadium loading increases, and the reduction rate improves during this process. The oxidation process is similar to the reduction process. The increase of the reduction rate is faster than that of the oxidation rate at low loading amounts; however, the two are exactly opposite at high loading amounts due to the appearance of polymeric or crystalline vanadia when the loading amount of vanadium oxide exceeds 9 wt%. This result is coincident with the previous conclusion49 that crystalline and polymeric vanadia are difficult to reduce but readily oxidized after reduction, while dispersive vanadia is readily reduced but difficult to oxidize after reduction.
| Sample | Consumption (μmol g−1) | N (mol m−2 s−1) × 10−9 | Ea (kJ mol−1) | ||
|---|---|---|---|---|---|
| H2 | O2 | νTPR | νTPO | ||
| V1W/Ti | 289 | 165 | 2.37 | 0.95 | 25.1 |
| V3W/Ti | 523 | 200 | 3.70 | 1.23 | 21.7 |
| V5W/Ti | 710 | 220 | 4.62 | 1.42 | 21.4 |
| V7W/Ti | 958 | 308 | 7.55 | 2.13 | 20.5 |
| V9W/Ti | 1120 | 416 | 8.65 | 2.92 | 15.7 |
| V11W/Ti | 1150 | 605 | 8.82 | 7.68 | 16.1 |
| V13W/Ti | 1180 | 652 | 1.10 | 1.01 | 16.6 |
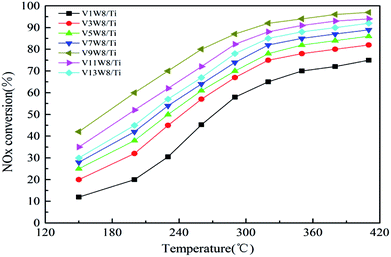
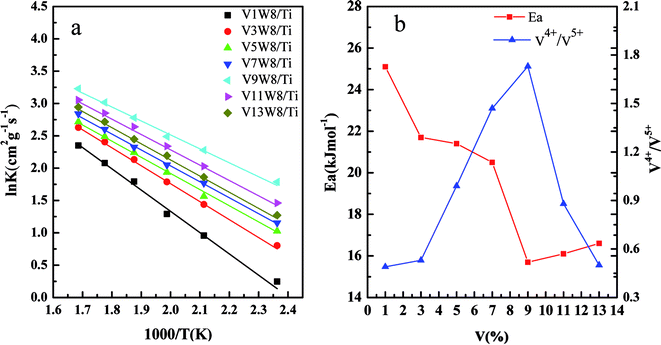
3.5 DeNOx activity and macrokinetics
Fig. 10 shows the deNOx activities of the VnW/Ti catalysts and Fig. 11 shows the Arrhenius plots of the intrinsic reaction rate constants, the V4+/V5+ ratios and the Ea values of the VnW/Ti catalysts. With increasing vanadium loading, the content of vanadium species with different valencies increases; however, the SCR performance does not always improve. The catalytic activity shows a regular change, increasing first and then decreasing, which is related to the V4+/V5+ ratio. When the loading reaches 9%, the deNOx activity is the best; meanwhile, the V4+/V5+ ratio reaches the maximum value.The deNOx reaction macrokinetics for the VnW/Ti catalyst were determined to realize the intrinsic effects of the V4+/V5+ ratio on the catalyst activity. In order to avoid diffusion effects on the catalytic activity, steady-state conditions experiments were carried out at a high space velocity of 300![[thin space (1/6-em)]](https://www.rsc.org/images/entities/char_2009.gif) 000 h−1 in the temperature range of 150 °C to 320 °C.
000 h−1 in the temperature range of 150 °C to 320 °C.
The NH3-SCR reaction on a VnW/Ti catalyst is normally regarded as a first order reaction with respect to NO.52–54 The rate equation is r = kcNO and the rate constant can be described by eqn (3)–(5):
 | (3) |
−Va![[thin space (1/6-em)]](https://www.rsc.org/images/entities/char_2009.gif) ln(1 − xNO) = kNO ln(1 − xNO) = kNO
| (4) |
 | (5) |
Fig. 11(a) shows the Arrhenius plots based on the reaction rate data, and the Ea values were determined from the plots (Table 2). Fig. 11(b) shows the relationship between the V4+/V5+ ratios of the VnW/Ti catalysts and their Ea values. As shown in Fig. 11(b), the value of Ea has a tendency to increase initially and then decrease with increasing vanadia loading. Also, it reaches the minimum when the content of vanadia is 9 wt%. Accordingly, in Fig. 11(b), the value of Ea has the same tendency with the variation of the V4+/V5+ ratio, where Ea increases initially and then decreases with changing V4+/V5+ ratio and reaches the minimum when the V4+/V5+ ratio is the maximum. Furthermore, the catalyst with 9 wt% vanadia loading amount shows the highest deNOx activity, which indicates that increasing the V4+/V5+ ratio can decrease the Ea and enhance the deNO activity.
4 Conclusion
In this study, the contents of vanadium with different valencies on a support surface have been controlled by adjusting the vanadium loading; also, the relationship between the V4+/V5+ ratio and vanadium dispersion on the support surface, the concentration of chemically adsorbed oxygen, the surface acidity and the catalytic activity has been established. Although the contents of V4+ and V5+ gradually increase during the addition of vanadium, the catalytic activity shows a highly regular change. Changing the ratio of V4+/V5+ is a key factor in controlling the catalytic activity than the absolute contents of V4+ and V5+. When the loading reaches 9%, the deNOx activity is the best; meanwhile, the V4+/V5+ ratio reaches the maximum value and the appearance energy (Ea) required for forming the SCR reaction transition state is the lowest. In addition, the change trend of V4+/V5+ is very close to the variation trend of the dispersion state of the vanadium species, the concentration of chemically adsorbed oxygen and the surface acidity. Different ratios of V4+/V5+ represent different dispersion states of vanadium species, and changes in this ratio affect the interactions between V, W, O and Ti atoms; this is the main reason why the best catalytic activity is observed when the V4+/V5+ ratio reaches its maximum value.Conflicts of interest
The authors declare no conflicts of interest.Abbreviations
| NH3-SCR | Selective catalytic reduction |
| XRD | X-ray diffraction |
| XPS | X-ray photoelectron spectroscopy |
| H2-TPR | H2 temperature programmed reduction |
| O2-TPO | O2 temperature programmed oxidation |
| Ea | Apparent activation energy |
Acknowledgements
This work was supported by the Fundamental Research Funds for the Central Universities (No. HEUCF20151016), Heilongjiang Province Science Foundation Project Plan (Grant No. E2017027), the Fundamental Research Funds for the Central Universities of Harbin Engineering University (Grant No. HEUCFP201802) and Advanced Technique Project Funds of the Manufacture and Information Ministry.Notes and references
- G. Busca, M. A. Larrubia and L. A. G. Ramis, Catal. Today, 2005, 107, 139–148 CrossRef.
- G. Busca, L. Lietti, G. Ramis and F. Berti, Appl. Catal., B, 1998, 18, 1–36 CrossRef.
- P. Forzatti, I. Nova, E. Tronconi, A. Kustov and J. R. Thøgersen, Catal. Today, 2012, 184, 153–159 CrossRef.
- L. Gan, J. Chen, Y. Peng, J. Yu, T. Tran, K. Li, D. Wang, G. Xu and J. Li, Ind. Eng. Chem. Res., 2018, 57, 150–157 CrossRef.
- Z. Liu, S. Zhang, J. Li, J. Zhu and L. Ma, Appl. Catal., B, 2014, 158–159, 11–19 CrossRef.
- Z. Ma, X. Wu, Y. Feng, Z. Si, D. Weng and L. Shi, Prog. Nat. Sci.: Mater. Int., 2015, 25, 342–352 CrossRef.
- S. Djerad, L. Tifouti, M. Crocoll and W. Weisweiler, J. Mol. Catal. A: Chem., 2004, 208, 257–265 CrossRef.
- S. B. Kristensen, A. J. Kunov-Kruse, A. Riisager, S. B. Rasmussen and R. Fehrmann, J. Catal., 2011, 284, 60–67 CrossRef.
- G. W. Coluston, S. R. Bare, H. Kung, K. Birkeland, G. K. Bethke, R. Harlow, N. Herron and P. L. Lee, Science, 1997, 275, 191–193 CrossRef.
- G. Centi, F. Trifiro, J. R. Ebner and V. M. Franchetti, Chem. Rev., 1988, 88, 55–80 CrossRef.
- M. P. House, A. F. Carley and M. Bowker, J. Catal., 2007, 252, 88–96 CrossRef.
- Y. Cai and U. Ozkan, Appl. Catal., 1991, 78, 241–255 CrossRef.
- J. Due-Hansena and S. B. Rasmussen, Appl. Catal., B, 2011, 107, 340–346 CrossRef.
- G. C. Bond and S. F. Tahir, Appl. Catal., 1991, 71, 1–31 CrossRef.
- G. Deo and I. E. Wachs, J. Catal., 1994, 146, 323–334 CrossRef.
- I. E. Wachs, G. Deo, B. M. Weckhuysen, A. Andreini, M. A. Vuurman, M. De Boerand and M. D. Amiridis, J. Catal., 1996, 161, 211–221 CrossRef.
- S. T. Choo, Y. G. Lee, I. S. Nam, S. W. Ham and J. B. Lee, Appl. Catal., A, 2000, 200, 177–188 CrossRef.
- G. T. Went, L. J. Leu and A. T. Bell, J. Catal., 1992, 134, 479–491 CrossRef.
- G. T. Went, L. J. Leu and A. T. Bell, J. Catal., 1992, 134, 492–505 CrossRef.
- G. J. Dong, Y. Zhao and Y. F. Zhang, J. Fuel Chem. Technol., 2014, 42, 1093–1101 CrossRef.
- G. J. Dong, Y. Bai, Y. F. Zhang and Y. Zhao, New J. Chem., 2015, 39, 3588–3596 RSC.
- M. J. Lázaro, A. Boyano, C. Herrera, M. A. Larrubia, L. J. Alemany and R. Moliner, Chem. Eng. J., 2009, 155, 68–75 CrossRef.
- I. E. Wachs and C. A. Roberts, Chem. Soc. Rev., 2010, 39, 5002–5017 RSC.
- M. A. Vuurman, I. E. Wachs and A. M. Hirt, J. Phys. Chem., 1991, 95, 9928–9937 CrossRef.
- A. Khodakov, B. Olthof, A. T. Bell and E. Iglesia, J. Catal., 1999, 181, 205–216 CrossRef.
- G. T. Went, S. T. Oyama and A. T. Bell, J. Phys. Chem., 1990, 94, 4240–4246 CrossRef.
- I. Giakoumelou, C. Fountzoula, C. Kordulis and S. Boghosian, J. Catal., 2006, 239, 1–12 CrossRef.
- G. C. Bond, Appl. Catal., A, 1997, 157, 91–103 CrossRef.
- F. Tang, K. Zhuang, F. Yang, L. Yang, B. Xu, J. Qiu and Y. Fan, Chin. J. Catal., 2012, 33, 933–940 CrossRef.
- G. Dong, Y. Zhang, Y. Zhao and Y. Bai, New J. Chem., 2015, 39(5), 3588–3596 RSC.
- E. I. Wachs and M. B. Weckhuysen, Appl. Catal., A, 1997, 157, 67–90 CrossRef.
- K. Cheng, J. Liu, T. Zhang, J. M. Li, Z. Zhao, Y. C. Wei, G. Y. Jiang and A. J. Duan, J. Environ. Sci., 2014, 26, 2106–2133 CrossRef PubMed.
- G. J. Fang, K. L. Yao and Z. L. Liu, Thin Solid Films, 2001, 394, 63–70 CrossRef.
- M. Najbar, E. Broclawik, A. Gora, J. Camrac, A. Białas and A. Wesełucha-Birczyńska, Chem. Phys. Lett., 2000, 325, 330–339 CrossRef.
- E. Broclawik, A. Gora and M. Najbar, J. Mol. Catal. A: Chem., 2001, 166, 31–38 CrossRef.
- M. A. Eberhardt, A. Proctor, M. Houalla and D. M. Hercules, J. Catal., 1996, 160, 27–34 CrossRef.
- M. Demeter, M. Neumann and W. Reichelt, Surf. Sci., 2000, 454, 41–44 CrossRef.
- P. G. W. A. Kompio, A. Brückner, F. Hipler, G. Auer, E. Löffler and W. Grünert, J. Catal., 2012, 286, 237–247 CrossRef.
- S. L. Zhang and Q. Zhong, J. Mol. Catal. A: Chem., 2013, 373, 108–113 CrossRef.
- M. Najbar, E. Broclawik, A. Góra, J. Camra, A. Bialas and A. Weselucha-Bircayńska, Chem. Phys. Lett., 2000, 325, 330 CrossRef.
- C. Liang and J. Li, Chem. Eng. J., 2011, 170, 531–537 CrossRef.
- M. A. Centeno, I. Carrizosa and J. A. Odriozola, Appl. Catal., B, 2001, 29, 307–314 CrossRef.
- N.-Y. Topsoe, Science, 1994, 265, 1217–1219 CrossRef PubMed.
- N.-Y. Topsoe and J. A. Dumesic, J. Catal., 1995, 151, 241–252 CrossRef.
- S. Yamazoe, Y. Masutani, K. Teramura, Y. Hitormi, T. Shishido and T. Tanaka, Appl. Catal., B, 2008, 83, 123–130 CrossRef.
- W. C. Yu, X. D. Wu, Z. C. Si and D. Weng, Appl. Surf. Sci., 2013, 283, 209–214 CrossRef.
- F. Klose, T. Wolff, H. Lorenz, A. Seidel-Morgenstern, Y. Suchorski, M. Piórkowska and H. Weiss, J. Catal., 2007, 247, 176–193 CrossRef.
- C. Z. Wang, S. J. Yang, H. Z. Chang, Y. Peng and J. H. Li, Chem. Eng. J., 2013, 225, 520–527 CrossRef.
- S. Besselmann, C. Freitag, O. Hinrichsen and M. Muhler, Phys. Chem. Chem. Phys., 2001, 3, 4633–4638 RSC.
- A. Khodakov, B. Olthof, A. T. Bell and E. Iglesia, J. Catal., 1999, 181, 205–216 CrossRef.
- X. D. Wu, W. C. Yu, Z. C. Si and D. Weng, Front. Environ. Sci. Eng., 2013, 7, 420–427 CrossRef.
- X. Guo, C. Bartholomew, W. Hecker and L. L. Baxter, Appl. Catal., B, 2009, 92, 30–40 CrossRef.
- J. P. Chen and R. T. Yang, Appl. Catal., A, 1992, 80, 135–148 CrossRef.
- K. Kamasamudram, N. W. Currier, X. Chen and A. Yezerets, Catal. Today, 2010, 151, 212–222 CrossRef.
| This journal is © The Royal Society of Chemistry 2018 |

