 Open Access Article
Photodegradation of spent wash, a sugar industry waste, using vanadium-doped TiO2 nanoparticles†
Shrikant P. Taklea,
Sonali D. Naika,
Supriya. K. Khorea,
Siddhanath A. Ohwala,
Namdev M. Bhujbalb,
Sukeshani L. Landgeb,
Bharat B. Kale a and
Ravindra S. Sonawane
 *a
*a
aCentre for Materials for Electronics Technology, Government of India, Panchavati, Off Pashan Road, Pune 411008, India. E-mail: sonawaner@yahoo.com; sonawane@cmet.gov.in
bAnnasaheb Magar College, Hadapsar, Pune 411028, India
First published on 4th June 2018
Abstract
Waste from the sugar cane industry and alcohol distilleries is one of the sources of water pollution, and the degradation of this effluent is a very challenging task. Photocatalytic degradation can be an attractive alternative to conventional degradation processes. A vanadium-doped TiO2 (V-TiO2) photocatalyst for the degradation of spent wash and industrial dyes has been studied and reported here. V-doped TiO2 nanoparticles were prepared using a sol–gel method based on aqueous titanium peroxide with titanium isopropoxide as the Ti precursor and V2O5 as the V precursor. In order to observe the effect of the dopant on sol–gel behaviour, physicochemical and structural properties, the concentration of V was varied between 1.0% and 5% by weight. The crystallization temperature and time were optimized to obtain the required phase of V-TiO2. The physicochemical and structural characteristics of the V-doped TiO2 catalyst were determined using Brunauer–Emmett–Teller (BET), X-ray diffraction, FESEM, TEM, TG, FT-IR, Raman, PL and UV-visible spectroscopic techniques. UV-visible analysis showed a red shift in the absorption edge of TiO2 upon doping with V metal, which suggested an increase in the absorption of visible light due to a decrease in the effective band gap. The application potential of the V-TiO2 catalyst was studied via the degradation of sugar industry waste (spent wash) and Jakofix red dye (HE 8BN) under natural sunlight, as well as a standard artificial solar energy source (Xe lamp). The highest activity was observed for a 1% V-TiO2 photocatalyst for the degradation of spent wash and Jakofix red dye under natural sunlight. The degradation of coloured compounds in spent wash was monitored by gel permeation chromatography (GPC), which showed the degradation of high-molecular-weight compounds into low-molecular-weight fractions. The catalyst decomposed 90% of Jakofix red dye (HE 8BN) in 3.5 h and 65% of spent wash in 5 h under irradiation with natural sunlight, whereas Degussa P-25 TiO2 was only able to decompose 35% of the dye and 20% of spent wash under identical reaction conditions. A cycling stability test showed the high stability and reusability of the photocatalyst for degradation reactions, with a recovery of around 94–96%.
1. Introduction
Waste from the sugar cane distillery industry is one of the sources of aquatic pollution, and this industry generates large volumes of high-strength waste water containing molasses, which has unmanageable properties. The intense colour of the spent wash effluent leads to acute ecological problems when it is released in untreated form into the environment. Currently, anaerobic and aerobic as well as physicochemical methods have been employed to treat this effluent. The decolourisation of effluent generated by sugar cane distilleries involves large amounts of dark brown waste water, which is known as molasses spent wash (MSW). MSW is an undesirable residual liquid waste, and many distilleries dispose of it without treatment into nearby uncultivated land, rivers and lakes. The highly acidic pH, intense dark brown colour, high ash content, unpleasant odour and high percentage of organic and inorganic matter make it difficult to convert MSW into less toxic waste at an affordable cost, and hence industries prefer to dispose of it in untreated form. As a result, the disposal of this effluent is a critical environmental issue. The dark brown colour is due to the presence of melanoidin, caramel, alkaline degradation products and polyphenols, etc. These colorants are actually concentrated in molasses after the crystallization of sugar and are further transferred to the spent slurry during the fermentation of molasses. Melanoidin is a natural condensation polymer of sugars and amino acids and is produced by non-enzymatic browning reactions known as Maillard reactions. It decreases the penetration of sunlight into rivers and lakes, which in turn decreases both photosynthetic activity and dissolved oxygen concentrations, which affects aquatic life. Melanoidin remains at levels of about 2% in molasses-based distillery effluent as a major recalcitrant coloured pollutant together with metals and phenolics. It is hardly degraded by microbes and behaves as an anionic hydrophilic polymer that has a high tendency to bind with metal cations, which results in an effluent with a more complex nature. Moreover, phenolics present in effluent form more complex compounds with heavy metals. This effluent is widely discharged in huge amounts as an environmental pollutant by various agriculturally based industries, especially from distilleries and fermentation-based industries. Hence, its degradation prior to discharge is essential for environmental safety. Considering the intensity of the problem, many researchers have paid attention to addressing the issue of environmental pollution due to molasses. Removal of the colour of spent wash by adsorption on activated charcoal and electrocoagulation was studied by Bhise et al. and Satyawali et al.1,2 Photocatalytic removal of colour and COD in distillery effluent by solar radiation was studied by Vineetha et al.3 Decolourization of spent wash using a nano-Al2O3/kaolin photocatalyst was studied by David et al.4 However, the researchers only reported a change in the colour of spent wash after irradiation with artificial solar light. There might be a possibility of the adsorption of colorants on the surface of the photocatalyst, which resulted in a decrease in colour rather than actual degradation, as details of the degradation products and mechanism were not reported in this study. The degradation of molasses by a nanocrystalline composite material was studied by Navgire et al.5 Various effective physical and chemical methods such as ozonation, flocculation and adsorption on activated carbon, etc., have been investigated for the removal of colour from biomethanated distillery spent wash. Although these techniques are widely used for the degradation of spent wash and other harmful dyes, researchers are working on new and environment-friendly techniques.The degradation of organic pollutants using a TiO2 photocatalyst has been extensively studied as a relatively new technique for pollution abatement owing to the desirable properties of the catalyst, such as non-toxicity, a wide band gap, and stability in acidic as well as basic media.6–8 However, the wide band gap of TiO2 means that it only absorbs light with a wavelength of less than 400 nm in the UV region, which restricts its application to uses in the presence of UV irradiation. For extensive application, a TiO2-based catalyst that is effective in visible radiation or solar light needs to be developed as a future-generation photocatalytic material. TiO2 absorbs only 5% of the energy of the solar spectrum, and hence numerous studies have been performed to extend its photoresponse and photocatalytic activity by modifying its surface structure, surface properties and composition to shift its absorption into the visible region so as to improve its photocatalytic activity in visible/solar light.9–11 Surface modification by doping with metal ions and organic polymers has been proven to be an efficient route to improve the photocatalytic activity of TiO2.12–15 Vanadium oxide (VOx) supported on various supports has been widely used for the reduction of nitrogen oxides (NOx)16–18 and selective oxidation of volatile organic compounds (VOC).19–26 Anpo et al. have studied the doping of TiO2 with transition metals such as V, Cr and Fe by three different methods: sol–gel, co-precipitation and ion implantation techniques.27–30 The higher photocatalytic activity of vanadia-doped TiO2 prepared by ion implantation was related to the deep incorporation of vanadia into the titanium oxide lattice due to the bombardment of TiO2 targets with highly energetic vanadium ions. Vanadium as a dopant extends the absorption edge of TiO2 to the visible-light region (>400 nm).12,31,32 This extension is achieved by forming intermediate energy levels. Vanadium as a dopant is also known to promote the phase transformation of TiO2 from anatase to rutile.33 Pure TiO2 undergoes an anatase-to-rutile phase transformation in the range of 400–1200 °C, depending on the preparation method.34 Doping with vanadium can decrease the transition temperature by as much as 450 °C (from 1100 to 650 °C).35 In this study, we report the synthesis of vanadium-doped mesoporous anatase TiO2 materials. In an attempt to alter the optical properties of TiO2, doping of thin titania films with Fe and Au was successfully demonstrated in our earlier work to shift the absorption of TiO2 into the visible region and improve the photocatalytic activity of TiO2 under sunlight.36–38 Thin films of vanadia-doped titania were deposited by simple dip-coating techniques using vanadium and titanium peroxide gel on various glass substrates and used for the photocatalytic degradation of MB and formaldehyde. In continuation of our efforts to study the application potential of V-TiO2 for the degradation of other harmful substances, we used V-TiO2 for the degradation of spent wash, i.e., waste from the sugar distillery industry, and Jakofix red (HE 8BN) dye. The electrochemical decolourization and biodegradation of an electrochemically decolourised dye were studied by Sathishkumar et al.39 and Yadav et al.40 Treatment of distillery spent wash by ozonation and biodegradation and the significance of pH reduction and the removal of inorganic carbon were reported by Kumar et al.41 The use of an AFBBR and an adsorption technique for the treatment of spent wash colour was studied by Lakshmikanth et al.42 Although many processes have been employed for the decolourization of spent wash, each process has its own advantages and disadvantages. Many processes are costly and economically unviable. The search for new and effective methods is under way, and many researchers are working in this direction. Considering the above factors, we attempted to use V-TiO2 for the degradation of spent wash under natural sunlight reaching the earth's surface.
In this paper, the preparation of a V-TiO2 catalyst by a non-polluting sol–gel method based on an aqueous peroxide is reported. Samples were characterized by XRD, FE-SEM, TEM, TG, FT-IR, Raman, PL and UV-vis absorption spectroscopy. The photocatalytic activity of sol–gel vanadium-doped TiO2 for the degradation of spent wash and Jakofix red dye (HE 8BN) was studied, and the results are reported here. Degradation trials conducted on the laboratory scale showed very promising results and suggested that this photocatalyst is a potential candidate for this application. Although the results that are reported are valid on the laboratory scale, the experimental data that were generated can be used for actual field trials. In field trials the conditions are different, and the reaction parameters therefore need to be optimized again by considering the local conditions. In laboratory-scale experiments, diluted spent wash was used for degradation reactions under natural sunlight rather than an artificial energy source. This method is only effective for diluted samples of spent wash, as the penetration of sunlight may be restricted by the intense colour of concentrated spent wash, which ultimately affects the rate of the degradation reaction. This is the only limitation of this photocatalytic method and can be overcome by recycling the water discharged from a waste water treatment plant and other sources. Water from different sources within a distillery, such as water discharged from the effluent treatment plant, waste water remaining after the cleaning of sugar cane, and water used for cooling, can be reused for the dilution of spent wash to make the process more professional and feasible. The main advantages of this method over other methods are its negligible or no requirement for external energy, low cost and high stability of the photocatalyst, use of abundantly available sunlight and generation of less harmful products with no environmental pollution. In addition, a much smaller amount of the photocatalyst is required for this process, and it can be reused for many degradation cycles. The main advantage of our method is that it is very cheap and more cost-effective than other methods that have been reported and are currently in use. These qualities make the process more attractive and economically viable than other methods already employed for the degradation of spent wash.
2. Experimental methods
2.1. Materials and reagents
The chemicals and raw materials were used as received without further treatment/purification. Titanium(IV) tetraisopropoxide (Ti(OCH(CH3)2)4) was from Acros Organics, and 30% (w/w) hydrogen peroxide (H2O2) and vanadium pentoxide (V2O5) were from Merck India Ltd. Milli-Q water was used (conductivity of <10 Ω−1 cm−1). P-25 TiO2 (Degussa) was imported and supplied by a local supplier, namely, M. M. Suppliers, Pune, India.2.2. Preparation of catalysts
A series of V-doped TiO2 catalysts with V contents ranging from 1 to 2, 3, 4 and 5 wt% were prepared by an aqueous sol–gel technique using vanadium pentoxide as the vanadium(V) precursor and titanium isopropoxide as the titanium precursor. In a typical synthesis, 4.02 g of titanium isopropoxide (Aldrich) was hydrolysed using 30 mL of Milli-Q water (conductivity of <10 Ω−1 cm−1). Aqueous hydrogen peroxide (30%, Merck) was added to produce a transparent orange sol of titanium peroxide. Vanadium pentoxide (71.90 mg for 1.0% V-TiO2, and so on) (V2O5) (Merck) was suspended in 20 mL of Milli-Q water, and 3 mL of 30% aqueous hydrogen peroxide was added to give a clear red solution of peroxovanadic acid. This solution was added to the titanium peroxide solution with stirring for 30 min. The mixture of both sols was slowly converted into a transparent orange-yellow viscous gel. The vanadia-titanium peroxide gel was dried at ambient temperature to give a powder. The dry powder was then heated in a hot air oven at 110 °C, followed by calcination at 400 °C under a static air flow in a muffle furnace. The heating/cooling rate was 5 °C min−1, with a dwell time of 4 h at the selected temperature. Pure TiO2 was also prepared similarly by the sol–gel technique using a peroxide precursor for comparison.2.3. Characterization techniques
An X-ray diffraction (XRD) study was performed using a Bruker D8 Advance AXS diffractometer (Cu Kα radiation, λ = 1.5406 Å) with an operating voltage of 40 kV and a current of 44 mA. Data were collected in the 2θ range of 20–80° with a step size of 0.028° and a counting time of 15 s for each step. Diffuse-reflectance UV-vis spectra (DRS) were recorded in the range of 200–800 nm with a spectral resolution of 0.5 nm in air at ambient temperature using a Shimadzu UV-3600 spectrophotometer. Powder samples were mixed with barium sulphate powder (NIST traceable) and pressed into the sample holder for UV-visible measurements. Raman spectra were recorded using a Raman microscope (Renishaw 2000) using a wavelength of 532 nm, an exposure time of 16 seconds, and an accumulation number of 4. FT-IR spectra of samples were recorded using a PerkinElmer Spectrum Two U-ATR instrument. Thirty-two scans were performed with a spectral resolution of 4 cm−1 in the range of 4000–450 cm−1. The thermal stability and behaviour of samples were analysed using a TG/DTA instrument (Mettler Toledo) with a heating rate of 50 °C min−1 in an air atmosphere. The surface areas of samples were determined by the Brunauer–Emmett–Teller (BET) method using a Micromeritics Gemini VII analyzer. The pore size distribution was calculated via the Barrett–Joyner–Halenda (BJH) method from the desorption isotherm. Prior to the measurements, the powder samples were degassed using UHP grade nitrogen gas at 150 °C for 2 h. The surface morphology and microstructure were analysed using an FESEM instrument. For these measurements, powder samples were initially sonicated in ethanol using an ultrasonic bath and then drop-cast onto carbon tape. HRTEM measurements were performed with a JEOL instrument operated at an accelerating voltage of 300 kV. Samples for HRTEM analysis were prepared by vacuum-drying drop-cast solutions of TiO2 nanoparticles on carbon-coated copper grids. Image processing and calculations of interplanar distances (d) were performed with the help of Gatan Micrograph software. TOC measurements were performed with a Shimadzu TOC-VSCH analyser. Powder samples of equal weights were used for PL measurements (Horiba Fluorolog-3 spectrofluorometer). The widths of the entrance and exit slits were kept the same.3. Photocatalytic study
3.1. Photocatalytic decomposition of spent wash (SW) and Jakofix HE 8BN dye
The photocatalytic activity of the prepared photocatalyst was tested in the degradation of industrial waste, namely, spent wash (alcohol-based sugar industry) and Jakofix red (HE 8BN) dye (textile industry) using a 100 mL quartz reactor with a water circulation arrangement to maintain a constant temperature. Solutions of spent wash (10 g L−1 in water) and Jakofix dye (100 ppm) were used as the contaminants. A suspension was prepared by mixing 0.025 g V-TiO2 photocatalyst with 100 mL of spent wash (10![[thin space (1/6-em)]](https://www.rsc.org/images/entities/char_2009.gif) 000 ppm) or Jakofix dye (100 ppm). Before exposure to light, the suspension was kept in the dark for 1 h to attain adsorption–desorption equilibrium. For the photocatalytic degradation of spent wash and Jakofix red dye, powder samples of V-TiO2 were used as a photocatalyst. The suspension was then irradiated in ambient conditions with natural solar light during sunny days (from March to May) between 10 am and 4 pm at Pune, which is located in Maharashtra state, India, for stipulated times. At regular intervals, samples were collected and allowed to settle for 20 min to separate the photocatalyst particles, and the supernatant solution was analyzed using a UV-visible spectrophotometer (Cary 100). Prior to the photocatalytic measurements, the UV-visible instrument was calibrated with solutions of spent wash and Jakofix dye of known concentrations.
000 ppm) or Jakofix dye (100 ppm). Before exposure to light, the suspension was kept in the dark for 1 h to attain adsorption–desorption equilibrium. For the photocatalytic degradation of spent wash and Jakofix red dye, powder samples of V-TiO2 were used as a photocatalyst. The suspension was then irradiated in ambient conditions with natural solar light during sunny days (from March to May) between 10 am and 4 pm at Pune, which is located in Maharashtra state, India, for stipulated times. At regular intervals, samples were collected and allowed to settle for 20 min to separate the photocatalyst particles, and the supernatant solution was analyzed using a UV-visible spectrophotometer (Cary 100). Prior to the photocatalytic measurements, the UV-visible instrument was calibrated with solutions of spent wash and Jakofix dye of known concentrations.
3.2 Adsorption and recovery test
A 25 mg sample of a solution of Jakofix red dye (HE 8BN) was used to determine the adsorption ratio in dark conditions. The adsorption ratio was calculated from the ratio of the concentration of the dye after adsorption (C) to the original concentration of the dye (C0). For the recovery test, 100 mg 1% V-TiO2 catalyst was mixed with 25 mL of the 100 ppm dye solution and kept in the dark for 1 h with continuous stirring. The suspension was then irradiated for 3.5 h and centrifuged, and the supernatant liquid was removed by decantation. The photocatalyst was then washed with 25 mL ethanol and separated by centrifugation for 10 min at 5000 rpm. The separated photocatalyst was then dried at 100 °C in an oven and weighed using an electronic balance. The same process was repeated for second and third cycles. The amount of catalyst (mg) recovered after each cycle was plotted versus the number of use cycles to get an idea of the loss and recovery of the photocatalyst after each cycle.3.3. Stability test
The cycling stability of the photocatalyst was tested by repeating the photocatalytic degradation of Jakofix red dye (HE 8BN) several times under identical conditions. In the first cycling experiment, 25 mg V-TiO2 photocatalyst was suspended in the 100 ppm dye solution, and the reaction mixture was irradiated for 3 h with natural sunlight. The degradation products were analysed by monitoring the reaction using a UV-visible spectrophotometer. The photocatalyst was separated by centrifugation and dried at 100 °C before reuse for the second cycling experiment. Before the second cycling experiment, an airtight photoreactor was kept in the dark and de-aerated by purging with high-purity N2 gas. The dye solution together with the photocatalyst was added to the photoreactor and again irradiated with solar light. The same procedure was also repeated for the third cycling experiment. After the third cycle, the photocatalyst was recovered and dried and its crystal phase was analysed using an XRD technique, as well as its pore size and surface area using the BET technique.4. Results
4.1. Structural analysis using X-ray diffraction (XRD)
The gel was allowed to dry in an open atmosphere at ambient temperature and used for XRD analysis. The dried gel was further heated at 100 °C in an oven overnight and finally calcined at various temperatures in the range of 200–400 °C. The results showed good agreement with the calculated values based on the weights of vanadium and titanium during the preparation. The XRD patterns of the as-prepared dry 1% V-TiO2 gel and gel samples calcined at 200, 300 and 400 °C for 4 h are shown in Fig. 1 (curves a–d). As expected, the XRD pattern of the as-prepared V-TiO2 sample is a horizontal line with no sign of any peaks (curve a), which may be due to the amorphous nature of the air-dried V-TiO2 gel.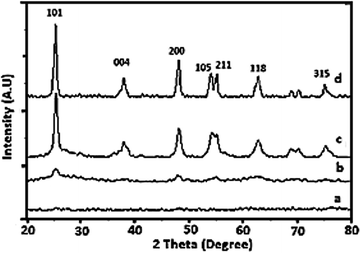 | ||
| Fig. 1 XRD patterns of (a) as-prepared 1% V-TiO2 gel and gels calcined at (b) 200, (c) 300 and (d) 400 °C. | ||
Curve b in the patterns corresponds to the V-TiO2 gel calcined at 200 °C. This pattern displays some very weak peaks at the peak positions of anatase TiO2, which indicates the beginning of crystallization of V-TiO2 at this temperature and a slight rearrangement of atoms into a crystalline structure. On the further increase in the calcination temperature to 300 °C, curve c displays an increase in the intensity of the characteristic peaks of the anatase phase, which suggests the further growth of the anatase phase. The sample calcined at 400 °C (curve d) exhibited peaks of a fully grown anatase phase. From the XRD patterns, it is observed that the crystallization temperature of the anatase phase of TiO2 in V-TiO2 was lowered in comparison with that for pure TiO2.
The effect of the V content on the crystallization behaviour of doped samples was studied by varying the concentration of V added to TiO2. The XRD patterns of pure TiO2 and V-TiO2 samples containing different concentrations of vanadium are shown in Fig. S1 of the ESI.† In Fig. S1,† curves a to c of the XRD patterns closely match that of the anatase phase; however, curves d and e display some very weak peaks of the rutile phase together with those of the anatase phase. This suggests that samples containing less than 3% vanadium did not experience any interference from V with the crystal phase. However, the samples containing more than 3% vanadium exhibited a few weak peaks of rutile together with those of the anatase phase, which suggests that an increase in the V content catalyses the formation of the rutile phase of TiO2 at a much lower temperature than in pure titanium peroxide. In fact, in pure titanium peroxide the anatase-to-rutile transformation starts at a temperature of 700 °C or higher, whereas V-TiO2 samples containing more than 3% vanadium displayed a similar transition at a much lower temperature. In addition, one interesting phenomenon was observed during the crystallization of samples containing more than 1% vanadium. Careful observation of curves a to f shows that there was an increase in the intensity of the (101) peak for the 1% V-TiO2 sample, but the samples containing more than 1% vanadium displayed a decreasing trend in the intensity of the (101) anatase peak, which suggests that a higher vanadium concentration slows down the crystallization of the anatase phase and promotes the direct conversion of titanium peroxide into the rutile phase. In general, in photocatalytic activity the crystal phase as well as the crystallinity is a very important parameter for higher activity. This may be the reason why the photocatalytic activity of the 1% V-TiO2 sample was higher than those of the other V-TiO2 samples.
The effects of the vanadium content on the surface area and porosity were studied by measuring the surface area and porosity of V-TiO2 samples containing 1–5% vanadium. All these samples were calcined at 400 °C prior to the surface area measurements. The porosity of the samples was measured according to the ASTM method ASTM-D4284-12(2017)e1, i.e., by a mercury intrusion porosimetry technique.43 The results for the BET surface area and porosity are summarized in Table 1.
| Sr. no. | Catalyst | Surface area, m2 g−1 | Porosity, % | Pore size, nm |
|---|---|---|---|---|
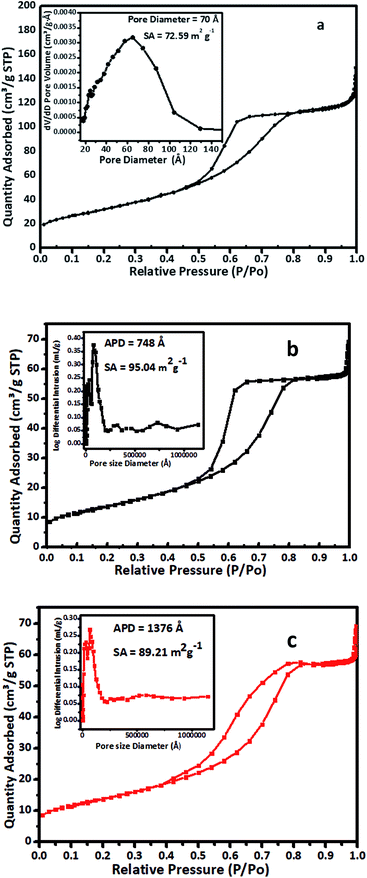
| 1 | TiO2 | 72.59 | 42.74 | 8.1 |
| 2 | 1% V-TiO2 | 95.04 | 44.47 | 49.8 |
| 3 | 2% V-TiO2 | 99.84 | 56.36 | 49.2 |
| 4 | 3% V-TiO2 | 109.07 | 52.50 | 47.4 |
| 5 | 4% V-TiO2 | 129.85 | 59.87 | 44.2 |
| 6 | 5% V-TiO2 | 125.57 | 62.16 | 53.8 |
The results of the measurements of surface area and porosity in Table 1 are quite interesting, as bare TiO2 had a surface area of 72.59 m2 g−1, whereas vanadium-doped TiO2 displayed a steady increase in surface area with the vanadium content until this reached 4% (4% V-TiO2). Interestingly, the surface area of 5% V-TiO2 decreased in comparison with 4% V-TiO2. The increase in surface area may be attributed to the formation of a homogeneous gel until the dopant concentration reached 4%. In this V-TiO2 gel system, when a vanadium peroxide sol is added to a titanium peroxide solution at a V2O5 content of less than 4% it forms a homogeneous greenish gel, but as the vanadium content is increased beyond 4% the characteristics of the gel change and an inhomogeneous gel with agglomerated flocks is formed. In general, in sol–gel synthesis the nature of the gel is very important, as the pores in the gel are filled with solvent molecules and, upon careful removal of these solvent molecules, the porous structure remains undisturbed, which ultimately helps to increase the surface area. In the case of a vanadium dopant content of up to 4% the gel network is perfect, and hence there is an increase in surface area, but as the vanadium percentage is increased beyond this the gel network becomes disturbed with the formation of V-TiO2 flocks. These flocks are denser than the gel and tend to separate from the solvent via an agglomeration process. The agglomerated flocks are less porous in comparison with the undisturbed gel, which ultimately results in a decrease in surface area in comparison with the TiO2 samples with lower vanadium contents.
Nitrogen adsorption–desorption isotherms for (a) pure TiO2, (b) as-prepared 1% V-TiO2 and (c) a sample of 1% V-TiO2 recovered after the third cycle of the photodegradation reaction are shown in Fig. 2. The isotherms were recorded at 77 K with a Micromeritics Gemini VII 2390 instrument. The isotherm (a–c) is classified as a type IV adsorption isotherm with a hysteresis loop. As seen in Fig. 2C, the sample displayed a late adsorption edge (P/P0 > 0.8), which suggests an increase in pore size. In general, the surface area depends on the particle size, pore size, number and type of pores, and distribution of pores, together with voids. A smaller pore size and smaller particles implies a higher surface area. The surface area also increases if the particles contain pores. In our case, the surface area of the sample of 1% V-TiO2 recovered after the third cycle decreased to 89.21 m2 g−1 from the value of 95.04 m2 g−1 for as-prepared 1% V-TiO2. The results are in agreement with reported observations.44
These samples were further characterized using FESEM and TEM to elucidate their surface characteristics and porosity.
4.2. Optical properties of V-TiO2 powder
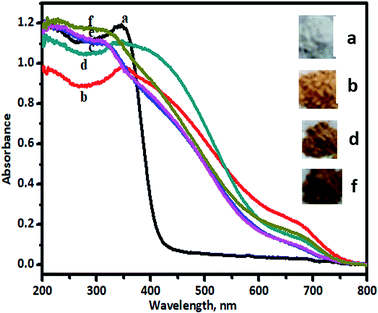
In order to perceive application potential and discuss the results of photocatalysis, it is necessary to study the optical properties of undoped and V-TiO2 nanoparticles, given that this is a reasonably clear way to reveal the effect of dopant-induced electronic properties. The activity of a semiconductor photocatalyst is strongly associated with its optical absorption ability in the visible/solar region. The results of UV-vis characterization are shown in Fig. 3.Upon doping with a foreign element, the absorption band will be altered because of the substitution of an extrinsic dopant element into the lattice. Diffuse-reflectance UV-vis spectra were used to study this phenomenon. Fig. 3 shows the UV-vis DRS results for undoped and V-TiO2 samples. Undoped TiO2 (curve a) exhibited a cutoff wavelength of around 400 nm, as expected, in the UV range. Curve b in the figure represents the UV-visible spectrum of 1% V-TiO2, which displays absorption above 400 nm, and, with an increase in the percentage of V from 2% to 5% (curves c–f), the absorption was shifted further towards the visible side. All the doped TiO2 samples exhibited a red shift in comparison with undoped TiO2. The tailing of the absorption curves shows that all the doped samples were able to absorb photons with wavelengths of greater than 400 nm, which are in the visible range. No separate peaks due to V2O4 or V2O5 were observed in the recorded UV-vis spectra, which display major peaks at 476 and 338 nm and at 355 and 240 nm, respectively.31,32 Hence, the absorption band in the visible region may be due to the presence of vanadium in the V4+ and V5+ states in the TiO2 lattice.12
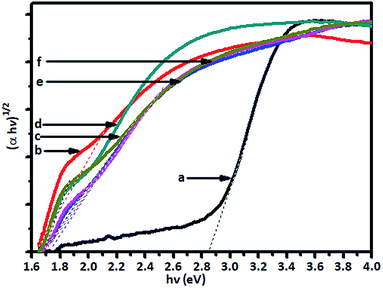
The absorption of visible light by the V-TiO2 powder samples is an indication of the excitation of a 3d electron from a vanadium centre into the TiO2 conduction band. The band gap of the titania catalyst is 2.90 eV, whereas the vanadia-doped catalysts exhibited a band gap of around 1.79 to 1.69 eV, which was determined from Tauc plots, and the band gap energy levels that were found are shown in Fig. 4.
The Tauc plots (Fig. 4) show that there was a substantial decrease in band gap energy for the V-doped samples. The plot of (αhν)1/2 versus the energy of the band gap (hν) between the VB and CB in eV shows that pristine TiO2 displayed an energy threshold in the UV region that corresponded to an estimated band gap energy (Ebg) of 3.05 eV. It was found that the band gap energy of TiO2 is 2.90 eV, whereas the band gap of doped V-TiO2 is narrower (1.79 to 1.69 eV) than that of TiO2.
4.3. FT-IR and Raman spectra of V-TiO2 catalyst
The FT-IR spectra of pure TiO2 and the V-TiO2 catalyst calcined at 400 °C are shown in Fig. 5.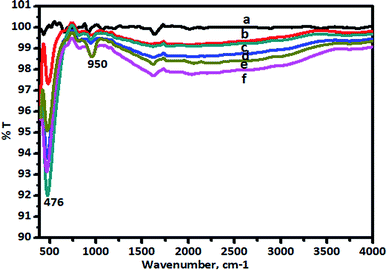 | ||
| Fig. 5 FT-IR spectra of (a) TiO2, (b) 1.0% V-TiO2, (c) 2% V-TiO2, (d) 3.0% V-TiO2, (e) 4.0% V-TiO2, and (f) 5.0% V-TiO2 calcined at 400 °C. | ||
There are characteristic wide peaks in the region of 1000–400 cm−1, which are related to the bending vibrations of Ti–O bonds. New absorption peaks at 950 and 817 cm−1 were observed for the V-TiO2 sample. It can also be seen that the intensity of the peak at 476 cm−1 of V-doped TiO2 is higher than that of TiO2. Raman spectra that give confirmation of the doping of vanadia in titanium dioxide nanoparticles are shown in Fig. 6.
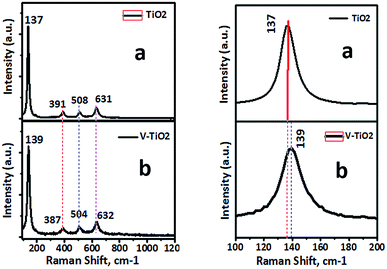
Raman spectroscopy is recognized to be extremely sensitive and is extensively used for the detection of phase changes and nano-oxide clusters in samples. Fig. 6 shows the Raman spectrum of a pure TiO2 sample with typical vibrational modes of anatase at 137, 391, 508 and 631 cm−1. Fig. 6b shows the Raman spectrum of a 1% V-TiO2 sample, in which all the peaks are indexed to the anatase phase with no appearance of any peaks corresponding to individual vanadium oxides. The absence of peaks due to individual vanadium oxides suggests that the doped metal occupied substitution positions in V-TiO2 rather than acting as an impurity. However, a small shift in the main peak at 139 cm−1 was observed, and marginal broadening of peaks can be seen in Fig. 6b in comparison with the undoped TiO2 sample (Fig. 6a). This observation is in accordance with the XRD results and confirms the lattice substitution. V-TiO2 samples that were calcined at 400 °C displayed fundamental vibrational modes of the anatase phase with small amounts of rutile. The Raman spectra serve as further proof that an increase in the concentration of vanadium induces a transformation from anatase to rutile.35
4.4. Thermal and crystallization behaviour
A thermogravimetric analysis (TG) curve for an air-dried 1% V-TiO2 gel is shown in Fig. S2 of the ESI.† The sample that was subjected to TG analysis exhibited a total weight loss of about 14% in two stages in the temperature range of 30–450 °C. The initial sharp weight loss at around 100–120 °C may be ascribed to the loss of absorbed water in the V-TiO2 gel. The weight loss in the second stage may be due to the decomposition of the titanium peroxide complex into crystalline titanium dioxide and hydrous titanium oxide. Most of the titanium peroxide complex is converted into crystalline TiO2 in this temperature range alone, as XRD results show the crystallization of TiO2 in this temperature range alone. A very slight weight loss between 450 and 900 °C was observed, which could be attributed to the conversion of the very small portion of hydrous oxide left undecomposed into TiO2.4.5. Surface morphology using FESEM and HRTEM
The surface morphology/microstructure of powder samples was analysed by FESEM, which showed that the powder had rough surfaces. A granular texture with spheroidal particles and particle agglomerates was observed on the surface. Pure TiO2 exhibits a granular texture (Fig. 7a and b) with compactly bound particles, and the inter-particle distance is much less, which suggests that the sample has lower porosity. This could be the reason for the smaller surface area of pure TiO2. In the FESEM image of TiO2, although the particles have a granular texture the morphology of the particles is not uniform in size and shape. However, V-TiO2 (Fig. 7c and d) exhibits granules with some empty space between the particles, and as a result the texture of the sample appears porous. The porosity of the particles is high in V-TiO2 samples, which could be the reason why the surface areas of these samples are larger in comparison with the undoped TiO2 sample. The FESEM results are in accordance with the surface area results in a previous section.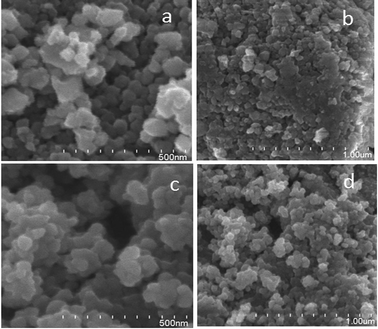 | ||
| Fig. 7 FESEM (a and b) high- and low-magnification images of TiO2 and (c and d) high- and low-magnification images of 1% V-TiO2. | ||
The surface morphology was further confirmed using TEM analysis. TEM images of vanadium-doped TiO2 are shown in Fig. 8. The V-TiO2 sample that was calcined at 400 °C was used for this analysis as a representative sample. The TEM image indicates clearly that the particle size is homogeneous and fairly small. Vanadium oxide species were not detected in powder XRD and Raman spectroscopic analyses, and hence structural characterization was also carried out using HRTEM (Fig. 8). All the results were obtained from a 1% V-TiO2 sample as a representative sample, and scanning was performed in different regions of the sample. No individual vanadium oxide species were observed during the analysis, which further confirms the incorporation of vanadium into the TiO2 lattice. In Fig. 8b, aggregated nanoparticles with an average size of ∼10–15 nm are seen with high uniformity in size and shape. The lattice image in Fig. 8c suggests that the measured d-spacing (0.34 nm) corresponds to the (101) planes of the anatase phase. This domain exhibits comparatively smaller particles with mesopores evenly dispersed between the particles. The SAED pattern in Fig. 8d clearly shows a dot-type diffraction pattern, which was indexed to the (101) planes of anatase TiO2 and suggests that the nanoparticles were single-crystalline in nature.
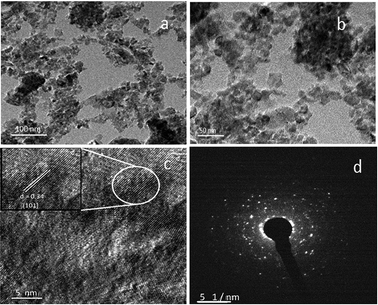 | ||
| Fig. 8 TEM images: (a and b) low- and high-magnification images and (c) lattice image and (d) SAED pattern of 1% V-TiO2 sample. | ||
The quantification of vanadium species was further performed using energy-dispersive X-ray analysis (EDAX). For this analysis, one sample with a low vanadium content (1% V-TiO2) and another sample with a high V content (4% V-TiO2) were chosen. EDAX spectra showing a compositional analysis of both samples together with the content of each element are shown in Fig. S3 of the ESI.†
4.6. Photoluminescence spectroscopy (PL)
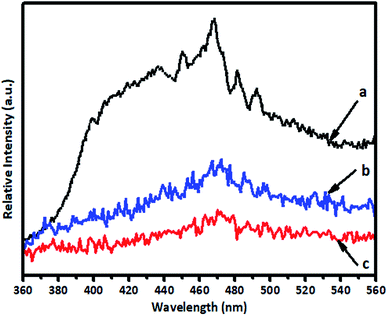
PL analysis was used to investigate the separation of photogenerated electron–hole pairs and the radiative recombination efficiency of the photocatalysts. The intensity of the emission spectrum depends on the charge carrier density and the probability of transitions from a higher-energy state to a vacant lower-energy state.45 A lower intensity suggests enhanced separation and transfer of charge carriers. The PL spectra of samples of pure TiO2, 1% V-TiO2 and 5% V-TiO2 that were calcined at 400 °C were recorded with an excitation wavelength of 300 nm and are shown in Fig. 9. The emission peak at around 400 nm originates from a near-band-edge (NBE) free-excitation emission, i.e., a direct transition from the VB to the CB. The latter additional emission signals at 437, 452, 469, 484, 493 and 532 nm originate from V-TiO2. Careful observation of the PL spectra in Fig. 9 shows that 1% V-TiO2 displayed the lowest PL emission intensity, which indicated the lowest electron–hole recombination efficiency in comparison with pure TiO2 and 5% V-TiO2.5. Photocatalytic study
5.1. Photocatalytic degradation of spent wash
The problem of spent wash effluent is on a large scale and, owing to the high cost of effluent treatment, many industries dispose of the effluent into nearby rivers/land without any treatment to save the cost. Therefore, the use of a natural energy source (sunlight) was selected in place of an artificial energy source (Xe lamp). Photocatalytic activity was tested in the degradation of a spent wash solution from a sugar cane distillery (1 g/100 mL solution) under solar radiation using V-TiO2 powder. The UV-visible absorption spectra of standard samples of melanoidin and caramel were recorded for reference (Fig. S4 in the ESI†). The changes in concentration and colour in samples irradiated for different time intervals with solar radiation were monitored using a UV-visible spectrometer (absorbance at 270 nm) and compared with a blank kept in sunlight under identical experimental conditions. Typical UV spectra of the spent wash solution in the presence of V-TiO2 catalysts before and after irradiation with solar light for different time intervals are shown in Fig. S5 in the ESI.†The 1% V-TiO2 catalyst achieved the maximum degradation of spent wash within 5 h. This is attributed to the decomposition of colorants present in spent wash such as melanoidin and caramel. These colorants exhibit very strong absorption in the UV region with absorption maxima at a wavelength of around 275 nm. Melanoidin46 and caramel47 are homogeneous compounds with dissimilar molecular weights. Caramel has a molecular weight in the region of 248 Da, whereas melanoidin has an MW in the range from 251![[thin space (1/6-em)]](https://www.rsc.org/images/entities/char_2009.gif) 396 to 213 Da. The results of the degradation of colorants in spent wash in daltons are given in Table 2.
396 to 213 Da. The results of the degradation of colorants in spent wash in daltons are given in Table 2.
| Sr. no | RT, min | MW in daltons, before irradiation with sunlight (0 h) | MW in daltons, after irradiation with sunlight (5 h) |
|---|---|---|---|
| 1 | 11.519 | 120![[thin space (1/6-em)]](https://www.rsc.org/images/entities/char_2009.gif) 095 095 |
63![[thin space (1/6-em)]](https://www.rsc.org/images/entities/char_2009.gif) 572 572 |
| 2 | 11.760 | 100![[thin space (1/6-em)]](https://www.rsc.org/images/entities/char_2009.gif) 060 060 |
42![[thin space (1/6-em)]](https://www.rsc.org/images/entities/char_2009.gif) 410 410 |
| 3 | 12.212 | 71![[thin space (1/6-em)]](https://www.rsc.org/images/entities/char_2009.gif) 047 047 |
— |
| 4 | 14.129 | 16![[thin space (1/6-em)]](https://www.rsc.org/images/entities/char_2009.gif) 651 651 |
7424 |
| 5 | 17.533 | 1266 | 916 |
| 6 | 19.142 | 374 | 360 |
| 7 | 19.950 | 203 | 191 |
| 8 | 21.417 | 67 | 63 |
The concentrations of colorants such as melanoidin and caramel polymers in spent wash samples were determined using a PerkinElmer series 200 instrument by gel permeation chromatography (GPC) using Aqua OH-30 PL gel (300 × 7.5 mm, 10 Å) and Aqua OH-40 PL gel (300 × 7.5 mm, 100 Å). The column oven had a temperature of 30 °C with a refractive index detector, and the flow rate of the mobile phase (pH 7.0) was 1 mL min−1. Total Chrome (version 6.3.1) and GPC Turbo SEC software (version 6.3.1.0504) were used for data processing. Traceable American Polymer Standards for polyethylene glycol were used for calibration. The GPC chromatograms of standard caramel and melanoidin are shown in Fig. S6 (a and b) in the ESI.†
A sample solution of spent wash was monitored by gel permeation chromatography before and after irradiation with sunlight for colour degradation, and the chromatograms are shown in Fig. 10a and b. From the results, it is seen that high- and low-molecular-weight (MW) polymeric compounds in the spent wash sample were degraded under sunlight in the presence of a V-TiO2 photocatalyst. High-molecular-weight compounds were degraded from 120![[thin space (1/6-em)]](https://www.rsc.org/images/entities/char_2009.gif) 095 to 63
095 to 63![[thin space (1/6-em)]](https://www.rsc.org/images/entities/char_2009.gif) 572 Da and from 100
572 Da and from 100![[thin space (1/6-em)]](https://www.rsc.org/images/entities/char_2009.gif) 060 to 42
060 to 42![[thin space (1/6-em)]](https://www.rsc.org/images/entities/char_2009.gif) 410 Da in 5 h at a slow degradation rate, whereas the degradation rate of low-MW compounds (71
410 Da in 5 h at a slow degradation rate, whereas the degradation rate of low-MW compounds (71![[thin space (1/6-em)]](https://www.rsc.org/images/entities/char_2009.gif) 047 Da) was fast. This may be attributed to the molecular arrangement in high- and low-molecular-weight compounds.
047 Da) was fast. This may be attributed to the molecular arrangement in high- and low-molecular-weight compounds.
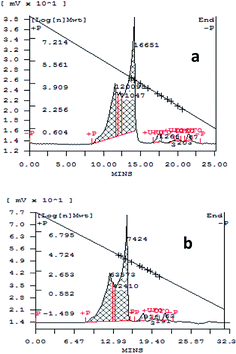 | ||
| Fig. 10 GPC chromatograms (a) before and (b) after irradiation with sunlight of a sample solution of spent wash. | ||
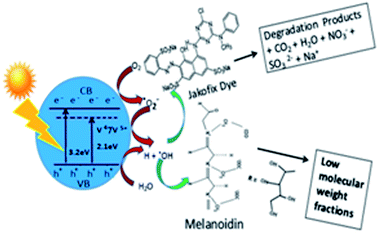
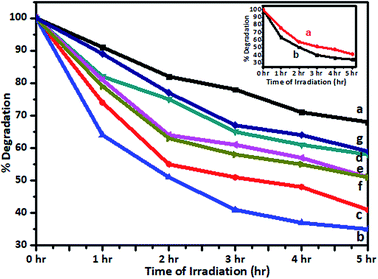
TOC measurements of the original solutions of the dye and spent wash and samples obtained after photocatalytic degradation using 1% V-TiO2 were carried out using a TOC analyzer. TOC analysis of Jakofix dye (100 ppm) and the spent wash solution (10![[thin space (1/6-em)]](https://www.rsc.org/images/entities/char_2009.gif) 000 ppm) gave TOC values of 3.33 ppm and 428 ppm, respectively. The TOC values measured after photodegradation were 2.10 ppm and 275 ppm, respectively. The samples after photodegradation using 1% V-TiO2 exhibited a decrease in TOC values, which indicated the degradation of these molecules into lower-molecular-weight compounds and mineralization of some low-molecular-weight compounds to CO2, H2O and other gases (Fig. 11). Degradation of the colour of spent wash by almost 65% was achieved after irradiation with sunlight for 5 h in the presence of 1% V-TiO2. The percentage degradation of the colour of spent wash for the 1–5% V-TiO2 catalysts is graphically represented in Fig. 12.
000 ppm) gave TOC values of 3.33 ppm and 428 ppm, respectively. The TOC values measured after photodegradation were 2.10 ppm and 275 ppm, respectively. The samples after photodegradation using 1% V-TiO2 exhibited a decrease in TOC values, which indicated the degradation of these molecules into lower-molecular-weight compounds and mineralization of some low-molecular-weight compounds to CO2, H2O and other gases (Fig. 11). Degradation of the colour of spent wash by almost 65% was achieved after irradiation with sunlight for 5 h in the presence of 1% V-TiO2. The percentage degradation of the colour of spent wash for the 1–5% V-TiO2 catalysts is graphically represented in Fig. 12.
The total solar energy that reaches the earth's surface is around ∼1120 W m−2, which includes 42–43% visible light (400–800 nm) and 3–5% UV light (<400 nm). Direct sunlight has a luminous efficacy of ∼93 lumens (total quantity of visible light) per watt radiant flux. Luminous efficacy is a measure of how efficiently any light source produces visible energy. Of course, this is a much higher efficacy than that of artificial lighting. Many researchers have used a xenon lamp (visible light source) as a source of artificial sunlight for photocatalytic reactions in the presence of glass filters to eliminate UV light. Despite the fact that a xenon lamp produces continuous light in the visible range that is very similar to daylight, it is very costly as an energy supply is essential to illuminate the lamp. A xenon arc lamp has a luminous efficacy of about 30–50 lm W−1 (lumen per watt) at a bulb power of 1000 W, and the overall luminous efficacy is around 4.4–7.3% (expressed in dimensionless form), because all lamps use electric ballast. Considering all these factors, instead of using high-wattage incandescent lamps, photocatalytic degradation in natural sunlight is potentially scalable in terms of system cost and is eco-friendly as well.45
Therefore, the degradation of colour in spent wash was carried out under a xenon lamp and natural sunlight using a 1% V-TiO2 catalyst.
A graph of the change in the concentration of spent wash with the irradiation time is shown in the inset of Fig. 12. From the graph, it is seen that degradation of spent wash of nearly 54% and 65% took place under the Xe lamp and natural sunlight, respectively. The colour degradation rate was faster under natural sunlight than under a standard source of energy, i.e., a xenon lamp. This may be because the luminous efficacy of sunlight is higher than that of an Xe lamp.
5.2. Photocatalytic degradation of Jakofix red dye (HE 8BN)
Recently, several visible-light-active photocatalysts have been reported for the degradation of toxins and dyes found in industrial effluent.45,48 The photocatalytic activity of a V-TiO2 catalyst was also tested in the degradation of Jakofix red dye (100 ppm solution) under solar radiation using V-TiO2 powder. The change in the concentration of the dye in samples irradiated for different time intervals with solar radiation was monitored using a UV-visible spectrometer (200–800 nm) and compared with undoped TiO2 and P-25 TiO2 (Degussa) kept in sunlight under identical experimental conditions. Typical UV spectra of the Jakofix red dye solution in the presence of 1% V-TiO2 catalysts before and after irradiation with solar light for different time intervals are shown in Fig. S7 in the ESI.†The results for the photocatalytic efficiency of TiO2 and vanadium-doped TiO2 in the degradation of Jakofix red dye under irradiation with visible light are shown in Fig. 13. Under sunlight, degradation of 90% of Jakofix red dye (HE 8BN) was observed after 3.5 h using a 1% V-TiO2 catalyst. Degradation of 50% was observed within a time interval of 2 h for a dye solution. V-TiO2 samples exhibited higher activity than pure TiO2 and Degussa P-25 TiO2. This shows that V helped to increase the activity in photodegradation reactions. The increase in photocatalytic activity may be attributed to the combined effect of the doping of V into TiO2 and the formation of hierarchical nanostructures in V-doped samples. Fang et al.49,50 have reported that the development of a hierarchical nanostructure in a TiO2 microsphere not only favors fast mass transport, which results in enhanced photocatalytic activity, but may also contribute to an improvement in photocatalytic activity due to enhanced multi-light scattering. The results are in accordance with the observations reported by Fang et al.
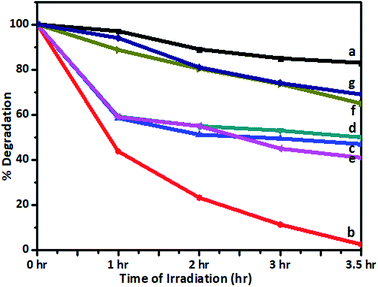 | ||
| Fig. 13 Degradation of dye (%) remaining after irradiation with sunlight using (a) undoped TiO2, (b) 1%, (c) 2%, (d) 3%, (e) 4%, and (f) 5% V-TiO2 and (g) P-25 TiO2. | ||
The efficiency of photocatalysts is based on the recombination rate of electron/hole pairs. In this study, the introduction of vanadium into the TiO2 matrix is believed to contribute to the high electron/hole separation rate. The introduction of vanadium would alter the electronic properties of TiO2. The V4+/V5+ pair could form an impurity energy band around 2.1 eV, which can act as an e−/h+ trap that improves the separation efficiency.51 The substitution of a Ti4+ ion by a V5+ ion leaves a free electron, which can easily be excited to the TiO2 conduction band by irradiation with light.52 Moreover, V4+ ions trap photogenerated holes to form V5+ ions.49 Therefore, the V4+/V5+ pair acts as an electron/hole trap center, which substantially decreases the recombination rate. A higher loading (2–5%) of V in TiO2 powders results in relatively lower photocatalytic activity, although the band gap energy is lower than those of all the other V-TiO2 samples. This may be because the additional vanadium ions may act as electron–hole recombination centres (as also seen in the photoluminescence spectra), which ultimately results in low photocatalytic activity for samples that contain larger amounts of vanadium. The repeatability and reproducibility of the degradation reaction were assessed by conducting the degradation reaction for 3 consecutive cycles under identical conditions. Table 3 shows the results of degradation experiments carried out to confirm the repeatability and reproducibility of results using a 1% V-TiO2 photocatalyst. From the results it is seen that there was no considerable decrease in the activity of the photocatalyst in the second and third cycles, which suggests that the repeatability and reproducibility of the results were high.
| Degradation | Time in h | 1st cycle | 2nd cycle | 3rd cycle |
|---|---|---|---|---|
| Spent wash | 5 | 65% | 64% | 62% |
| Jakofix dye | 3.5 | 90% | 87% | 86% |
The stability of the catalyst is a very important parameter in a catalytic reaction, as it has a direct effect on the cost of the process and the final product. A stability test was performed to study the degradation of the photocatalyst itself, as many photocatalysts such as CdS and ZnS have problems with photocorrosion in the presence of light. The XRD patterns of 1% V-TiO2 before photocatalytic use (curve a) and recovered after 3 cycles of the photodegradation reaction (curve b) are shown in Fig. S8 in the ESI.† The XRD patterns show no change in structural behaviour, as all the peaks and their positions are identical to those of the 1% V-TiO2 photocatalyst before use. The XRD pattern of V-TiO2 recovered after 3 consecutive cycles of photodegradation experiments suggests that the photocatalyst has high stability under the given experimental conditions. This indicates that the photocatalyst can be used for several experiments without much decrease in activity.
The result of a recyclability test of a 1% V-TiO2 catalyst for the degradation of colour in spent wash is shown in Fig. S9 in the ESI.† From the figure, it seems that not much decrease in the performance of the photocatalyst was observed after the second and third cycles, which suggests that the recyclability and stability of the photocatalyst in this reaction were high. A recovery test was performed by recovering the photocatalyst after each cycle of the experiment. A plot of the quantity of photocatalyst recovered versus the number of cycles is shown in Fig. S10 in the ESI.† The loss of weight of the catalyst was only 6% after three cycles of the degradation reaction, which confirms that large quantities of the catalyst can be recovered easily.
6. Conclusions
A vanadium-doped titanium dioxide (V-TiO2) powder photocatalyst was prepared using a simple sol–gel method based on aqueous titanium peroxide and tested for the degradation of spent wash and Jakofix dye. The V-TiO2 powder photocatalyst exhibited very high activity in the photocatalytic degradation of spent wash and Jakofix red dye under natural sunlight. Among the photocatalysts that were investigated, 1% V-TiO2 was found to be the most active for the degradation of colour in spent wash (65%) and Jakofix red dye (90%). The photocatalyst was tested for its activity and exhibited higher activity under natural sunlight than under an artificial source of energy (Xe lamp). The activity under visible light is attributed to the incorporation of V species into the TiO2 matrix and the subsequent shift in the absorption of the doped catalyst in the visible region. Gel permeation chromatography shows a breakdown of high-molecular-weight colorant compounds into lower-molecular-weight compounds. The photocatalyst is quite stable, and hence it can be used for many degradation cycles with a recovery of the photocatalyst of 94–96% after 3 cycles.Conflicts of interest
There are no conflicts to declare.Acknowledgements
The authors would like to thank the Director General, C-MET, Pune and Department of Chemistry, A.M. College, Pune for the encouragement. Mr Shrikant P. Takle is grateful to the Centre for Materials for Electronics Technology (C-MET) for providing the research facilities and the Nanocrystalline Materials Group, C-MET, Pune for their support.References
- R. M. Bhise, A. A. Patil, A. R. Raskar, P. J. Patil and D. P. Deshpande, Res. J. Recent Sci., 2012, 1, 66–69 Search PubMed.
- Y. Satyawali and M. Balakrishnan, Bioresour. Technol., 2007, 98, 2629–2635 CrossRef PubMed.
- M. N. Vineetha, M. Matheswaran and K. N. Sheeba, Sol. Energy, 2013, 91, 368–373 CrossRef.
- C. David, M. Arivazhagan and M. Ibrahim, J. Saudi Chem. Soc., 2015, 19, 537–548 CrossRef.
- M. Navgire, A. Yelwande, D. Tayde, B. Arbad and M. Lande, Chin. J. Catal., 2012, 33, 261–266 CrossRef.
- M. R. Hoffmann, S. T. Martin, W. Choi and D. W. Bahnemann, Chem. Rev., 1995, 95, 69–96 CrossRef.
- M. A. Fox and M. T. Dulay, Chem. Rev., 1993, 93, 341–357 CrossRef.
- A. L. Linsebigler, G. Lu and J. T. Yates Jr, Chem. Rev., 1995, 95, 735–758 CrossRef.
- M. Anpo, Res. Chem. Intermed., 1989, 11, 67–106 CrossRef.
- S. T. Martin, C. L. Morrison and M. R. Hoffmann, J. Phys. Chem., 1994, 98, 13695–13704 CrossRef.
- W. Choi, A. Termin and M. R. Hoffmann, J. Phys. Chem., 1994, 98, 13669–13679 CrossRef.
- S. Klosek and D. Raftery, J. Phys. Chem. B, 2001, 105, 2815–2819 CrossRef.
- X. Hong, Z. Wang, W. Cai, F. Lu, J. Zhang, Y. Yang, N. Ma and Y. Liu, Chem. Mater., 2005, 17, 1548–1552 CrossRef.
- G. Zhao, H. Kozuka, H. Lin and T. Yoko, Thin Solid Films, 1999, 339, 123–128 CrossRef.
- G. C. Bond and S. F. Tahir, Appl. Catal., 1991, 71, 1–31 CrossRef.
- D. J. Stacchiola, S. D. Senanayake, P. Liu and J. A. Rodriguez, Chem. Rev., 2013, 113(6), 4373 CrossRef PubMed.
- Z. Zhang and V. E. Henrich, Surf. Sci., 1992, 277, 263 CrossRef.
- G. Centi, D. Pinelli and F. J. Trifiro, Mol. Catal., 1990, 59, 221 CrossRef.
- I. Muylaert and P. Van Der Voort, Phys. Chem. Chem. Phys., 2009, 11, 2826 RSC.
- E. L. Lee and I. E. Wachs, J. Phys. Chem. C, 2008, 112, 20418 Search PubMed.
- M. Baron, H. Abbot, O. Bondarchuk, D. Stacchiola, A. Uhl, S. Shaikhutdinov, H.-J. Freund, C. Popa, M. V. Ganduglia-Pirovano and S. Joachim, Angew. Chem., Int. Ed., 2009, 48, 8006 CrossRef PubMed.
- I. E. Wachs, Catal. Today, 2005, 100, 79 CrossRef.
- H. H. Kung. Transition Metal Oxides: Surface Chemistry and Catalysis, Elsevier, Amsterdam, 1989 Search PubMed.
- G. C. Bond and S. F. Tahir, Appl. Catal., 1991, 71, 1 CrossRef.
- V. Shapovalov and H. Metiu, J. Phys. Chem. C, 2007, 111, 14179 Search PubMed.
- V. I. Avdeev and V. M. Tapilin, J. Phys. Chem. C, 2010, 114, 3609 Search PubMed.
- M. Anpo, Y. Ichihashi, M. Takeuchi and H. Yamashita, Res. Chem. Intermed., 1998, 24, 143–149 CrossRef.
- M. Anpo, H. Yamashita, S. Kanai, K. Sato and T. Fujimoto, US Pat. 6077492, 2000.
- M. Anpo, N. Aikawa, Y. Kubokawa, M. Che, C. Louis and E. Giamello, J. Phys. Chem., 1985, 89, 5017–5021 CrossRef.
- M. Anpo, I. Tanahashi and Y. Kubokawa, J. Phys. Chem., 1980, 84, 3440–3443 CrossRef.
- K. Bhattacharyya, S. Varma, A. K. Tripathi, S. R. Bharadwaj and A. K. Tyagi, J. Phys. Chem. C, 2008, 112, 19102–19112 Search PubMed.
- R. Bulánek, L. CÌŒapek, M. SetnicÌŒka and P. CÌŒicÌŒmanec, J. Phys. Chem. C, 2011, 115, 12430–12438 Search PubMed.
- R. Akbarzadeh, S. B. Umbarkar, R. S. Sonawane, S. Takle and M. K. Dongare, Appl. Catal., A, 2010, 374, 103–109 CrossRef.
- D. J. Stacchiola, S. D. Senanayake, P. Liu and J. A. Rodriguez, Chem. Rev., 2012, 113, 4373–4390 CrossRef PubMed.
- Z. Luo, A. S. Poyraz, C.-H. Kuo, R. Miao, Y. Meng, S.-Y. Chen, T. Jiang, C. Wenos and S. L. Suib, Chem. Mater., 2015, 27, 6–17 CrossRef.
- R. S. Sonawane, B. B. Kale and M. K. Dongare, Mater. Chem. Phys., 2004, 85, 52–57 CrossRef.
- R. S. Sonawane and M. K. Dongare, J. Mol. Catal. A: Chem., 2006, 243, 68–76 CrossRef.
- R. S. Sonawane, S. G. Hegde and M. K. Dongare, Mater. Chem. Phys., 2003, 77, 744–750 CrossRef.
- K. Sathishkumar, S. Sathiyaraj, P. Parthipan, A. Akhil, K. Murugan and A. Rajasekar, Chemosphere, 2017, 183, 204–211 CrossRef PubMed.
- S. Yadav and R. Chandra, Biodegradation, 2012, 23, 609–620 CrossRef PubMed.
- A. Kumar, D. P. Saroj, V. Tare and P. Bose, Water Environ. Res., 2006, 78, 994–1004 CrossRef PubMed.
- R. Lakshmikanth and A. S. Virupakshi, Int. J. Sci. Res., 2012, 3, 1–12 Search PubMed.
- M. Boualleg and B. Guichard, US Pat. App. 15/318151, 2017.
- L. Lucarelli and M. P. Line, Microstructure Product Line, Thermo Electron Corporation, Milan-Italy, 2010 Search PubMed.
- S. K. Khore, N. V. Tellabati, S. K. Apte, S. D. Naik, P. Ojha, B. B. Kale and R. S. Sonawane, RSC Adv., 2017, 17, 33029 RSC.
- S. Ohmomo, I. Aoshima, Y. Tozawa, N. Sakurada and K. Ueda, Agric. Biol. Chem., 1985, 49, 2047–2053 Search PubMed.
- S. Agnihotri, Int. J. Curr. Microbiol. Appl. Sci., 2015, 4, 12–17 Search PubMed.
- W. W. Zhong, Y. F. Lou, S. F. Jin, W. J. Wang and G. Liw, Sci. Rep., 2016, 6, 23235 CrossRef PubMed.
- B. Fang, A. Bonakdarpour, K. Reilly, Y. Xing, F. Taghipour and D. P. Wilkinson, ACS Appl. Mater. Interfaces, 2014, 6, 15488–15498 Search PubMed.
- B. Fang, Y. Xing, A. Bonakdarpour, S. Zhang and D. P. Wilkinson, ACS Sustainable Chem. Eng., 2015, 3, 2381–2388 CrossRef.
- X. Yang, C. Cao, K. Hohn, L. Erickson, R. Maghirang, D. Hamal and K. Klabunde, J. Catal., 2007, 252, 296–302 CrossRef.
- I. E. Wachs, J. Chem. Soc., Faraday Trans., 1997, 93, 1655–1660 RSC.
Footnote |
| † Electronic supplementary information (ESI) available. See DOI: 10.1039/c8ra02869a |
| This journal is © The Royal Society of Chemistry 2018 |

