 Open Access Article
Honeycomb-patterned porous films fabricated via self-organization of Tb complex-loaded amphiphilic copolymers†
Qian Liua,
Chun-Na Yana,
Yu-Chao Li a,
Mei-Fang Lib,
Li-Ping Baia,
Li-Ping Wang
 *a and
Guang Li*a
aCollege of Materials Science and Engineering, Liaocheng University, Liaocheng 252059, China. E-mail: wangliping5@163.com; liguang@lcu.edu.cn
bCollege of Life Science, Liaocheng University, Liaocheng 252059, China
First published on 29th May 2018
Abstract
Amphiphilic copolymers, poly(styrene)-block-Tb complex (PS-b-Tb complex), were synthesized by reversible addition fragmentation chain transfer (RAFT) polymerization. The honeycomb structured porous films were fabricated via dropping the PS-b-Tb complex copolymer solutions on glass substrates by the breath figures method (BFM). The structure and composition of the amphiphilic copolymer PS-b-Tb complex were confirmed by gel permeation chromatography (GPC), Fourier transform infrared spectroscopy (FT-IR) and 1H nuclear magnetic resonance spectroscopy (1H NMR). The surface morphology and elemental mapping of the highly ordered porous films were investigated by field emission scanning electron microscopy (FESEM), energy dispersive X-ray spectroscopy (EDX) and laser scanning confocal microscopy (LSCM). The results indicated that the solvent type and copolymer concentration can affect the surface morphology of the porous films. The average diameter of the pores in the porous films decreased with the polymer concentration and the molecular weight of the copolymers increased. The FESEM-EDX analysis further verified that the hydrophilic groups (Tb complex groups) were mainly distributed at the pore wall, instead of at the outer surface layer of the films, which was consistent with the LSCM results.
1. Introduction
The honeycomb-patterned porous films fabricated by the breath figure method (BFM) have attracted more and more attention in recent years due to their potential applications, such as in photo-electronic materials,1,2 separation membranes,3,4 biomaterials,5 drug release,6 superhydrophobic surfaces,7 and electrocatalysis.8 BFM is a simple, convenient and versatile self-assembly strategy for fabrication of honeycomb-patterned porous films which was first reported by Francois and his co-workers.9 In the breath figure process, the evaporation of solvent decreases the temperature of the solution surface, thereby facilitating the condensation and growth of water droplets on the solution surface under high relative humidity. After the evaporation of water and solvent, the ordered hexagonal lattice comes into being in order to reduce the free energy.10,11 Afterward, countless important studies have been reported on porous films including the hole pattern formation mechanism,12–15 choice, design and synthesis of polymers,16–21 effect of solvent and substrate,22,23 environment conditions,19,21 the reprocessing methods and applications1–8,24–26 and so on. Although the hole pattern formation mechanism is not completely understood at present, this method is known to require precise control over the processing environment conditions, and the polymers used in BFM usually have to be specially designed and synthesized in order to obtain a good quality in pore size and distribution.27–30Up to now, a variety of polymers, including star polymers, amphiphilic block copolymers, hyper-branched polymers, comb-like copolymers, and rod–coil/coil–coil block copolymers, have been employed to fabricate such porous films with different pore diameters.31–34 Various synthetic routes have been developed to synthesize the star and block polymers, particularly the living radical polymerization including reverse iodine transfer polymerization (RITP),35 atom transfer radical polymerization (ATRP),36 and reversible addition-fragmentation chain transfer (RAFT) polymerization.37 The RAFT polymerization is one of the most prominent living/controlled free radical polymerization techniques as it is applicable to a wide range of monomers to produce well-defined polymers with predictable molecular weights, composition, architecture and low polydispersity index (PDI) values.
Luminescent rare earth terbium (Tb) complex is well-known due to their excellent luminescence characteristics, long luminous life time, high luminous intensity and extremely sharp emission bands (good color purity) from the electronic transitions between the 4f energy levels, and they have been widely applied in many fields, such as photoluminescence materials, fluorescence probes and labels, electroluminescence devices and so on.38–40 In this work, we propose a simple RAFT polymerization technique to synthesize well-controlled poly(styrene)-block-Tb complex (PS-b-Tb complex) amphiphilic diblock copolymers for fabrication of ordered honeycomb structured porous films. The procedure for the formation of honeycomb porous films with PS-b-Tb complex by BFM was sketched in Fig. 1. The Tb complex is the reaction product of methacrylic acid, salicylic acid and Tb(NO3)3 which includes the hydrophilic monomer methacrylic acid. We use Tb complex as the second monomer mainly due to the following two reasons: one is that the loading of Tb complex into the porous films can endow the honeycomb structured porous films with fluorescent characteristic; for another, we can investigate the assemble status of hydrophilic groups in the honeycomb-patterned porous films by detecting the position of rare earth Tb owing to the fact that the rare earth ions are directly linked to hydrophilic monomer methacrylic acid by coordinating bond. To the best of our knowledge, it is the first report to confirm the assemble status of hydrophilic groups in the porous films using rare earth Tb complex as a fluorescent probe. This work will provide a new way to detect the assemble status of hydrophilic groups in the porous films, promote the mechanism understandings of the breath figure process. In addition, the influence of polymer molecular weight, solvents and polymer concentration on the morphology of the films are also investigated.
 | ||
| Fig. 1 Schematic illustration for the formation of honeycomb porous films with PS-b-Tb complex by BFM. | ||
2. Experimental section
2.1. Materials
Styrene (St, 99.5%) was commercially purchased from Tianjin Kermel Chemical Reagent Co. Ltd. and distilled under reduced pressure before use. 2-Dodecylsulfanylthiocarbonylsulfanyl-2-methyl-propionic acid (DMPA) was synthesized according to the previous method.41 Tb2O3, methacrylic acid (MA) and salicylic acid (SA) were purchased from Shanghai Aladdin Chemical Reagent Co. Ltd. All other chemical reagents were of analytical grade and used as received.2.2. Instrumental characterization
Gel permeation chromatography (GPC1515 Waters, USA) was used to determine the molecular weights and polydispersities (PDI) with THF as the eluent at a flow rate of 0.6 mL min−1 at 30 °C. Field emission scanning electron microscope (FESEM, Merlin Compact) was used to observe the surface morphology of films after being sputtered with gold using ion sputter and the energy dispersive X-ray spectroscopy (EDX) was used to map the Tb element at the film surface. The image of the fluorescent porous film was assessed by laser scanning confocal microscope (LSCM) (FV1200, Olympus, Japan) and measured by a 554 nm laser. Luminescence properties were performed on a spectrofluorometer (FLS920, Edinburgh, UK) using 323 nm excitation wavelength laser at room temperature. 1H nuclear magnetic resonance spectroscopy (1H NMR) spectra were carried out on a 400 MHz (Varian Mercury Plus 400) nuclear magnetic resonance instrument. The water contact angle was analyzed by a KRUSS DSA100 contact angle system with a drop size of 2.0 μL at room temperature. The structure of the samples were characterized by Nicolet-100 Fourier transform infrared spectroscopy (FT-IR) from 400 cm−1 to 4000 cm−1 by the KBr tablet method.2.3. Synthesis of PS-b-Tb complex via RAFT polymerization
Polystyrene (PS) were synthesized in cyclohexanone using DMPA as the chain transfer agent through RAFT polymerization (Scheme 1). In brief, styrene (St, 8.7 mmol, 10 mL), DMPA (0.17 mmol, 0.0636 g), (2-methylpropionitrile) (AIBN) (0.087 mmol, 0.0143 g), and cyclohexanone (10 mL) were mixed in a 50 mL round-bottomed flask with a magnetic stirrer. The reaction mixture was degassed by N2 purging and reacted at 80 °C for 12 h. Then, the reaction mixture was diluted with tetrahydrofuran (THF), and precipitated in cold methanol. The obtained PS was dried in vacuum at 40 °C. The details of the relative molecular weight and PDI of the polymers were listed in Table 1.| Sample | Mna | Mwa | PDIb | Reaction time |
|---|---|---|---|---|
| a The molecular weights obtained by GPC with standard polystyrene as reference.b PDI: molecular weight distribution is calculated from Mw/Mn. | ||||
| PS-b-Tb complex-1 | 18![[thin space (1/6-em)]](https://www.rsc.org/images/entities/char_2009.gif) 700 700 |
24![[thin space (1/6-em)]](https://www.rsc.org/images/entities/char_2009.gif) 500 500 |
1.31 | 4 h |
| PS-b-Tb complex-2 | 18![[thin space (1/6-em)]](https://www.rsc.org/images/entities/char_2009.gif) 900 900 |
24![[thin space (1/6-em)]](https://www.rsc.org/images/entities/char_2009.gif) 600 600 |
1.29 | 6 h |
| PS-b-Tb complex-3 | 19![[thin space (1/6-em)]](https://www.rsc.org/images/entities/char_2009.gif) 100 100 |
24![[thin space (1/6-em)]](https://www.rsc.org/images/entities/char_2009.gif) 700 700 |
1.29 | 8 h |
| PS-b-Tb complex-4 | 20![[thin space (1/6-em)]](https://www.rsc.org/images/entities/char_2009.gif) 900 900 |
25![[thin space (1/6-em)]](https://www.rsc.org/images/entities/char_2009.gif) 300 300 |
1.21 | 12 h |
| PS | 19![[thin space (1/6-em)]](https://www.rsc.org/images/entities/char_2009.gif) 500 500 |
26![[thin space (1/6-em)]](https://www.rsc.org/images/entities/char_2009.gif) 500 500 |
1.36 | 12 h |
Tb2O3 (12.6 mmol, 2 g) and excessive nitric acid (HNO3) were mixed in a crucible with spirit-lamp heating and stirring. After completely volatilization of the solvent, the obtained Tb(NO3)3 was dried under vacuum at 30 °C. Tb complex was synthesized by mixing the Tb(NO3)3, MA and SA in a round-bottomed flask at a molar ratio of Tb(NO3)3/MA/SA = 1![[thin space (1/6-em)]](https://www.rsc.org/images/entities/char_2009.gif) :
:![[thin space (1/6-em)]](https://www.rsc.org/images/entities/char_2009.gif) 1
1![[thin space (1/6-em)]](https://www.rsc.org/images/entities/char_2009.gif) :
:![[thin space (1/6-em)]](https://www.rsc.org/images/entities/char_2009.gif) 2. In details, Tb(NO3)3 (0.585 mmol, 0.2 g), MA (0.585 mmol, 0.05 mL), SA (1.17 mmol, 0.162 g) and 1 mL ethanol were mixed in a 50 mL round-bottomed flask at room temperature for 12 h. The Tb complex in ethanol was obtained. After removal of the ethanol by reduced pressure distillation, the reddish crystalline solid Tb complex was obtained. To verify the formation of the Tb complex, the Tb complex and Tb(NO3)3 were dissolved in water respectively. The Tb complex is insoluble in water and emits green fluorescence under UV lamp which is obviously different from Tb(NO3)3 (Fig. S1†). This is a characteristic of Tb complex. The results of the FT-IR (Fig. S2†) also proved that the terbium complex had been synthesized successfully.
2. In details, Tb(NO3)3 (0.585 mmol, 0.2 g), MA (0.585 mmol, 0.05 mL), SA (1.17 mmol, 0.162 g) and 1 mL ethanol were mixed in a 50 mL round-bottomed flask at room temperature for 12 h. The Tb complex in ethanol was obtained. After removal of the ethanol by reduced pressure distillation, the reddish crystalline solid Tb complex was obtained. To verify the formation of the Tb complex, the Tb complex and Tb(NO3)3 were dissolved in water respectively. The Tb complex is insoluble in water and emits green fluorescence under UV lamp which is obviously different from Tb(NO3)3 (Fig. S1†). This is a characteristic of Tb complex. The results of the FT-IR (Fig. S2†) also proved that the terbium complex had been synthesized successfully.
The PS-b-Tb complex were synthesized using PS as the macroinitiator through RAFT polymerization. Briefly, PS (0.475 g), Tb complex solution (0.5 mL), AIBN (0.005 g) and 1 mL cyclohexanone were added into a 50 mL round-bottomed flask with a magnetic stirrer. After degassing by N2 purging, the reaction mixture was heated at 70 °C for a certain time. Then the product was precipitated in cold methanol and dried under vacuum at 40 °C. Schematic illustration for the synthesis of PS-b-Tb complex was shown in Scheme 1.
2.4. Fabrication of the honeycomb porous thin films
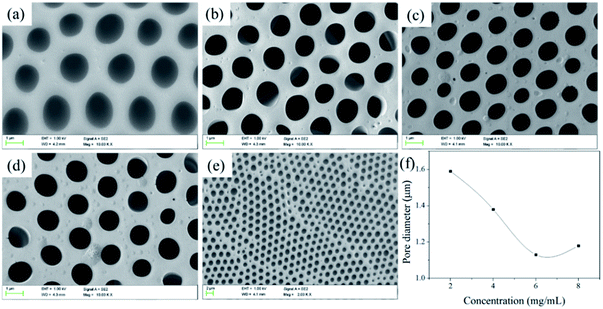
The PS-b-Tb complex was dissolved in various organic solvents (i.e., chloroform, dichloromethane, carbon disulfide and THF) with different concentrations (2 mg mL−1, 4 mg mL−1, 6 mg mL−1 and 8 mg mL−1). Then, an aliquot of 10 μL for each polymer solution was dropped onto glass substrates (1 cm × 1 cm) under 1.5 L min−1 humid airflow and the relative humidity of the moist air was kept above 80%. After complete evaporation of solvent and water, the opaque and white thin films were obtained by the BFM at room temperature.3. Results and discussion
3.1. Structure characterization of the PS-b-Tb complex copolymers
The structure of these polymers were determined by FT-IR (Fig. S2†) and 1H NMR (Fig. S3–S5†). Fig. S2† shows the FT-IR spectrum of PMA, Tb complex, PS and PS-b-Tb complex. In the FT-IR spectra of Tb complex, the adsorption peaks at 1380 cm−1 are corresponded to νs stretching vibration of COO−. The C![[double bond, length as m-dash]](https://www.rsc.org/images/entities/char_e001.gif) O stretching vibration observed at 1658 cm−1 showed a significant red shifts compared with that of pure PMA (1695 cm−1), which was the result of the deprotonation of the carboxyl groups.42,43 As for the FT-IR spectra of PS, the peaks at 2800–3100 cm−1 are assigned to the C–H stretching and the peaks at 1496 cm−1 and 1452 cm−1 are attributed to the stretching vibration absorption of C
O stretching vibration observed at 1658 cm−1 showed a significant red shifts compared with that of pure PMA (1695 cm−1), which was the result of the deprotonation of the carboxyl groups.42,43 As for the FT-IR spectra of PS, the peaks at 2800–3100 cm−1 are assigned to the C–H stretching and the peaks at 1496 cm−1 and 1452 cm−1 are attributed to the stretching vibration absorption of C![[double bond, length as m-dash]](https://www.rsc.org/images/entities/char_e001.gif) C bond of the benzene rings. After the block copolymerization using Tb complex as the second monomer, a new characteristic peak emerged at 1380 cm−1 corresponds to the COO− stretching vibration of the PS-b-Tb complex, which indicated the successful synthesis of the PS-b-Tb complex. However, the peak at 1658 cm−1 of C
C bond of the benzene rings. After the block copolymerization using Tb complex as the second monomer, a new characteristic peak emerged at 1380 cm−1 corresponds to the COO− stretching vibration of the PS-b-Tb complex, which indicated the successful synthesis of the PS-b-Tb complex. However, the peak at 1658 cm−1 of C![[double bond, length as m-dash]](https://www.rsc.org/images/entities/char_e001.gif) O could not be clearly observed, the possible reason is the content of Tb complex is too low to be detected by FT-IR. Furthermore, the structure of Tb complex, PS and PS-b-Tb complex was further identified by 1H NMR spectra analysis (Fig. S3, S4 and S5†). The 1H NMR spectra of PS-b-Tb complex are too similar with that of PS, it is also because the content of Tb complex is low.
O could not be clearly observed, the possible reason is the content of Tb complex is too low to be detected by FT-IR. Furthermore, the structure of Tb complex, PS and PS-b-Tb complex was further identified by 1H NMR spectra analysis (Fig. S3, S4 and S5†). The 1H NMR spectra of PS-b-Tb complex are too similar with that of PS, it is also because the content of Tb complex is low.
The number-average molecular weight and molecular weight distribution of PS and PS-b-Tb complex copolymers were determined by GPC and the results were listed in Table 1. As shown in Table 1, the number-average molecular weight and molecular weight distribution of PS determined by GPC are 19![[thin space (1/6-em)]](https://www.rsc.org/images/entities/char_2009.gif) 500 and 1.36, respectively. For the PS-b-Tb complex copolymers, with the extension of polymerization time, the number-average molecular weight of the block copolymers increases, which indicates the increase of the lengths of Tb complex block. The molecular weight distribution of the PS-b-Tb complex copolymers is relatively narrow (Mw/Mn = 1.21–1.31), which is the characteristic of a RAFT polymerization. However, the molecular weights of the PS-b-Tb complex copolymers with short polymerization time (such as 4 h, 6 h, 8 h) are slightly smaller than that of the PS macro-initiator. It is probably owing to the adsorption of hydrophilic Tb complex block onto the GPC column, which leads to an addition in retention time. However, when the polymerization time increased to 12 h, the molecular weights of the PS-b-Tb complex copolymers exceed that of the PS macroinitiator. This result can be explained by the fact that with the increasing of polymerization time, the hydrophilic Tb complex block keeps extending, the hydrodynamic volume of the PS-b-Tb complex copolymers increases accordingly, leading to the decrease of the retention time.
500 and 1.36, respectively. For the PS-b-Tb complex copolymers, with the extension of polymerization time, the number-average molecular weight of the block copolymers increases, which indicates the increase of the lengths of Tb complex block. The molecular weight distribution of the PS-b-Tb complex copolymers is relatively narrow (Mw/Mn = 1.21–1.31), which is the characteristic of a RAFT polymerization. However, the molecular weights of the PS-b-Tb complex copolymers with short polymerization time (such as 4 h, 6 h, 8 h) are slightly smaller than that of the PS macro-initiator. It is probably owing to the adsorption of hydrophilic Tb complex block onto the GPC column, which leads to an addition in retention time. However, when the polymerization time increased to 12 h, the molecular weights of the PS-b-Tb complex copolymers exceed that of the PS macroinitiator. This result can be explained by the fact that with the increasing of polymerization time, the hydrophilic Tb complex block keeps extending, the hydrodynamic volume of the PS-b-Tb complex copolymers increases accordingly, leading to the decrease of the retention time.
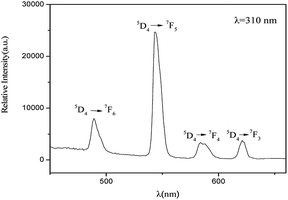
The fluorescent properties of the PS-b-Tb complex was obtained by monitoring the excitation spectrum of Tb3+ ion at the emission of 545 nm. The peak at 310 nm was found to be the optimal excitation peak. Setting the excitation wavelength at 310 nm, the fluorescence emission spectrum of PS-b-Tb complex was determined (Fig. 2). In the spectrum, four main emission peaks located at 489, 543, 584 and 621 nm are assigned to the electron transitions of 5D4 → 7F6, 5D4 → 7F5, 5D4 → 7F4, and 5D4 → 7F3 of Tb3+ respectively. The results of the fluorescent properties analysis indicates that the PS-b-Tb complex has been synthesized successfully.
3.2. Formation of honeycomb-patterned porous films from PS-b-Tb complex amphiphilic copolymers
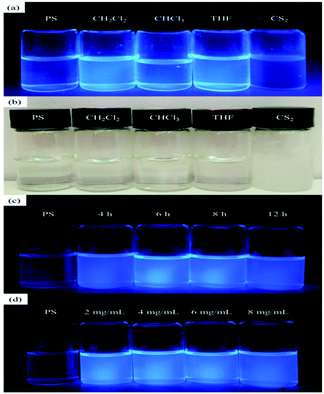
To further investigate the effect of solvent type on the fluorescent properties of PS-b-Tb complex solution, we took pictures of different solvents and concentrations under fluorescent light to make comparisons. As shown in Fig. 3a, the PS-b-Tb complex solutions of dichloromethane, chloroform and THF appear fluorescence properties, but the fluorescence properties of carbon disulfide solution disappears, which catches our attention. Accordingly, the solution was then placed at room temperature for a period of time and we found that only the CS2 solution became cloudy (Fig. 3b). Based on the above phenomena, we infer that the solubility of PS-b-Tb complex in CS2 is poor which leads to fluorescent quenching of PS-b-Tb complex solution in CS2. The photographs (UV 365 nm) of PS-b-Tb complex solution in CH2Cl2 with different molecular weight and concentrations were illustrated in Fig. 3c and d respectively. All of them show good fluorescence characteristics. Therefore, in the following experiment, the dichloromethane was chosen as the solvent to investigate the relationships of BF patterns with solution concentration and copolymers' molecular weight and so on.
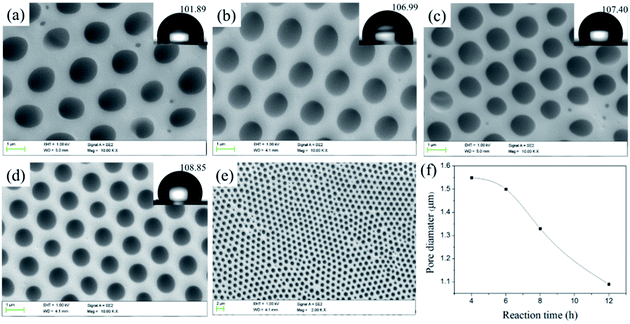
![[thin space (1/6-em)]](https://www.rsc.org/images/entities/char_2009.gif) 700 to 20
700 to 20![[thin space (1/6-em)]](https://www.rsc.org/images/entities/char_2009.gif) 900 and the pore quantity raises slightly accordingly. The results confirm that the length of hydrophilic block is crucial for preparing porous films: the copolymer with hydrophilic block can easily stabilize the water droplets, thus resulting in regular pores. Meanwhile, in the process of the film forming, the larger the polymer molecular weight, the faster the precipitate rate of the polymer, the more difficulty the water droplets can sank into the polymer solution to decrease the pore size.46,47 In addition, the contact angle increases with the increasing of Tb complex block lengths (hydrophilic block) and higher than that of the smooth PS film (considering that the external surface of the porous films is mainly enriched with PS and the water contact angle of the smooth PS film was about 89°). For the porous structure, the air is trapped underneath the droplet and effectively lowers the average surface energy, which are governed by the Cassie–Baxter theory:
900 and the pore quantity raises slightly accordingly. The results confirm that the length of hydrophilic block is crucial for preparing porous films: the copolymer with hydrophilic block can easily stabilize the water droplets, thus resulting in regular pores. Meanwhile, in the process of the film forming, the larger the polymer molecular weight, the faster the precipitate rate of the polymer, the more difficulty the water droplets can sank into the polymer solution to decrease the pore size.46,47 In addition, the contact angle increases with the increasing of Tb complex block lengths (hydrophilic block) and higher than that of the smooth PS film (considering that the external surface of the porous films is mainly enriched with PS and the water contact angle of the smooth PS film was about 89°). For the porous structure, the air is trapped underneath the droplet and effectively lowers the average surface energy, which are governed by the Cassie–Baxter theory:cos![[thin space (1/6-em)]](https://www.rsc.org/images/entities/char_2009.gif) θCB = fs(cos θCB = fs(cos![[thin space (1/6-em)]](https://www.rsc.org/images/entities/char_2009.gif) θs + 1) − 1 θs + 1) − 1 |
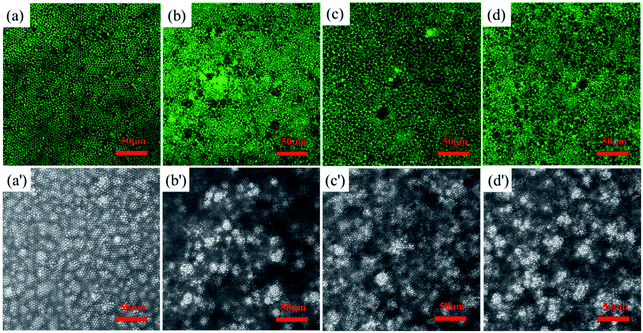
Rare earth element Tb has strong fluorescent properties. Therefore, we cast honeycomb structured PS-b-Tb complex porous films with Tb as a fluorescent probe. The Tb can mark the location of the hydrophilic section owing to the fact that the rare earth ions are directly linked to hydrophilic monomer methacrylic acid by coordinating bond. Fig. 6 shows the LSCM images of the fluorescent functional porous films investigated through a laser scanning confocal microscope. Fig. 6a–d indicates the distribution of the rare earth element Tb in the porous films and many fluorescent signals can be observed, Fig. 6a′–d′ displays the bright field structure of the porous films. From Fig. 6, it can be seen that the locations of fluorescent signals are mostly distributed at the pore wall. According to the formation mechanism of the porous film,11,50,51 the hydrophilic parts can contact and wrap the water droplets and result in the formation of droplet/polymer solution interface during the process of BFM. Our experimental results further verified the mechanisms of BFM.
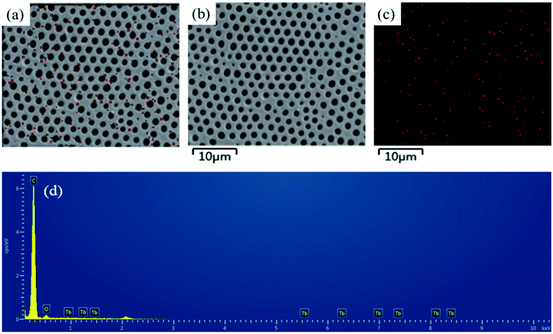
To further investigate the distribution of hydrophilic groups (Tb complex groups) in the honeycomb-patterned porous films, FESEM-EDX was used to detect the rare earth element Tb. Fig. 7 shows the surface elemental mapping of Tb images with their corresponding FESEM images for representative PS-b-Tb complex-2 porous films. The FESEM-EDX analysis confirms that the hydrophilic groups (Tb complex groups) are mainly distributed at the pore walls, instead of at the outer surface layer of the films, which agrees well with the LSCM results.
4. Conclusions
The PS-b-Tb complex honeycomb patterned porous films were fabricated via breath figure method. The surface morphology, structure and the fluorescence properties of the porous films were characterized by FESEM, FT-IR 1H NMR and LSCM, respectively. The influence of solvent types, polymer concentration and copolymers' molecular weight to the surface morphology of honeycomb patterned films were also studied. The pore average diameter of the films decreased with increasing of the molecular weight of PS-b-Tb complex. The porous films were endowed with fluorescent function by loading the Tb complex into the honeycomb patterned porous films. The hydrophilic groups (Tb complex groups) were mainly distributed at the pore walls, instead of at the outer surface layer of the porous films.Conflicts of interest
There are no conflicts to declare.Acknowledgements
We thank the financial supports from the Shandong province higher education science and technology program (J16LA01), the Natural Science Foundation of China (No. 51503094), Natural Science Foundation of Shandong Province (ZR2015BQ002) and Science and Technology Innovation Fund of Liaocheng University (26312161932).References
- Y. He, Y. Chen, Q. Xu, J. Xu and J. Weng, ACS Appl. Mater. Interfaces, 2017, 9, 7826–7833 Search PubMed.
- S. Bera, M. Pal, S. Sarkar and S. Jana, ACS Appl. Mater. Interfaces, 2017, 9, 4420–4424 Search PubMed.
- J. Kameiab and H. Yabu, Soft Matter, 2017, 13, 7834–7839 RSC.
- J. Zhang, Z. Meng, J. Liu, C. Schlaich, Z. Yu and X. Deng, J. Mater. Chem. A, 2017, 5, 16369–16375 Search PubMed.
- B. Yao, Q. Zhu, L. Yao and J. Hao, Appl. Surf. Sci., 2015, 332, 287–294 CrossRef.
- Y. Su, J. Dang, H. Zhang, Y. Zhang and W. Tian, Langmuir, 2017, 33, 7393–7402 CrossRef PubMed.
- Y. C. Chiu, C. C. Kuo, C. J. Lin and W. C. Chen, Soft Matter, 2011, 7, 9350–9358 RSC.
- L. Zhang, L. Chen, S. Liu, J. Gong, Q. Tang and Z. Su, Dalton Trans., 2018, 47, 105–111 RSC.
- G. Widawski, M. Rawiso and B. Francois, Nature, 1994, 369, 387–389 CrossRef.
- M. T. Calejo, T. Ilmarinen, H. Skottman and M. Kellomäki, Acta Biomater., 2018, 66, 44–66 CrossRef PubMed.
- H. Yuan, B. Yu, H. Cong, Q. Peng, Z. Yang, Y. Luo and M. Chi, J. Colloid Interface Sci., 2016, 461, 232–238 CrossRef PubMed.
- C. M. Knobler and D. Beysens, Europhys. Lett., 1988, 6, 707–712 CrossRef.
- R. Narhe, D. Beysens and V. S. Nikolayev, Langmuir, 2004, 20, 1213–1221 CrossRef PubMed.
- R. D. Narhe and D. A. Beysens, Langmuir, 2007, 23, 6486–6489 CrossRef PubMed.
- Y. Hirai, H. Mayama, Y. Matsuo and M. Shimomura, ACS Appl. Mater. Interfaces, 2017, 9, 15814–15821 Search PubMed.
- M. Srinivasarao, D. Collings, A. Philips and S. Patel, Science, 2001, 292, 79–83 CrossRef PubMed.
- D. Ishii and M. Shimomura, Chem. Mater., 2013, 25, 509–513 CrossRef.
- D. Ishii, H. Yabu and M. Shimomura, Chem. Mater., 2009, 21, 1799–1801 CrossRef.
- B. H. Wu, L. W. Wu, K. Gao, S. H. Chen, Z. K. Xu and L. S. Wan, J. Phys. Chem. C, 2018, 122, 3926–3933 Search PubMed.
- M. H. Stenzel-Rosenbaum, T. P. Davis, A. G. Fane and V. Chen, Angew. Chem., Int. Ed., 2001, 40, 3428–3432 CrossRef PubMed.
- L. Vijaya, R. Rajan, A. Raju, T. P. D. Rajan and C. Pavithran, J. Phys. Chem. C, 2017, 121, 15154–15159 Search PubMed.
- T. Nishikawa, R. Ookura, J. Nishida, K. Arai, J. Hayashi, N. Kurono, T. Sawadaishi, M. Hara and M. Shimomura, Langmuir, 2002, 18, 5734–5740 CrossRef.
- E. Ferrari, P. Fabbri and F. Pilati, Langmuir, 2011, 27, 1874–1881 CrossRef PubMed.
- H. Yabu, M. Kojima, M. Tsubouchi, S. Onoue, M. Sugitani and M. Shimomura, Colloids Surf., A, 2006, 284–285, 254–256 CrossRef.
- O. Karthaus, Y. Hashimoto, K. Kon and Y. Tsuriga, Macromol. Rapid Commun., 2007, 28, 962–965 CrossRef.
- T. Kabuto, Y. Hashimoto and O. Karthaus, Adv. Funct. Mater., 2007, 17, 3569–3573 CrossRef.
- B. Wu, M. Zhou, W. Zhang, Y. Liang, F. Li and G. Li, RSC Adv., 2017, 7, 24914–24924 RSC.
- H. Yuan, B. Yu, H. Cong, Q. Peng, Z. Yang, Y. Luo and M. Chi, J. Colloid Interface Sci., 2016, 461, 232–238 CrossRef PubMed.
- L. Vijaya, R. Rajan, A. Raju, T. P. D. Rajan and C. Pavithran, J. Phys. Chem. C, 2017, 121, 15154–15159 Search PubMed.
- L. Ding, A. Zhang, W. Li, H. Bai and L. Li, J. Colloid Interface Sci., 2016, 461, 179–184 CrossRef PubMed.
- L. S. Wan, B. B. Ke, J. Zhang and Z. K. Xu, J. Phys. Chem. B, 2012, 116, 40–47 CrossRef PubMed.
- L. P. Wang, K. Y. Yin, G. Li, Q. Liu, A. X. Deng and H. Y. Ma, React. Funct. Polym., 2016, 99, 59–64 CrossRef.
- B. H. Wu, L. W. Zhu, Y. Ou, W. Tang, L. S. Wan and Z. K. Xu, J. Phys. Chem. C, 2015, 119, 1971–1979 Search PubMed.
- S. Zhang, T. Xu, S. Chai, L. Zhang, L. Wu and H. Li, Polymer, 2017, 117, 306–314 CrossRef.
- L. P. Wang, Y. C. Li, L. F. Chen, C. L. Ban, G. Li and J. J. Ni, J. Colloid Interface Sci., 2014, 420, 112–118 CrossRef PubMed.
- Y. Wang, F. Lorandi, M. Fantin, P. Chmielarz, A. A. Isse, A. Gennaro and K. Matyjaszewski, Macromolecules, 2017, 50, 8417–8425 CrossRef.
- L. Shen, Q. Lu, A. Zhu, X. Lv and Z. An, ACS Macro Lett., 2017, 6, 625–631 CrossRef.
- X. He, J. Lin, W. Zhai, Y. Huang, Q. Li, C. Yu, J. Liang, L. Li, Y. Fang, Z. Liu and C. Tang, J. Phys. Chem. C, 2017, 121, 19915–19921 Search PubMed.
- B. Ma, Y. Wu, S. Zhang, S. Wang, J. Qiu, L. Zhao, D. Guo, J. Duan, Y. Sang, L. Li, H. Jiang and H. Liu, ACS Nano, 2017, 11, 1973–1981 CrossRef PubMed.
- P. Ung, M. Clerc, H. Huang, K. Qiu, H. Chao, M. Seitz, B. Boyd, B. Graham and G. Gasser, Inorg. Chem., 2017, 56, 7960–7974 CrossRef PubMed.
- J. T. Lai, D. Filla and R. Shea, Macromolecules, 2002, 35, 6754–6756 CrossRef.
- F. Su, C. Liu, Y. Yang, S. Ma, G. Sun and X. Yang, Mater. Res. Bull., 2017, 88, 301–307 CrossRef.
- L. Liu, Q. Wang, C. Gao, H. Chen, W. Liu and Y. Tang, J. Phys. Chem. C, 2014, 118, 14511–14520 Search PubMed.
- X. Xiong, W. Zou, Z. Yu, J. Duan, X. Liu, S. Fan and H. Zhou, Macromolecules, 2009, 42, 9351–9356 CrossRef.
- E. Bormashenko, A. Musin, Y. Bormashenko, G. Whyman, R. Pogreb and O. Gendelman, Macromol. Chem. Phys., 2007, 208, 702–709 CrossRef.
- B. H. Wu, Q. Z. Zhong, Z. K. Xu and L. S. Wan, Polym. Chem., 2017, 8, 4290–4298 RSC.
- X. Y. Li, Q. L. Zhao, T. T. Xu, J. Huang, L. H. Wei and Z. Ma, Eur. Polym. J., 2014, 50, 135–141 CrossRef.
- P. C. Chen, L. S. Wan, B. B. Ke and Z. K. Xu, Langmuir, 2011, 27, 12597–12605 CrossRef PubMed.
- B. B. Ke, L. S. Wan, P. C. Chen, L. Y. Zhang and Z. K. Xu, Langmuir, 2010, 26, 15982–15988 CrossRef PubMed.
- J. S. Arora, T. Ponnusamy, R. Zheng, P. Venkataraman, S. R. Raghavan, D. Blakec and V. T. John, Soft Matter, 2015, 11, 5188–5191 RSC.
- Z. Li, Q. Kong, X. Ma, D. Zang, X. Guan and X. Ren, Nanoscale, 2017, 9, 8249–8255 RSC.
Footnote |
| † Electronic supplementary information (ESI) available: Supporting figures; FTIR spectra of hydrophilic PS-b-Tb complex copolymers; 1H NMR spectrum of polystyrene (PS) and PS-b-Tb complex; FESEM images of porous films generated from different solvent. See DOI: 10.1039/c8ra02980f |
| This journal is © The Royal Society of Chemistry 2018 |


