 Open Access Article
N2O emission and bacterial community dynamics during realization of the partial nitrification process
Xiaolin Liua,
Shou-Qing Ni *a,
Wenshan Guo
 b,
Zhibin Wangcd,
Hafiz Adeel Ahmada,
Baoyu Gao
 a and
Xu Fang
 c
c
aShandong Provincial Key Laboratory of Water Pollution Control and Resource Reuse, School of Environmental Science and Engineering, Shandong University, No. 27 Shanda South Road, Jinan 250100, Shandong, PR China. E-mail: sqni@sdu.edu.cn; Fax: +86-531-88365660; Tel: +86-531-88365660
bCentre for Technology in Water and Wastewater, School of Civil and Environmental Engineering, University of Technology Sydney, Sydney, NSW 2007, Australia
cState Key Laboratory of Microbial Technology, Shandong University, No. 27 Shanda South Road, Jinan 250100, Shandong, PR China
dInstitute of Marine Science and Technology, Shandong University, No. 27 Shanda South Road, Jinan 250100, Shandong, PR China
First published on 5th July 2018
Abstract
In this study, greenhouse gas emissions and microbial community succession during the realization of the partial nitrification (PN) process were studied. The results show that N2O emission mainly occurred in the aerobic stage and the PN reactor released about 20 mg of N2O gas each cycle. There is a positive correlation between the dissolved N2O concentration and the temperature of a typical cycle. High-throughput sequencing was used to illustrate succession in the microbial community structure. The most significant microfloral change during the PN startup process was that some aerobic bacteria were relatively enriched and some anaerobic bacteria were weeded out. The ammonia oxidizing bacteria (AOB) like Nitrosomonadaceae were enriched on account of the suitable external environment. Pseudomonas whose main function is denitrification declined and Planctomyces (anammox) showed the same tendency. This study comprehensively demonstrates the fluctuations of dissolved and emitted N2O while researching the succession of the microbial community in the culture of the PN process.
1. Introduction
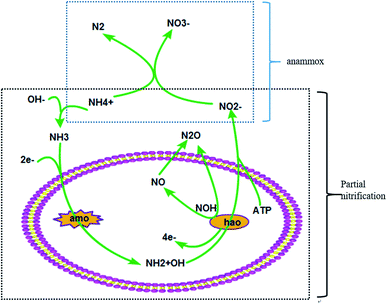
With the development of industry, the problem of climate change has drawn attention from all circles of society.1 The ever-increasing greenhouse gases (GHGs) are really important for addressing the problem of global climate change.2 The production of CO2, CH4 and N2O is the leading contributor to all of the GHGs and takes the main responsibility for global warming.3 Biological treatment is generally applied in sewage disposal plants and has always been deemed a major pathway for GHG emission.4 The process involves the shifting of organics and nitrogen, and generates GHGs in the process of biological sewage treatment.5 CO2 and CH4 are produced alongside the microbial degradation of organic carbon in the biological sewage treatment process.6 It’s reported that CH4 production from WWTPs accounts for ∼5% of global CH4 emissions.7 In addition, the N2O derived from the process of nitrogen transformation especially the nitrification and denitrification processes is also produced during this process.8 Research indicates that N2O emissions from WWTPs are 0.22 TgN per year which is 1.3% of the total N2O production.9 Based on the above evidence, the problem of GHGs discharged from biological sewage treatment plants can counterbalance parts of their environmental benefits.10The partial nitrification (PN) process is a relatively efficient technique for the biotransformation of nitrogen which costs less energy and has a high nitrogen conversion ratio.11 As shown in Fig. 1, the first step is the oxidation of NH4+ to NH2+OH by amo and the second step is the oxidation of NH2+OH to NO2− by hao.9 There is an unstable intermediate named NOH which can produce N2O by chemical decomposition. Another potential pathway is the biological reduction process of NO produced through the oxidation of NH2+OH.
The PN process that oxidizes NH4+ to NO2− has been reported to be technologically feasible and economically viable, especially when wastewater has high concentrations of ammonium and low levels of organic carbon for denitrification.12 The main advantages of partial nitrification compared with complete nitrification are a lower oxygen demand during aeration, less of a requirement for organic substrates for sequential heterotrophic denitrification, low emissions of carbon dioxide (CO2) and less sludge production.13 Therefore, this technology enables the low cost transformation of nitrogen from wastewater.
The PN process has been used to provide suitable conditions for anammox (anaerobic ammonia oxidation) bacteria by transforming NH4+ to NO2− in practical applications. As reported by Assis et al. (2017), the PN process has been started successfully by culturing with poultry slaughterhouse wastewater in which the NH4+ concentration was 64 ± 10 mg L−1.14 The microbiological analysis demonstrated that Nitrosomonas was enriched to transform NH4+ to NO2−. Some researchers have also reported that the PN strategy has been applied to the landfill leachate treatment field. The PN process is required to transfer half of the NH4+ to NO2− to ensure there is the correct ratio of NH4+ and NO2− because of a deficiency of NO2− in the raw landfill leachate.15
With the achievement of the PN process, the composition of the various existing microbial communities shifts to an ammonia oxidizing bacteria (AOB) dominant community.16 The realization and control of the PN process is not very easy. Many strategies have been used to enhance the PN process and many researchers have studied the underlying causes affecting the PN process. A nitrifying granular sludge reactor has been used to accumulate nitrite and it sustained a stable PN process for more than 300 days. A 5 mT magnetic field was used to enhance the PN process by improving the bacterial activity through regulating the expression of transshipment protein genes.17 A salinity of 1.35% was confirmed to enhance both AOB and anammox bacteria activities during the combined PN-anammox process.18 There are three major N2O production pathways during wastewater treatment, namely NH2OH oxidation, nitrifier (AOB) denitrification, and heterotrophic denitrification pathways, among which NH2OH oxidation and nitrifier (AOB) denitrification exist in the PN process.19 Although a lot of researchers have focused on the microbial community, few studies have been carried out regarding N2O emission and microbial community dynamic changes during the startup of the PN process. As low dissolved oxygen (DO) concentrations and high nitrite concentrations in the PN process could increase N2O emissions, the characteristics of N2O emission may differ from the complete nitrification process.20 In this study, a lab-scale sequencing batch reactor (SBR) for the PN process was constructed and the characteristics of N2O emission during this process were investigated. Dynamic changes in the characteristics of microbial communities during the PN process were also evaluated using high-throughput sequencing techniques.
2. Materials and methods
2.1. Experiment operation and reactor parameters
The working volume of the polymethacrylate SBR is 6 L. The SBR operating procedure is divided into four parts: 5 min feeding, 340 min aeration, 10 min settling and 5 min discharging. The exchange ratio of fresh influent is 50%.21 The hydraulic retention time of this system was 12 h and the temperature was around 31 ± 2 °C to provide a suitable environment for the PN process.22 A magnetic stirring apparatus was used to sustain uniform mixing conditions for the activated sludge and water to ensure all the sludge was involved in the reaction processes. A certain amount of suspended sludge was removed from the reactor every day to maintain a 3000 mg L−1 sludge concentration.232.2. Acclimated sludge and synthesized wastewater
The seed sludge acclimated in the SBR with mixed liquor suspended solids (MLSS) at a concentration of 3160 mg L−1 was collected from the First Guangda Sewage Treatment Plant, in Jinan, China. An appropriate DO concentration of about 0.35–0.8 mg L−1 was maintained during the experiment for the startup of the PN process.To enrich AOB and eliminate nitrite oxidizing bacteria (NOB), a high NH4+–N, and slightly alkaline medium was prepared. Water intake was 3 L per cycle. The composition of the synthetic medium was as follows: NH4HCO3 (2.82 g L−1), KH2PO4 (0.81g L−1), CaCl2 (0.2g L−1), and MgSO4·7H2O (0.03g L−1). A trace element solution was prepared and added as described by Wang et al. (2017).17 The final pH of the medium was 8.0 ± 0.1, and no pH control was applied during the experimental period. Sludge samples were taken on day 1, day 20 and day 30 for molecular testing.
2.3. Analytical methods
Water samples were filtered through syringe nylon membrane filters (0.45 μm) to remove biomass. The NH4+, NO2− and NO3− concentrations in the water were measured every three days. The MLSS concentration of the activated sludge was also determined. DO and pH were determined using a Hach HQ40d multimeter (Hach, America) and a Leici PHS-3C apparatus (Leici, China), respectively.Gas from the SBR was collected using a portable gas collection pump every 30 min. An AGC-ECD (Agilent 7890B, USA) equipped with a chromatographic detector was used to do the gas analysis of N2O. Sample analysis was finished in 24 h after collection on account of the reference method.24 The temperatures of the chromatographic detector for the injection port and the column were set at 50 °C and 390 °C.25
2.4. Sample collection, DNA extraction, PCR amplification, sequencing and data analysis
Sludge taken from the SBR was centrifuged at 6500g (Sigma3k15, Germany) for 15 min to remove the supernatant. Genomic DNA was isolated from 0.5 g wet sludge with the help of a power soil DNA isolation kit (MO BIO Laboratories, USA) following the protocol provided by the manufacturer. After the detection of the DNA content, V4 of 16S rDNA was PCR amplified from microbial genomic DNA using bar-coded fusion primers (forward primer: AYTGGGYDTAAAGNG, and reverse primer: TACNVGGGTATCTAATCC). Bar-coded V4 amplicons were sequenced using the pair-end method by Illumina Miseq sequencing (Personal Biotechnology Co., Ltd., Shanghai, China). The database referenced was Greengenes. Biostatistical analyses were performed in this research using an algorithm supported by the SPSS13.0 (IBM, USA) software.263. Results and discussion
3.1. Realization of partial nitrification and nitrogen transformation
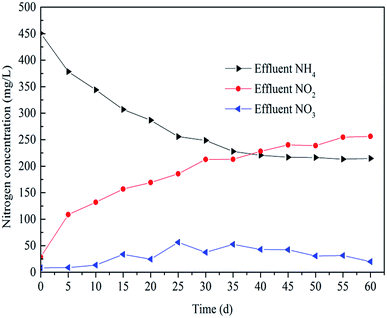
After 35 days operation, the PN process was realized as shown in Fig. 2. The concentration of NO2− increased from nearly 0 to 250 mg L−1 and the concentration of NH4+ decreased from 450 mg L−1 to 225 mg L−1. The transformation rate of NH4+ in the SBR was about 50%. It is clear that the removal of NH4+ was mainly realized by its transformation into NO2−. The startup time was shorter than previously reported studies. Kong et al.21 reported that the PN process was obtained at the 57th day and the time for Wan et al.27 was 52 days. This means the conditions were more suitable for the growth of AOB in this study.3.2. Release character of N2O in a typical cycle period
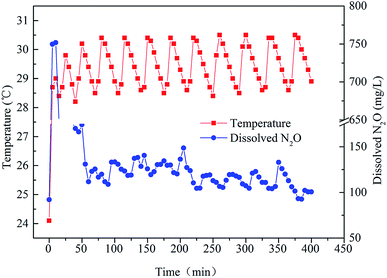
Fig. 3 shows the relationship between temperature and dissolved N2O during a typical cycle (0–360 min). As can be seen from the figure, the dissolved N2O decreased from 750 mg L−1 to about 100–150 mg L−1 after 70 minutes, while the temperature of the SBR was in the range of 28.5–30.5 °C during the typical cycle. The fluctuation of the temperature was caused by the heating rod.During the first 5 min, the SBR was filled with wastewater. In this stage, N2O was produced by bacteria dissolved in the liquid without aeration. This explains why the concentration of dissolved N2O was up to nearly 750 mg L−1 in the first 5 min. Then, the anoxic stage started. During this phase, as dissolved N2O was emitted to the surroundings along with the bubbles created, its concentration decreased sharply during the 5–60 min timeframe. Afterwards, the concentration of dissolved N2O was relatively stable (60–225 min). After 225 min, the concentration of dissolved N2O became relatively lower compared with previous concentrations. Another phenomenon (Fig. 3) was that dissolved N2O increased along with the increase in temperature during a temperature cycle. Although the microbes related to N2O emission were Nitrosomonadaceae,28 the structure of a microbial community cannot alter during a cycle. However, the activities of the enzymes in bacteria can vary with temperature.
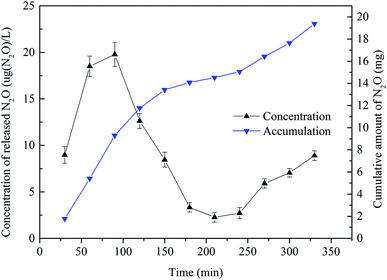
Fig. 4 shows that the discharge of N2O fluctuated widely in a typical cycle period. The N2O emission rose at the beginning of the cycle up to its maximum at 75 min of about 19.78 μg (N2O) L−1. The rational explanation of this variation is as follows. At the end of the previous cycle, the produced N2O was dissolved in water. At the aeration stage, the N2O gas was emitted to the air along with the release of bubbles. After 75 min, the emission rate of N2O decreased gradually. This was because the dissolved N2O concentration in solution dropped to a relatively stable level at that time as shown in Fig. 3. At 240 min, the concentration was only about 2.5 μg (N2O) L−1. At 330 min, the concentration of released N2O was 8.90 μg (N2O) L−1, and the cumulative amount during the cycle was almost 20 mg N2O. The cumulative amount of N2O during 0–240 min was about 15.05 mg and the translating ratio was 1.915%. This value is very close to the 1.9% reported by de Graaff et al.11 using a lab-scale reactor. But on prolonging the cycle to 360 min, the cumulative amount of N2O was 19.39 mg, and the translating ratio increased to 2.468%. So prolonging the PN cycle time could not increase the translating ratio of NH4+ but could increase the emission of N2O.
3.3. Microbial community succession during the realization of the PN process
The variation of the effluent quality during different periods implies that the cultured activated sludge has different microbial communities. Second generation DNA sequencing technology for 16S rDNA amplicons was used to study the succession of the microbial community.Sequences obtained from the second generation DNA sequencing technology of variable 16S rDNA genes were analyzed using the OTUs (Operational Taxonomic Units)-based approach. Remarkable changes in the microbial community composition and diversity appeared during the startup of the PN process. A total of 17![[thin space (1/6-em)]](https://www.rsc.org/images/entities/char_2009.gif) 685, 15
685, 15![[thin space (1/6-em)]](https://www.rsc.org/images/entities/char_2009.gif) 562 and 15
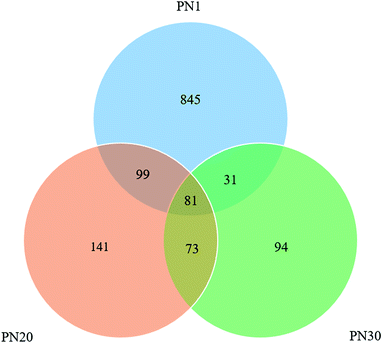
562 and 15![[thin space (1/6-em)]](https://www.rsc.org/images/entities/char_2009.gif) 165 reads were obtained for PN1 (sludge sampled on day 1), PN20 (sludge sampled on day 20) and PN30 (sludge sampled on day 30), respectively. The number of OTUs for PN1 was 1056 while the number of OTUs for PN20 was 394 and for PN30 the value was 279. Overall, the three samples share 81 of the same OTUs (Fig. 5). The phenomenon of the decrease in OTUs during the process of sludge acclimatization is very common.29 In a study reported by Zhang et al.,30 the OTUs of two samples before acclimatization were 1986 and 1648 while after acclimatization the numbers were 494 and 381.
165 reads were obtained for PN1 (sludge sampled on day 1), PN20 (sludge sampled on day 20) and PN30 (sludge sampled on day 30), respectively. The number of OTUs for PN1 was 1056 while the number of OTUs for PN20 was 394 and for PN30 the value was 279. Overall, the three samples share 81 of the same OTUs (Fig. 5). The phenomenon of the decrease in OTUs during the process of sludge acclimatization is very common.29 In a study reported by Zhang et al.,30 the OTUs of two samples before acclimatization were 1986 and 1648 while after acclimatization the numbers were 494 and 381.
The community richness decreased during the startup period of the PN process. As shown in Table 1, the Chao1 estimators were 1218.51, 603.72 and 396.86 on day 0, day 20 and day 30, respectively. The ACE (abundance-based coverage estimator), another index to illustrate bacterial richness, during the PN process also decreased from 1278.79 on day 1 to 720.71 on day 20 and further to 480.98 on day 30. The community diversity also decreased during the PN startup process. Community diversity was revealed by the Simpson index and the Shannon index. The Shannon estimators were 5.367, 3.867 and 3.234 on day 0, day 20 and day 30, respectively. The Simpson estimators, negatively associated with bacterial diversity, during the PN process increased from 0.012 on day 1 to 0.044 on day 20 and then to 0.082 on day 30. A similar phenomenon was also found by Liang Y. et al.31 They reported that the Shannon indexes at the beginning of two PN processes were 5.817 and 5.860, and at the end they were 5.460 and 5.385.31 The decreases in the biodiversity and the richness were mostly caused by the culture environment. Some controlled factors like relatively high NH4+ and DO concentrations provided suitable environmental conditions for AOB but depressed NOB. The changes in the community structure will be discussed in detail later.
| Sample | Chao1 | ACE | Simpson | Shannon |
|---|---|---|---|---|
| PN1 | 1218.51 | 1278.79 | 0.012 | 5.367 |
| PN20 | 603.72 | 720.71 | 0.044 | 3.867 |
| PN30 | 396.86 | 480.98 | 0.082 | 3.234 |
Fig. 6 shows the succession of the microbial community during the PN startup process at three different taxonomic taxa through analyzing the bacterial genomic sequences from samples taken on days 1, 20 and 30. The results demonstrate that the microbial community composition experienced a remarkable change from day 1 to day 30. At the level of the phylum classification (Fig. 6A), the results show that the amount of Bacteroidetes increased from 16.8% on day 1 to 36.9% on day 20 and 45.7% on day 30. In contrast, the amount of Proteobacteria decreased from 50.5% on day 1 to 40.7% on day 20 and 37.3% on day 30. Proteobacteria (50.5%) accounted for the largest proportion at the phylum level on day 1 and includes many bacteria responsible for nitrogen fixation. There were also many important AOB such as Betaproteobacteria and Gammaproteobacteria. According to the class assignment results (Fig. 6B), the relative abundance of Saprospirae belonging to Bacteroidetes increased from 11.2% on day 1 to 17.5% on day 30 while Betaproteobacteria belonging to Proteobacteria decreased from 32.32% on day 1 to 27.02% on day 30. Based on the family level (Fig. 6C), the relative abundance of Comamonadaceae belonging to Proteobacteria increased from 5.61% on day 1 to 9.11% on day 20 and 13.98% on day 30. The family Comamonadaceae is demonstrated to be a type of nitrate reducing bacteria under a low oxygen supply.32,33 In this research, the DO concentration was always under 0.8 mg L−1 which is a suitable condition for nitrate reducing bacteria.
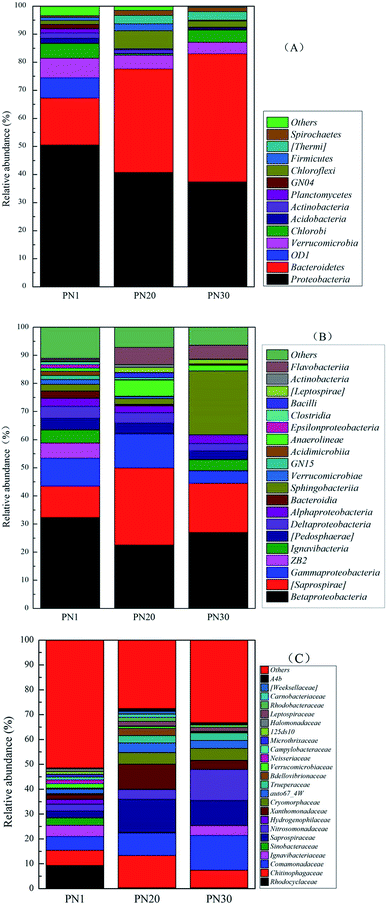 | ||
| Fig. 6 The taxonomic classifications of the bacterial community during the PN startup process at the phylum (A), class (B) and family (C) levels. | ||
A total of 17![[thin space (1/6-em)]](https://www.rsc.org/images/entities/char_2009.gif) 685, 15
685, 15![[thin space (1/6-em)]](https://www.rsc.org/images/entities/char_2009.gif) 562 and 15
562 and 15![[thin space (1/6-em)]](https://www.rsc.org/images/entities/char_2009.gif) 165 reads were acquired on day 0, day 20 and day 30, respectively. The abundance variations of five representative functional microbes (denitrifying bacteria (DNB), AOB, NOB, anammox bacteria and phosphorus-accumulating bacteria (PAO)) were selected to reveal the functional changes in the microbial community. Three genera of DNB (Pseudomonas, Paracoccus, and Thiobacillus) were detected and their abundances changed significantly before and after the startup process. From Table 2, it can be seen that the relative abundances of Thiobacillus and Pseudomonas decreased highly significantly (p < 0.01) while the relative abundance of Paracoccus increased dramatically (p < 0.01) during the startup period. The richness of Nitrosomonadaceae (AOB) increased from 2.59% to 3.79% and reached 12.40% finally (p < 0.01) at the family level of bacteria. The relative abundances of Pseudomonas and Planctomyces (anammox) exhibited a decreasing trend during the PN process at the genus level of bacteria. Generally, PAO bacteria include Pseudomonas, Arthrobacter, Nocardia, Beyerinkia, Ozotobacter, Aeromonas, Microlunatus, and Rhodocyclus (Rittmann et al., 2012).34 In this study, only two genera of PAO were detected, namely Pseudomonas and Arthrobacter.
165 reads were acquired on day 0, day 20 and day 30, respectively. The abundance variations of five representative functional microbes (denitrifying bacteria (DNB), AOB, NOB, anammox bacteria and phosphorus-accumulating bacteria (PAO)) were selected to reveal the functional changes in the microbial community. Three genera of DNB (Pseudomonas, Paracoccus, and Thiobacillus) were detected and their abundances changed significantly before and after the startup process. From Table 2, it can be seen that the relative abundances of Thiobacillus and Pseudomonas decreased highly significantly (p < 0.01) while the relative abundance of Paracoccus increased dramatically (p < 0.01) during the startup period. The richness of Nitrosomonadaceae (AOB) increased from 2.59% to 3.79% and reached 12.40% finally (p < 0.01) at the family level of bacteria. The relative abundances of Pseudomonas and Planctomyces (anammox) exhibited a decreasing trend during the PN process at the genus level of bacteria. Generally, PAO bacteria include Pseudomonas, Arthrobacter, Nocardia, Beyerinkia, Ozotobacter, Aeromonas, Microlunatus, and Rhodocyclus (Rittmann et al., 2012).34 In this study, only two genera of PAO were detected, namely Pseudomonas and Arthrobacter.
| Name of bacteria | Level | R1 | R20 | R30 | |
|---|---|---|---|---|---|
| a *, ** statistically significant at p < 0.05 and p < 0.01, respectively. | |||||
| DNB | Pseudomonas | Genus | 23 | 1** | 8* |
| Paracoccus | Genus | 5 | 150** | 50** | |
| PAO | Thiobacillus | Genus | 359 | 12** | 0** |
| Pseudomonas | Genus | 23 | 1** | 8* | |
| Arthrobacter | Genus | 0 | 32** | 3 | |
| NOB | Nitrospirales | Order | 3 | 2 | 2 |
| AOB | Nitrosomonadaceae | Family | 457 | 590** | 1880** |
| Anammox | Planctomyces | Genus | 42 | 2** | 1** |
| Total reads | Genus | 17![[thin space (1/6-em)]](https://www.rsc.org/images/entities/char_2009.gif) 685 685 |
15![[thin space (1/6-em)]](https://www.rsc.org/images/entities/char_2009.gif) 562 562 |
15![[thin space (1/6-em)]](https://www.rsc.org/images/entities/char_2009.gif) 165 165 |
|
Nitrosomonadaceae (AOB) have the ability to oxidize NH4+ to NO2−. The increased amount of Nitrosomonadaceae indicates the successful startup of the PN process.35 As shown by Fig. 2 and Table 2, the NO2− converted from NH4+ was positively related to the AOB abundance through the startup of the PN process. As reported by Zhang et al. (2016), AOB were the dominant bacterial group in the microbial composition in the PN process. Compared to NOB, AOB could survive under the elevated NH4+ concentrations because of their lower NH4+ inhibition constants.36 Therefore, the relatively high NH4+ concentrations enabled the successful elimination of NOB from the seeding sludge.
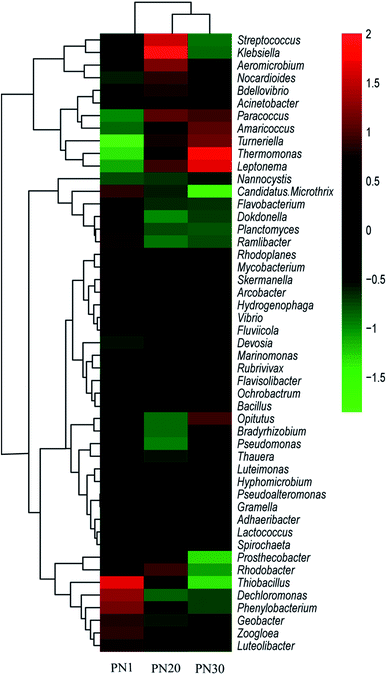
A total of 217, 272 and 289 genera were detected in PN1, PN20 and PN30 respectively. A heat map including 49 abundant genera was drawn to visually render the same/different comparisons between the three samples (Fig. 7). The results show that the microbes at the level of the genus were quite diverse among the samples. Dechloromonas (4.1%) was the most abundant genus in PN1, followed by Thiobacillus (2.0%). Klebsiella was the most abundant genus in PN20. The most abundant genus in PN30 was Thermomonas (2.6%). During the succession process, the dominant genus changed from anaerobic bacteria to facultative aerobes and facultative anaerobes.
There are also other technologies applied for the treatment of wastewater containing ammonia nitrogen such as the bio-treatment technology of membrane processes. The dominant bacteria changed from Ectothiorhodospira to Caenispirillum and Pannonibacter during the stable operation of a photosynthetic bacteria-membrane bioreactor.37 The bacterial community shift along with changes in the operational conditions in a membrane-aerated biofilm reactor has also been researched and the results showed that Betaproteobacteria, Gammaproteobacteria and Alphaproteobacteria were the dominant bacteria in the original sludge similar to the PN process.38 But the abundance of Actinobacteria increased while Deltaproteobacteria decreased during the operation of this membrane-aerated biofilm reactor.38
4. Conclusion
The PN process was acquired successfully in 35 days by controlling the DO. The N2O emission in a typical cycle was associated with fluctuations of external factors other than the changes in microbes. The abundance of species and the community diversity of bacteria decreased when the PN startup process was completed as shown by high-throughput sequencing analysis. The relative abundance of Nitrosomonadaceae, bacteria related to N2O emission, increased highly significantly. The heat map showed that the dominant genus changed from anaerobic bacteria (Dechloromonas) to facultative aerobes (Streptococcus) and facultative anaerobes (Klebsiella). Finally Thermomonas was the most abundant genus.Conflicts of interest
There are no conflicts to declare.Acknowledgements
The authors gratefully acknowledge the support from the National Natural Science Foundation of China (21477063, 21777086), Taishan Scholar Program (ts201511003), Natural Science Foundation for Distinguished Young Scholars of Shandong Province (JQ201809), Key R & D project of Shandong Province (2016GSF117032), Young Scholars Program of Shandong University (2016WLJH16), Fundamental Research Funds of Shandong University (2016JC031), and Shandong Provincial Water Conservancy Research and Technology Promotion Project (SDSLKY201802).References
- N. Stern, World Economics, 2006, 7, 1–10 Search PubMed.
- D. A. Stainforth, T. Aina, C. Christensen and M. Collins, Nature, 2005, 433, 403 CrossRef PubMed.
- Q. Kong, Z. B. Wang, P. F. Niu and M. S. Miao, Bioresour. Technol., 2016, 210, 94–100 CrossRef PubMed.
- J. Vázquez-Padín, M. Figueroa, J. Campos, A. Mosquera-Corral and R. Méndez, Sep. Purif. Technol., 2010, 74, 178–186 CrossRef.
- L. Yerushalmi, F. Haghighat and M. B. Shahabadi, Contribution of on-site and off-site processes to greenhouse gas (GHG) emissions by wastewater treatment plants, World Academy of Science, Engineering and Technology, 2009, vol. 54, pp. 618–622 Search PubMed.
- F. Cakir and M. Stenstrom, Water Res., 2005, 39, 4197–4203 CrossRef PubMed.
- M. El-Fadel and M. Massoud, Environ. Pollut., 2001, 114, 177–185 CrossRef PubMed.
- S. Vlaeminck, H. De Clippeleir and W. Verstraete, Microb. Biotechnol., 2012, 5, 433–448 CrossRef PubMed.
- M. J. Kampschreur, H. Temmink, R. Kleerebezem, M. S. Jetten and M. C. van Loosdrecht, Water Res., 2009, 43, 4093–4103 CrossRef PubMed.
- Y. Q. Liang, G. Y. Huang, G. G. Ying, S. S. Liu, Y. X. Jiang, S. Liu and F. j. Peng, Environ. Toxicol. Chem., 2015, 34, 112–119 CrossRef PubMed.
- M. S. de Graaff, G. Zeeman, H. Temmink, M. C. M. van Loosdrecht and C. J. N. Buisman, Water Res., 2010, 44, 2171–2178 CrossRef PubMed.
- S. Qiao, N. Matsumoto, T. Shinohara, T. Nishiyama, T. Fujii, Z. Bhatti and K. Furukawa, Bioresour. Technol., 2010, 101, 111–117 CrossRef PubMed.
- G. Ciudad, O. Rubilar, P. Muñoz, G. Ruiz, R. Chamy, C. Vergara and D. Jeison, Process Biochem., 2005, 40, 1715–1719 CrossRef.
- T. M. d. Assis, M. V. Schilichting, C. L. Lopes, A. Kunz and S. D. Gomes, Eng. Agric., 2017, 37, 323–332 Search PubMed.
- L. Zhu and L. Jun-xin, J. Environ. Sci., 2007, 19, 523–529 CrossRef.
- Y. Liang, D. Li, X. Zhang, H. Zeng, Z. Yang and J. Zhang, Bioresour. Technol., 2014, 169, 103–109 CrossRef PubMed.
- Z. Wang, X. Liu, S.-Q. Ni, J. Zhang, X. Zhang, H. A. Ahmad and B. Gao, Water Res., 2017, 120, 190–198 CrossRef PubMed.
- X. Li, Y. Yuan, Y. Yuan, Z. Bi, X. Liu, Y. Huang, H. Liu, C. Chen and S. Xu, Bioresour. Technol., 2018, 249, 550–556 CrossRef PubMed.
- B.-J. Ni and Z. Yuan, Water Res., 2015, 87, 336–346 CrossRef PubMed.
- J. Gabarró, P. González-Cárcamo, M. Ruscalleda, R. Ganigué, F. Gich, M. Balaguer and J. Colprim, Bioresour. Technol., 2014, 163, 92–99 CrossRef PubMed.
- Q. Kong, S. Liang, J. Zhang, H. Xie, M. Miao and L. Tian, Bioresour. Technol., 2013, 127, 400–406 CrossRef PubMed.
- D. Wei, T. Yan, K. Zhang, Y. Chen, N. Wu, B. Du and Q. Wei, Bioresour. Technol., 2017, 240, 171–176 CrossRef PubMed.
- P. Bao, S. Wang, B. Ma, Q. Zhang and Y. Peng, J. Environ. Sci., 2017, 56, 71–78 CrossRef PubMed.
- A. Mosier, P. Pendall and J. Morgan, Atmospheric Chemistry and Physics Discussions, 2003, 3, 2691–2706 CrossRef.
- J. Wu, J. Zhang, W. Jia, H. Xie, R. R. Gu, C. Li and B. Gao, Bioresour. Technol., 2009, 100, 2910–2917 CrossRef PubMed.
- Z.-B. Wang, M.-S. Miao, Q. Kong and S.-Q. Ni, Desalin. Water Treat., 2016, 57, 23516–23521 CrossRef.
- C. Wan, S. Sun, D.-J. Lee, X. Liu, L. Wang, X. Yang and X. Pan, Bioresour. Technol., 2013, 142, 517–522 CrossRef PubMed.
- W. Jia, S. Liang, H. H. Ngo, W. Guo, J. Zhang, R. Wang and Y. Zou, Bioresour. Technol., 2013, 141, 123–130 CrossRef PubMed.
- Q. Kong, Z.-b. Wang, P.-f. Niu and M.-s. Miao, Bioresour. Technol., 2016, 210, 94–100 CrossRef PubMed.
- L. Ye, M.-F. Shao, T. Zhang, A. H. Y. Tong and S. Lok, Water Res., 2011, 45, 4390–4398 CrossRef PubMed.
- Y. Liang, D. Li, H. Zeng, C. Zhang and J. Zhang, Bioresour. Technol., 2015, 196, 741–745 CrossRef PubMed.
- S. T. Khan, Y. Horiba, M. Yamamoto and A. Hiraishi, Appl. Environ. Microbiol., 2002, 68, 3206–3214 CrossRef PubMed.
- T. Sadaie, A. Sadaie, M. Takada, K. Hamano, J. Ohnishi, N. Ohta, K. Matsumoto and Y. Sadaie, Biosci., Biotechnol., Biochem., 2007, 71, 791–799 CrossRef PubMed.
- B. E. Rittmann and P. L. McCarty, Environmental biotechnology: principles and applications, Tata McGraw-Hill Education, 2012 Search PubMed.
- J. Hou, L. Xia, T. Ma, Y. Zhang, Y. Zhou and X. He, Bioresour. Technol., 2017, 232, 10–17 CrossRef PubMed.
- X. Zhang, Y. Liang, Y. Ma, J. Du, L. Pang and H. Zhang, Ecol. Eng., 2016, 93, 104–111 CrossRef.
- M. Peng, A. Yang, Y. Chen, G. Zhang, F. Meng, X. Ma and Y. Li, Bioresource Technology Reports, 2018, 1, 1–8 CrossRef.
- H. L. Tian, J. Y. Zhao, H. Y. Zhang, C. Q. Chi, B. A. Li and X. L. Wu, Appl. Microbiol. Biotechnol., 2015, 99, 3279–3290 CrossRef PubMed.
| This journal is © The Royal Society of Chemistry 2018 |

