 Open Access Article
Creative Commons Attribution 3.0 Unported Licence
Ionic-exchange immobilization of ultra-low loading palladium on a rGO electro-catalyst for high activity formic acid oxidation
Jiuxiao Sun†
a,
Xingying Luo†b,
Weiwei Cai *b,
Jing Lib,
Zhao Liub,
Jie Xiongb and
Zehui Yang
 *b
*b
aCollege of Materials Science and Engineering, Wuhan Textile University, Fangzhi RD, Wuhan, 430200, China
bSustainable Energy Laboratory, Faculty of Materials Science and Chemistry, China University of Geosciences (Wuhan), 388 Lumo Road, 430074, Wuhan, P. R. China. E-mail: willcai1985@gmail.com; caiww@cug.edu.cn; yeungzehui@gmail.com
First published on 22nd May 2018
Abstract
A formic acid oxidation electro-catalyst with ultra-low palladium (Pd) loading was prepared via an ionic exchange method by utilizing the acidic functional groups on graphene oxide (GO). After simultaneous reduction of exchanged Pd2+ and residual functional groups on the GO surface, an ionic exchange reduced Pd catalyst supported on reduced GO (IE-Pd/rGO) was obtained. Three times improved formic acid oxidation mass activity compared with that of the conventional synthesized Pd/C catalyst was exhibited for the IE-Pd/rGO catalyst. More importantly, formic acid oxidation stability on the IE-Pd/rGO catalyst was remarkably improved due to synergistic effect of the strong immobilization of Pd nanoparticles and the effect of in situ doped N on the rGO support.
1. Introduction
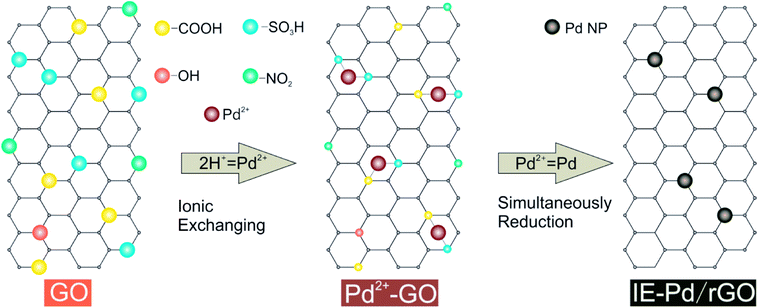
Formic acid (FA) has been considered as one of the most potential alternative liquid fuels to replace methanol in direct liquid fuel cells due to the much faster kinetics of the FA oxidation reaction (FAOR) than that of the methanol oxidation reaction1–4 and much lower fuel crossover rate through the proton exchange membrane.5,6 Despite the development on Pt based FAOR catalysts,7–10 noble metal palladium (Pd) electro-chemical catalysts11–13 are required for FA oxidation catalysis to achieve satisfactory power output of the direct formic acid fuel cell (DFAFC).14–22 Other than the high cost of Pd, poor FAOR stability on Pd catalyst is also an important issue strongly hinders the practical application of DFAFC technology.23,24 In order to overcome this stability issue, numerous strategies were carried out to alter the FAOR process or to improve the efficiency of single Pd active sites.25,26 Among these strategies, doping a second metal with Pd to change the FAOR process is the most commonly used one.27–30 Due to the electron effect31 or the third-body effect,32,33 generation of Pd poison intermediates can be suppressed. Most mechanism studies claimed that continuous Pd active sites should be isolated no matter what the poison intermediate was.34–36 An alternative strategy is to stabilize the Pd nanoparticles isolated during the DFAFC operation.36 The best route to stably isolate the Pd nanoparticles is mono-dispersing the nanoparticles on graphene,37–39 which has been widely studied as catalyst support40 due to the great electronic conductivity and abundant surface functional groups on graphene oxide (GO).41–43 Plenty of Pd/graphene catalysts were therefore developed with improved FAOR catalytic performance than the conventional Pd/C catalysts.44,45 However, Pd loading in the reported Pd/graphene catalysts is still high.39In the present work, a novel route (Fig. 1) was proposed to synthesis highly active Pd loaded reduced GO (rGO) catalyst with ultra-low palladium loading. Acidic functional groups, including –COOH and –SO3H, generated on GO surface was used for Pd2+ exchange during this ionic-exchange assisted synthesis process. The exchanged Pd2+ on GO surface was subsequently in situ reduced together with the residual oxidation functional groups, e.g. –OH and NO2 groups. Pd nanoparticles were therefore stably anchored on rGO to produce an ionic exchange assisted Pd/rGO (IE-Pd/rGO) catalyst. The IE-Pd/rGO catalyst exhibited great catalytic efficiency and stability for FAOR compared with the conventional prepared Pd/C catalyst. As a result, with only ca. 7 wt% Pd loaded, the IE-Pd/rGO FAOR catalyst performed much better than the conventional Pd/C with more than 20 wt% Pd loaded in terms of both electrochemical oxidation current and stability.
2. Experimental
2.1. Catalyst synthesis
2.2. Characterization
Powder X-ray diffraction (XRD) analyses were performed on a Bruker D8-FOCUS Advance diffractometer with Cu Kα radiation (λ = 1.540598 Å). The average crystal size of the Pd nanoparticles was subsequently calculated using the Scherrer equation (D = 0.9λ/β![[thin space (1/6-em)]](https://www.rsc.org/images/entities/char_2009.gif) cos
cos![[thin space (1/6-em)]](https://www.rsc.org/images/entities/char_2009.gif) θ, where λ = 1.540598 Å is the wavelength of the X-ray, β is the full-width at half-maximum height and θ is the diffraction angle).48 Surface morphology of the prepared catalyst was characterized by scanning electron microscopy (SEM) on a Hitachi-SU8010 microscope. Transmission electron microscopy (TEM) analysis on the catalysts was carried out on Tecnai G220 microscope. The surface composition of the IE-Pd/rGO catalyst was analyzed using a ULVAC-PHI Quantera II photoelectron spectroscopy (XPS) system with Al Kα radiation (hν = 1486.6 eV). The thermogravimetric (TG) analysis was carried out on a STA449F3 thermogravimetric analyzer under an O2 atmosphere from 30 to 800 °C at a heating rate of 10 °C min−1. Pd loading of the catalysts was calculated from the residual weight ratio at 800 °C of the sample (xPd = wreMPd/MPdO, where wre is the residual weight ratio of the sample, MPd and MPdO are the molecular weight of Pd and PdO, respectively).
θ, where λ = 1.540598 Å is the wavelength of the X-ray, β is the full-width at half-maximum height and θ is the diffraction angle).48 Surface morphology of the prepared catalyst was characterized by scanning electron microscopy (SEM) on a Hitachi-SU8010 microscope. Transmission electron microscopy (TEM) analysis on the catalysts was carried out on Tecnai G220 microscope. The surface composition of the IE-Pd/rGO catalyst was analyzed using a ULVAC-PHI Quantera II photoelectron spectroscopy (XPS) system with Al Kα radiation (hν = 1486.6 eV). The thermogravimetric (TG) analysis was carried out on a STA449F3 thermogravimetric analyzer under an O2 atmosphere from 30 to 800 °C at a heating rate of 10 °C min−1. Pd loading of the catalysts was calculated from the residual weight ratio at 800 °C of the sample (xPd = wreMPd/MPdO, where wre is the residual weight ratio of the sample, MPd and MPdO are the molecular weight of Pd and PdO, respectively).
2.3. Electrochemical measurements
Electro-catalytic activities of the prepared catalysts were measured in a three-electrode cell using a VMP3 electrochemical workstation. The three-electrode electrochemical cell using a glassy carbon (GC) electrode (3 mm in diameter) coated with catalyst serving as the working electrode, a saturated calomel electrode (SCE) and a graphite rod as the reference electrode and the counter electrode, respectively. The catalyst inks were prepared by ultrasonically mixing of catalyst (4 mg), ethanol (0.20 mL, 99 wt%), Nafion solutions (0.05 mL, 5 wt%) and deionized water (0.75 mL). After evenly dispersed, 10 μL of the suspension was drop dipped onto the GC electrode and subsequently used as the working electrode in measurements. This was repeated once so that it had a loading of 0.56617 mg cm−2 catalyst, and the coating was dried at room temperature for 30 min.Cyclic voltammetry (CV) measurements were carried out in N2-saturated 0.5 M H2SO4 at a scanning rate of 20 mV s−1. Electrochemical surface area (ECSA) of the catalyst can be calculated from charges (Q) involved in the hydrogen adsorption processes according to the equation of ECSA = Q/0.42 mC cm−2 × MPd,3,49 where MPd is the Pd loading on the working electrode, 0.42 mC cm−2 is the assuming electrical charge associated with the monolayer adsorption of hydrogen on Pd. Linear sweep voltammetry (LSV) and chronoamperometry (CA) measurements were carried out in a 0.5 M H2SO4 + 0.5 M HCOOH solution. All electrochemical experiments were performed at room temperature.
3. Results and discussion
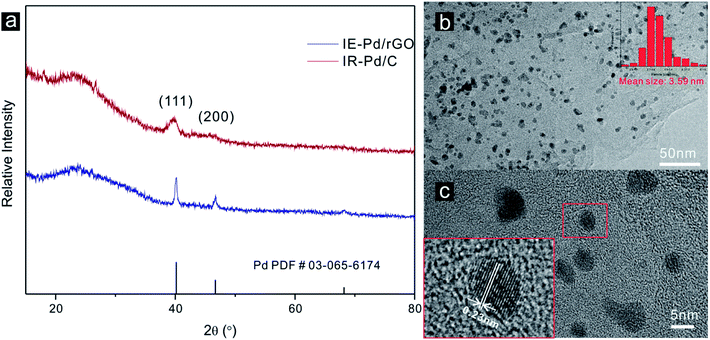
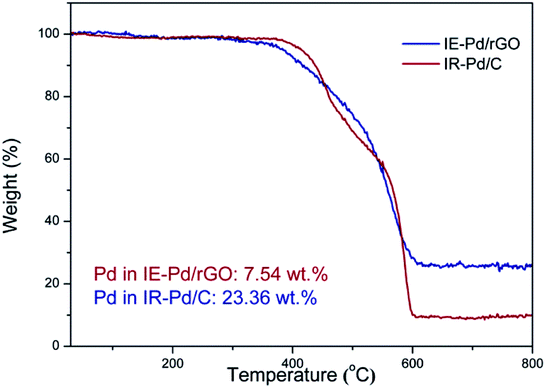
Characteristic peaks of (111) and (200) of Pd metal can be detected from the XRD spectrum of the IE-Pd/rGO catalyst as displayed in Fig. 2a, agree well with the PDF card: 03-065-6174. Much boarder (111) peak in the XRD spectrum of the IE-Pd/rGO catalyst than that of the IR-Pd/C catalyst, which was synthesized from a traditional impregnation reduction method, indicates the smaller size of the IE-Pd/rGO catalyst. The board peak around the 2θ = 22° is attributed to the X-ray diffraction on the rGO sheets. TEM image on the IE-Pd/rGO catalyst (Fig. 2b) confirms that the Pd nanoparticles are uniformly dispersed on rGO surface with average size of ca. 3.59 nm, agreeing well with that calculated from the (111) peak of the XRD spectrum. It can be also revealed from the TEM images that the Pd nanoparticles are uniformly anchored on the rGO surface with large distance between each two nanoparticles, which is attributed to the diluted distribution of acid groups on the GO sheets. At the same time, the crystal domains within the Pd nanoparticles have an interfringe distance of 0.23 nm (Fig. 2c), close to the lattice spacing of the (111) planes of the face-centered cubic (fcc) Pd crystal, indicating a stable catalytically activity of the IE-Pd/rGO catalyst.50To evaluate the Pd loading in the IE-Pd/rGO catalyst, TG analysis was carried out on the IE-Pd/rGO catalyst in O2 condition. According to the TG curves as shown in Fig. 3, Pd loading of the IR-Pd/C catalyst was calculated to be 23.36 wt%, agreeing well with the Pd![[thin space (1/6-em)]](https://www.rsc.org/images/entities/char_2009.gif) :
:![[thin space (1/6-em)]](https://www.rsc.org/images/entities/char_2009.gif) C ratio in the precursors. In contrast, Pd loading of the IE-Pd/rGO catalyst is low to 7.54 wt%, only 1/3 of that of the Pd/C catalyst. This value is slightly higher than desired (ca. 5 wt%) due to the loss of small pieces of GO/rGO sheets during the catalyst fabrication.
C ratio in the precursors. In contrast, Pd loading of the IE-Pd/rGO catalyst is low to 7.54 wt%, only 1/3 of that of the Pd/C catalyst. This value is slightly higher than desired (ca. 5 wt%) due to the loss of small pieces of GO/rGO sheets during the catalyst fabrication.
0.5 M H2SO4 solution was subsequently used as electrolyte for CV measurements of both the IE-Pd/rGO catalyst and the IR-Pd/C catalyst to evaluate the electrochemical activity area of the catalysts. Although Pd loading of the IE-Pd/rGO catalyst is much lower compared with the IR-Pd/C catalyst, ECSA of the IE-Pd/rGO catalyst (89.8 m2 g−1) is almost three times higher than that of the IR-Pd/C catalyst according to the CV curves displayed in Fig. 4a. Moreover, capacitance of the IE-Pd/rGO catalyst was significantly enlarged compared to that of the original rGO, on where no proton adsorption/desorption peak can be detected, due to that the multilayered rGO nanosheets were further stripped and were broken to small pieces. As demonstrated in Fig. 4b, size of the rGO nanosheets were significantly reduced after the IE-reduction synthesis. The size reduction on rGO layer would result in higher active surface area for electrochemical reaction. The enlarged surface area also ensures that the nanoparticles are far away from each other and won't aggregate during the fuel cell operation.
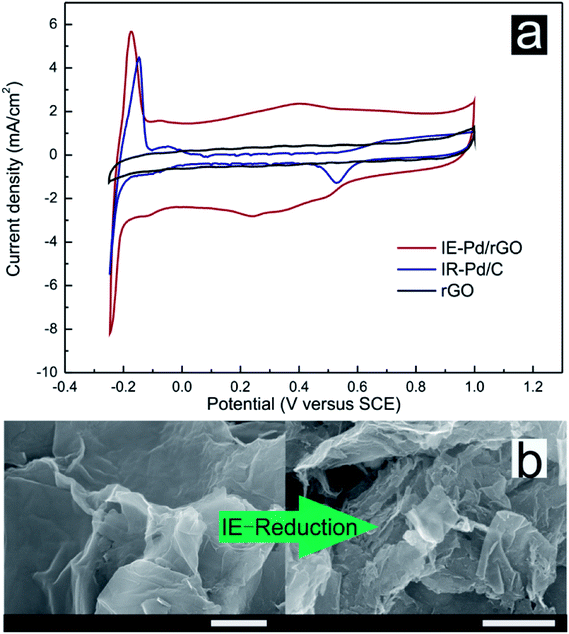 | ||
| Fig. 4 (a) CV curves of the IE-Pd/rGO catalyst, the IR-Pd/C catalyst and rGO in 0.5 M H2SO4 solution. (b) SEM images of original rGO and the IE-Pd/rGO catalyst (scale bar: 1 μm). | ||
Electrochemical FAOR catalytic activity of the IE-Pd/rGO catalyst was further investigated with the linear sweep voltammetry (LSV) curve compared with that of the IR-Pd/C catalyst and the commercial 20% Pd/C (C–Pd/C, Alfa Aesar) catalyst in Fig. 5a. The IE-Pd/rGO catalyst exhibited much high current density during the entire potential sweep from −0.2 V to 1.0 V. Peak FAOR current density on the IE-Pd/rGO catalyst is high than 800 mA mgPd−1, which is ca. 4 times higher than that of the IR-Pd/C catalyst as well as that of the C–Pd/C catalyst. This mass activity is among the best reported Pd based FAOR catalysts at the identical condition.20,37,51,52 Despite the ultra-low Pd loading in the IE-Pd/rGO catalyst, Pd(0)![[thin space (1/6-em)]](https://www.rsc.org/images/entities/char_2009.gif) :
:![[thin space (1/6-em)]](https://www.rsc.org/images/entities/char_2009.gif) Pd(II) ratio in the IE-Pd/rGO catalyst is higher than that of the IR-Pd/C catalyst as demonstrated in the XPS spectra in Fig. 5b. Other than the enhanced FAOR activity, FAOR potential of the IE-Pd/rGO catalyst is also negatively shifted by 40 mV compared with the IR-Pd/C catalyst due to the assistant of doped N atoms on rGO surface, which can be confirmed by XPS spectrum of N 1s on the IE-Pd/rGO catalyst in Fig. 5c, resulted from the N-containing functional groups, e.g. –NO2, on GO surface.53–57 Specifically, specific activity of the IE-Pd/rGO catalyst is calculated to be 0.9 mA cmPd−2 by considering the mass activity and ECSA, which similar to that of the reported Pd/C catalysts18 and the IR-Pd/C catalyst, indicating that FAOR process on IE-Pd/rGO catalyst was not altered.
Pd(II) ratio in the IE-Pd/rGO catalyst is higher than that of the IR-Pd/C catalyst as demonstrated in the XPS spectra in Fig. 5b. Other than the enhanced FAOR activity, FAOR potential of the IE-Pd/rGO catalyst is also negatively shifted by 40 mV compared with the IR-Pd/C catalyst due to the assistant of doped N atoms on rGO surface, which can be confirmed by XPS spectrum of N 1s on the IE-Pd/rGO catalyst in Fig. 5c, resulted from the N-containing functional groups, e.g. –NO2, on GO surface.53–57 Specifically, specific activity of the IE-Pd/rGO catalyst is calculated to be 0.9 mA cmPd−2 by considering the mass activity and ECSA, which similar to that of the reported Pd/C catalysts18 and the IR-Pd/C catalyst, indicating that FAOR process on IE-Pd/rGO catalyst was not altered.
Due to the synergistic effect of Pd uniformly dispersion and N atomic doping, stability of FAOR on the IE-Pd/rGO catalyst was significantly improved. The IR-Pd/C catalyst exhibited an extremely poor stability as shown in the CA curve in Fig. 6. FAOR current density was quickly deceased to ca. 0 within 100 seconds. As a comparison, FAOR current density of the IE-Pd/rGO catalyst was slowly decreased during the entire 3600 s CA measurement. According to the magnified curves shown in the inset of Fig. 6, FA oxidation current density on the IE-Pd/rGO catalyst can be stabilized at ca. 30 mA mgPd−1 after the 3600 s CA measurement.
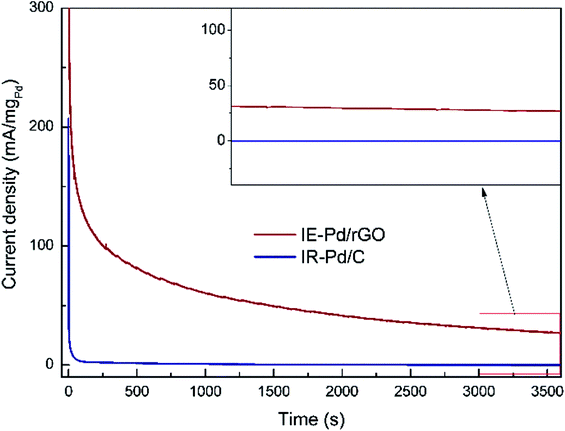 | ||
| Fig. 6 Chronoamperometry (CA) curves of the IE-Pd/rGO catalyst and the IR-Pd/C catalyst. (inset: magnified CA curves from 3000 to 3600 s). | ||
4. Conclusions
In summary, an ionic exchange strategy was developed for immobilization of Pd nano-particles on rGO support to achieve ultra-low Pd loading for efficient catalysis of formic acid electro-oxidation. Pd2+ ions were exchanged with the protons in the acid functional groups on GO surface and highly dispersed Pd nano-particles were firmly loaded rGO after mild reduction. Three times higher FA electro-oxidation mass activity was therefore obtained compared with the conventional impregnation method synthesized Pd/C catalyst. More importantly, FA oxidation stability on this IE-Pd/rGO catalyst was also strongly improved due to the strong immobilization of Pd nano-particle and the effect of in situ doped N from the N-containing functional groups on GO.Author contributions
Jiuxiao Sun and Xingying Luo contribute equally to this work. The manuscript was written through contributions of all authors. All authors have given approval to the final version of the manuscript.Conflicts of interest
There are no conflicts to declare.Acknowledgements
This work is supported by the National Natural Science Foundation of China (No. 21703211, 21503197, and 21703212) and Fundamental Research Funds for the Central University, China University of Geosciences (Wuhan) (No. CUG150615 and CUG150627).References
- S. Zhang, Y. Shao, H.-g. Liao, J. Liu, I. A. Aksay, G. Yin and Y. Lin, Chem. Mater., 2011, 23, 1079–1081 CrossRef.
- Y. She, Z. Lu, W. Fan, S. Jewell and M. K. H. Leung, J. Mater. Chem. A, 2014, 2, 3894 Search PubMed.
- J. Chang, L. Feng, C. Liu, W. Xing and X. Hu, Angew. Chem., Int. Ed., 2014, 53, 122–126 CrossRef PubMed.
- D. Bin, B. Yang, F. Ren, K. Zhang, P. Yang and Y. Du, J. Mater. Chem. A, 2015, 3, 14001–14006 Search PubMed.
- W. Cai, L. Liang, Y. Zhang, W. Xing and C. Liu, Int. J. Hydrogen Energy, 2013, 38, 212–218 CrossRef.
- W. Cai, L. Yan, C. Li, L. Liang, W. Xing and C. Liu, Int. J. Hydrogen Energy, 2012, 37, 3425–3432 CrossRef.
- X. Yan, X. Hu, G. Fu, L. Xu, J.-M. Lee and Y. Tang, Small, 2018, 14 Search PubMed.
- H. Xu, P. Song, B. Yan, J. Wang, C. Wang, Y. Shiraishi, P. Yang and Y. Du, ChemSusChem, 2018, 11, 1056–1062 CrossRef PubMed.
- M. E. Scofield, C. Koenigsmann, L. Wang, H. Liu and S. S. Wong, Energy Environ. Sci., 2015, 8, 350–363 Search PubMed.
- G.-T. Fu, B.-Y. Xia, R.-G. Ma, Y. Chen, Y.-W. Tang and J.-M. Lee, Nano Energy, 2015, 12, 824–832 CrossRef.
- X. Wang, F. Zhu, Y. He, M. Wang, Z. Zhang, Z. Ma and R. Li, J. Colloid Interface Sci., 2016, 468, 200–210 CrossRef PubMed.
- F. Zhu, M. Wang, Y. He, G. Ma, Z. Zhang and X. Wang, Electrochim. Acta, 2014, 148, 291–301 CrossRef.
- F. Zhu, G. Ma, Z. Bai, R. Hang, B. Tang, Z. Zhang and X. Wang, J. Power Sources, 2013, 242, 610–620 CrossRef.
- X. Yu and P. G. Pickup, J. Power Sources, 2008, 182, 124–132 CrossRef.
- E. Antolini, Energy Environ. Sci., 2009, 2, 915 Search PubMed.
- C. Rice, S. Ha, R. I. Masel and A. Wieckowski, J. Power Sources, 2003, 115, 229–235 CrossRef.
- X. Chen, G. Wu, J. Chen, X. Chen, Z. Xie and X. Wang, J. Am. Chem. Soc., 2011, 133, 3693–3695 CrossRef PubMed.
- V. Mazumder and S. Sun, J. Am. Chem. Soc., 2009, 131, 4588–4589 CrossRef PubMed.
- X. Huang, S. Tang, X. Mu, Y. Dai, G. Chen, Z. Zhou, F. Ruan, Z. Yang and N. Zheng, Nat. Nanotechnol., 2011, 6, 28–32 CrossRef PubMed.
- F. Wang, H. Xue, Z. Tian, W. Xing and L. Feng, J. Power Sources, 2018, 375, 37–42 CrossRef.
- L. Feng, J. Chang, K. Jiang, H. Xue, C. Liu, W.-B. Cai, W. Xing and J. Zhang, Nano Energy, 2016, 30, 355–361 CrossRef.
- D. Chen, P. Sun, H. Liu and J. Yang, J. Mater. Chem. A, 2017, 5, 4421–4429 Search PubMed.
- J. Y. Wang, H. X. Zhang, K. Jiang and W. B. Cai, J. Am. Chem. Soc., 2011, 133, 14876–14879 CrossRef PubMed.
- K. Jiang, H.-X. Zhang, S. Zou and W.-B. Cai, PCCP, 2014, 16, 20360–20376 RSC.
- J. Wang, Y. Chen, H. Liu, R. Li and X. Sun, Electrochem. Commun., 2010, 12, 219–222 CrossRef.
- M. Chen, Z. B. Wang, K. Zhou and Y. Y. Chu, Fuel Cells, 2010, 10, 1171–1175 CrossRef.
- Y. L. Qin, Y. C. Liu, F. Liang and L. M. Wang, ChemSusChem, 2015, 8, 260–263 CrossRef PubMed.
- N. A. M. Barakat, M. A. Abdelkareem, G. Shin and H. Y. Kim, Int. J. Hydrogen Energy, 2013, 38, 7438–7447 CrossRef.
- L. Wang, J.-J. Zhai, K. Jiang, J.-Q. Wang and W.-B. Cai, Int. J. Hydrogen Energy, 2015, 40, 1726–1734 CrossRef.
- J. Cai, Y. Zeng and Y. Guo, J. Power Sources, 2014, 270, 257–261 CrossRef.
- W. P. Zhou, R. Larsen, R. I. Masel, P. S. Bagus and A. Wieckowski, J. Phys. Chem. B, 2006, 110, 13393–13398 CrossRef PubMed.
- B. E. Conway, H. Angerstein-Kozlowska and G. Czartoryska, Z. Phys. Chem., 1978, 112, 195–214 CrossRef.
- A. Cuesta, G. Cabello, M. Osawa and C. Gutiérrez, ACS Catal., 2012, 2, 728–738 CrossRef.
- W. Zhou and J. Y. Lee, J. Phys. Chem. C, 2008, 112, 3789–3793 Search PubMed.
- X.-M. Wang and Y.-Y. Xia, Electrochim. Acta, 2009, 54, 7525–7530 CrossRef.
- S. Patra, B. Viswanath, K. Barai, N. Ravishankar and N. Munichandraiah, ACS Appl. Mater. Interfaces, 2010, 2, 2965–2969 Search PubMed.
- H. Ali, S. Zaman, I. Majeed, F. K. Kanodarwala, M. A. Nadeem, J. A. Stride and M. A. Nadeem, ChemElectroChem, 2017, 4, 3126–3133 CrossRef.
- Y. Zhou, X.-C. Hu, Q. Fan and H.-R. Wen, J. Mater. Chem. A, 2016, 4, 4587–4591 Search PubMed.
- L. Y. Zhang, Z. L. Zhao and C. M. Li, Nano Energy, 2015, 11, 71–77 CrossRef.
- M. Wang, Z. Ma, R. Li, B. Tang, X.-Q. Bao, Z. Zhang and X. Wang, Electrochim. Acta, 2017, 227, 330–344 CrossRef.
- P. M. Ajayan and B. I. Yakobson, Nature, 2006, 441, 818–819 CrossRef PubMed.
- X. Chen, G. Wu, J. Chen, X. Chen, Z. Xie and X. Wang, J. Am. Chem. Soc., 2011, 133, 3693–3695 CrossRef PubMed.
- G. M. Scheuermann, L. Rumi, P Steurer, W. Bannwarth and R. Mülhaupt, J. Am. Chem. Soc., 2009, 131, 8262–8270 CrossRef PubMed.
- H. Huang and X. Wang, J. Mater. Chem., 2012, 22, 22533 RSC.
- A. Serov, N. I. Andersen, S. A. Kabir, A. Roy, T. Asset, M. Chatenet, F. Maillard and P. Atanassov, J. Electrochem. Soc., 2015, 162, F1305–F1309 CrossRef.
- D. C. Marcano, D. V. Kosynkin and J. M. Berlin, et al., ACS Nano, 2010, 4, 4806 CrossRef PubMed.
- X. Huang, Z. Zeng, S. Bao, M. Wang, X. Qi, Z. Fan and H. Zhang, Mol. Ther., 2013, 4, 1444 Search PubMed.
- B. Van Vaerenbergh, K. De Vlieger, K. Claeys, G. Vanhoutte, J. De Clercq, P. Vermeir and A. Verberckmoes, Appl. Catal., A, 2018, 550, 236–244 CrossRef.
- H. Zhao, J. Yang, L. Wang, C. Tian, B. Jiang and H. Fu, Chem. Commun., 2011, 47, 2014–2016 RSC.
- V. Mazumder and S. Sun, J. Am. Chem. Soc., 2009, 131, 4588–4589 CrossRef PubMed.
- X.-F. Zhang, Y. Chen, L. Zhang, A.-J. Wang, L.-J. Wu, Z.-G. Wang and J.-J. Feng, J. Colloid Interface Sci., 2018, 516, 325–331 CrossRef PubMed.
- W.-L. Qu, Z.-B. Wang, Y. Gao, C. Deng, R.-H. Wang, L. Zhao and X.-L. Sui, Int. J. Hydrogen Energy, 2018, 43, 407–416 CrossRef.
- Q. Liu, J. Fan, Y. Min, T. Wu, Y. Lin and Q. Xu, J. Mater. Chem. A, 2016, 4, 4929–4933 Search PubMed.
- W. Zhang, Q. Yao, X. Wu, Y. Fu, K. Deng and X. Wang, Electrochim. Acta, 2016, 200, 131–141 CrossRef.
- H. Xu, B. Yan, S. Li, J. Wang, C. Wang, J. Guo and Y. Du, ACS Sustainable Chem. Eng., 2018, 6, 609–617 CrossRef.
- H. Xu, B. Yan, S. Li, J. Wang, C. Wang, J. Guo and Y. Du, Chem. Eng. J., 2018, 334, 2638–2646 CrossRef.
- X. Zhang, J. Zhu, C. S. Tiwary, Z. Ma, H. Huang, J. Zhang, Z. Lu, W. Huang and Y. Wu, ACS Appl. Mater. Interfaces, 2016, 8, 10858–10865 Search PubMed.
Footnote |
| † These authors contribute equally to this work. |
| This journal is © The Royal Society of Chemistry 2018 |

