 Open Access Article
In situ synthesis of metal embedded nitrogen doped carbon nanotubes as an electrocatalyst for the oxygen reduction reaction with high activity and stability†
Yanhong Yin abc,
Hengbo Zhangabc,
Rongzhen Gaoabc,
Aili Wangabc,
Xinxin Maoabc,
Hongyu Dongabc and
Shuting Yang
 *abc
*abc
aSchool of Chemistry and Chemical Engineering, Henan Normal University, Xinxiang, Henan 453007, P. R. China
bNational & Local Joint Engineering Laboratory for Motive Power and Key Materials Xinxiang, Henan 453007, China
cCollaborative Innovation Center of Henan Province for Motive Power and Key Materials, Xinxiang, Henan 453007, China
First published on 12th July 2018
Abstract
In this work, a Co–N doped carbon nanotube (CNT) catalyst was fabricated via a simple pyrolysis approach and the effects of solvothermal processing on the catalytic activity of the as-prepared material were investigated in detail. The results show that after solvothermal processing (Co-NC) the catalyst has a more homogeneous anemone structure, a higher nitrogen content, a larger BET surface area and a higher degree of graphitization compared to the catalyst produced after non-solvothermal processing (Co-MA). The results of electrochemical tests indicate that Co-NC, compared to commercial 20% Pt/C and Co-MA, has an improved mass transfer process and sufficient active site exposure, which brings about superb oxygen reduction electrocatalytic activity, a higher reduction potential (−0.2 V vs. Ag/AgCl), a limiting diffusion current (5.44 mA cm−2) and excellent stability in 0.1 M KOH solution.
Introduction
Fuel cells have been paid much attention as promising clean operating devices in portable, stationary and automotive power systems.1,2 Unfortunately, the oxygen reduction reaction (ORR) limits the efficiency of fuel cells greatly.3 At present, platinum based catalysts have been adopted most commonly but their high cost, scarcity and susceptibility to poisoning greatly hampers their widespread use.1 More recently, earth-abundant (non-platinum) catalysts, such as transition metal nitrides,4 transition metal carbides,5 transition metal macrocycles,6 transition metal chalcogenides,7 carbon-supported nonprecious transition metals8 and metal-free materials,9 have been researched widely. Among these, transition metal nanoparticles embedded in carbon nanotubes (M/CNTs) have become the most promising materials because of their wide variety of sources and durability in alkaline medium.10–12 Furthermore, Chen et al. proved using DFT (Density Functional Theory) calculations that through metal–polyaniline molecules Co–N and Fe–N could catalyze the ORR and Guo et al. confirmed that heteroatoms can enhance M/N/C catalytic activity.13,14A common method to fabricate M/CNTs is to prepare CNTs firstly via arc-discharge evaporation15 or a chemical vapor deposition (CVD) method under a catalyst such as Fe, Co or Ni. To obtain pure CNTs, the products have to undergo an acid washing process to get rid of the redundant catalyst. Then, a solution reduction process is used to load metal nanoparticles on the as-prepared CNTs. However, CNTs with Fe or Co nanoparticles have proved to be an excellent catalyst for the ORR process. So it is efficient to prepare an excellent M/CNT catalyst in one step.
Research has shown that dopants and defects can alter the properties of carbon. In particular, nitrogen doped carbon can greatly modulate carbon’s surface properties, and increase the active sites and electrical conductivity of the pristine material, thus significantly enhancing its electrochemical performance.16,17 Chen et al.18 synthesized a series of Co/N/C catalysts via pyrolysis of a mixture of cobalt acetate and a prepolymer of melamine formaldehyde resin. Similarly, Fe/N/C hollow nanospheres were obtained via an Fe(III)-dopamine-complexation-assisted one-pot method.19 Furthermore, embedded cobalt nanocrystals in the graphene catalysts prepared by a single-step approach showed that their electro-catalytic properties outperform those of Pt/C.20
The research in highly cost effective transition metal nitrogen doped-carbon ORR catalysts depends heavily on catalyst design and synthesis innovation. Commonly, a pyrolysis strategy is used to prepare the catalysts, during which a mixture containing a nitrogen precursor, carbon precursor and transition metal undergoes heat processing to obtain the desired product.19,21 In previous work, much emphasis has been given to metal species, N and C resources, templates, supports and pyrolysis conditions, but little attention has been paid to precursor processing. As is well known, the structure and morphology of the precursor will affect greatly the final performance of the catalyst. Therefore, this study makes a major contribution to research on the effect of different precursor processing strategies by comparing the physical structure and electrochemical properties.
Here, using melamine, glyoxal and cobalt nitrate hexahydrate as raw materials, Co–N doped carbon nanotube (CNT) catalysts are synthesized via a simple in situ pyrolysis method. Melamine is the ideal source for N and C, and its three symmetrical amino-groups can react with glyoxal or complex with cobalt under solvothermal conditions, which is a benefit for the uniform distribution of the cobalt element. Emphasis is given in the study as to whether and how solvothermal processing affected the catalytic performance of the Co-NC material.
Results and discussion
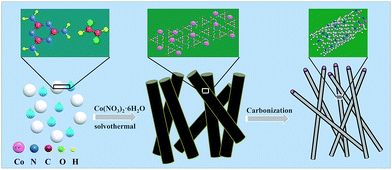
The schematic diagram for synthesizing Co-NC is shown in Fig. 1. Glyoxal, melamine and cobalt-nitrate hexahydrate were first mixed uniformly. During the solvothermal reaction, amide groups formed between melamine and glyoxal, and resulted in the formation of spherical shell or flake structures. At the same time, cobalt-nitrate hexahydrate can complex with –NH2 from melamine. Due to the coordination of cobalt ions, the spherical shells or flakes curl into a tubular structure. This can be proved using the images shown in Fig. S1 and S2.† The morphology of the Co-free precursor (named Co-freeP) displays a micro-sphere or flake structure (Fig. S1a†) while that of the Co-NC precursor (named Co-NCP) shows a tubular structure (Fig. S1b†). After the pyrolyzing process, they transform into cystoid and anemone structures, respectively (Fig. S2†). From the FT-IR results (Fig. S3†), one can observe a band at 3215–3353 cm−1 from Co-freeP and Co-NCP which indicates the stretching vibration of HN–C–NH.22 The two small peaks with a tag in Fig. S3† correspond to the asymmetric stretching vibration of the HN–C–NH bond, which proves that melamine and glyoxal might participate in the chemical reaction and the formation of amide groups.22 For Co-NCP, a stretching vibration of the Co–Nx bonds (2412 cm−1) can be observed, inferring that complexation between melamine and cobalt-nitrate has occured.23The morphologies of Co-NC and Co-MA are shown in Fig. 2. It was found that Co-NC grows as relatively uniform carbon nanotubes of several micrometers long and 50–150 nm thick (Fig. 2a) while non-uniform nanotubes and nano-particles are observed for Co-MA (Fig. 2b). It is possible that the solvothermal process benefits the uniform distribution of Co, and as a result, the carbon nanotubes formed will be more uniform.24 The microstructure of Co-NC is further studied by TEM and HR-TEM analysis. Fig. 2c clearly shows images of in situ grown CNTs and the presence of another constituent in the head of the CNTs. The HR-TEM image of the end of the carbon nanotube is shown in Fig. 2d. Lattice fringes of the inner core are consistent with crystalline Co with an interspacing of 0.204 nm. The lattice spacing of the outer shell is 0.35 nm, which is in accordance with that of graphitic carbon.25 This result reveals that the crystalline Co nanoparticles were embedded in highly graphitic carbon which was composed of a few graphite layers.
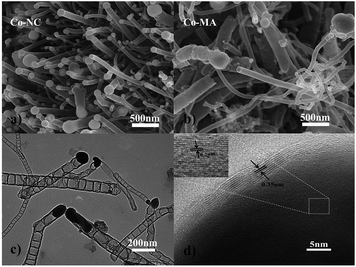 | ||
| Fig. 2 SEM images of cobalt embedded in a nitrogen-doped nanotube catalyst: (a) Co-NC and (b) Co-MA. A TEM image (c) and HR-TEM image (d) of Co-NC. | ||
The existence of graphitic carbon and cobalt element in the as-prepared Co-NC and Co-MA samples can also be verified by XRD analysis as shown in Fig. 3a. Both of them exhibit three distinct peaks at 51.5°, 44.2° and 75.8° which demonstrates a crystal face homologous to that of metallic Co (111), (200) and (220), respectively. This result indicates that Co2+ in the precursor has been reduced to metallic Co by the reducing gases produced in the pyrolysis step. The peaks at 26.3° in the inset confirm the existence of graphitic carbon.
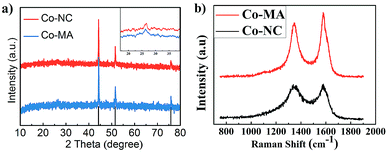 | ||
| Fig. 3 (a) XRD patterns of Co-MA and Co-NC; the inset shows the carbon characteristic peak. (b) The Raman spectra of Co-MA and Co-NC. | ||
Fig. 3b shows the Raman spectra of Co-NC and Co-MA, which display the characteristic Raman shifts of CNTs. The intensity of the D peak at 1351 cm−1 is correlated to the disordered state of carbon. The intensity of the G peak (1588 cm−1) is correlated to the degree of graphitization of carbon.26 ID/IG is often applied to measure the degree of graphitization. For Co-NC and Co-MA, the ID/IG values fitted using Origin are 1.32 and 1.96, respectively. This indicates that the Co-NC catalyst has a relatively higher graphitization degree compared with that of Co-MA. As is well known, Co2+ can catalyze the graphitization of carbon.27 The uniform distribution of Co helps enhance graphitization,18 which helps increase the stability of electrocatalysts.
A survey of the chemical construction of Co-NC and Co-MA was carried out by XPS analysis (Fig. 4 and S4†). Co, N and C characteristic peaks are all observed, as indicated in the XPS survey spectrum in Fig. 4a. Fig. 4b shows the C spectrum. Two major narrow peaks at 284.0 eV and 284.85 eV can be observed, which belong to C–C and C–OH, respectively. According to the previous conclusion, the presence of C–OH groups could ensure that the carbon nanotubes are hydrophilic.28 It is well known that hydrophilicity could improve the migration rate of reactants. This ensures that the dissolved oxygen is more accessible to the catalyst.
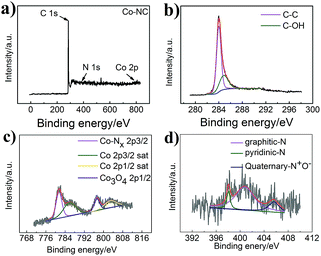 | ||
| Fig. 4 (a) XPS spectrum of Co-NC, (b) the deconvoluted C1s spectrum of Co-NC, (c) the deconvoluted Co2p spectrum of Co-NC, and (d) the deconvoluted N1s spectrum of Co-NC. | ||
As shown in Fig. 4c, the Co 2p spectrum displays five major narrow peaks at 781.5 eV, 785.9 eV, 797.3 eV and 802.9 eV. The intense peaks at 785.9 eV and 802.9 eV are assigned as satellite peaks that could be attributed to high-spin Co2+ ions. The intense peak at 781.5 eV is consistent with Co–Nx,29 while that at around 797.3 eV is ascribed to the Co3O4 phase.30 Co0 peaks cannot be found, which may be because of cobalt oxide on the surface. In addition, as expected, the C spectrum and Co 2p spectrum of Co-MA (Fig. 4Sc†) show the same features as those of Co-NC.
Fig. 4d shows the high-resolution N 1s spectrum of Co-NC. As is well known, the oxygen reduction catalytic ability is related to the amount and species of nitrogen.31 The existence of N indicates that N has been incorporated into the carbon matrix. Herein, we show the different types of N-doping for Co-NC (5.48%) and Co-MA (3.36%). For Co-NC, there are four peaks at 404.6 eV, 401.2 eV, 399.1 eV and 398.7 eV, which are in accordance with quaternary-N+O−, graphitic-N, Co–Nx and pyridinic-N. Meanwhile, for Co-MA (Fig. S4d†), there are only three peaks at 405.64 eV, 400.75 eV and 398.05 eV which correspond to quaternary-N+O−, graphitic-N and pyridinic-N. The atom ratios of the different types of N are shown in Table 1(ESI†). According to the literature,32 the high pyridine-N content of Co-NC is helpful for the enhancement of ORR catalytic activity.33
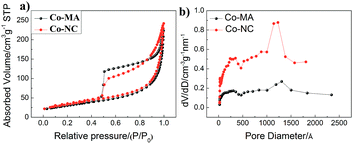
The results of the analysis of pore structure and specific surface area (SBET) are shown in Fig. 5 and the detailed data of these materials are displayed in Table 2 (ESI†). Both of them demonstrate type IV isotherms, and the hysteresis loops can be observed at 0.5–1.0 P/P0, which indicates the porous structure of the materials. Here, the pore size and the calculated results about pore distribution obtained via the Barrett–Joyner–Halenda (BJH) method are shown in Fig. 5b. One can find that both of the samples mainly have two kinds of pore size distribution: one is 1–10 nm (mesopores) and the other is 100–150 nm (macropores). From Table 2(ESI†), the BET surface area of Co-NC and Co-MA is almost the same, but the former has a relatively larger pore size and pore volume than those of the latter, which can facilitate reactant transportation inside the material.
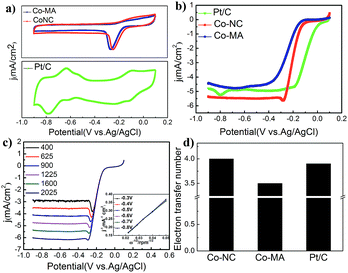
Fig. 6a shows the CV curves of commercial 20 wt% Pt/C (JM) and the above-mentioned materials that were obtained despite the capacitive background current. The potentials mentioned here are all measured vs. a Ag/AgCl reference electrode. A standard ORR peak of Co-NC appeared at ca. −0.21 V in the O2 saturated electrolyte, which is inferior to that of Pt/C (0.095 V) but higher than that of Co-MA (−0.25 V). The results show that Co-NC is more effective for the ORR process.
Fig. 6b shows the results of the LSV experiments of the three samples. Onset potentials are acquired from a rotating disk electrode under a linear sweep of 1600 rpm. From Fig. 6b, one can find that the onset potential of Co-NC is −0.132 V, which is slightly higher compared to that of Co-MA (−0.168 V). On the other hand, Co-NC appears to have a much higher limiting current density than that of the Pt/C and Co-MA catalysts. Linear sweep voltammetry (LSV) curves of Co-NC from 400 to 2025 rpm and the K–L curves with a closely paralleled dependency are shown in Fig. 6c and the inset. To investigate the reaction process of the catalyst surface, the transferred electron number (n) was calculated using eqn (1) and (2) and the results are shown in Fig. 6d. The transferred electron number of the Co-NC electrode is approximately 4.0, which is higher than that of Co-MA (3.5), suggesting that the catalytic process on the Co-NC surface progressed via a four-electron approach in which O2 was reduced to H2O directly. This four-electron catalytic approach can increase reaction speed compared to the two-electron two-step approach. The results about M/NC catalysts in the literature are summarized in Table 3 (ESI†). Compared with other M/NC catalysts, the Co-NC catalyst in this work shows the highest limiting diffusion current (Jlimit) and transferred electron number (n).
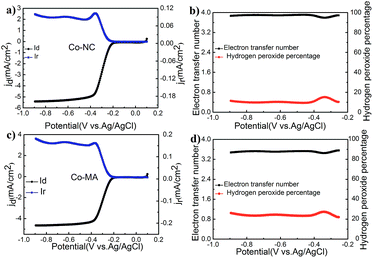
RRDE technology is an effective tool to study this oxygen reduction process. Fig. 7 shows the results of an RRDE test. The transferred electron numbers (n) of Co-NC and Co-MA under different potentials were determined using eqn (3) and the main values were close to those obtained from using the RDE technique. One can also find that the Co-NC electrode has a relatively lower HO2−% content, inferring that the catalytic reaction is a four electron process. The excellent catalytic activity of Co-NC may be due to the relatively higher N content and the Co–Nx structure.34
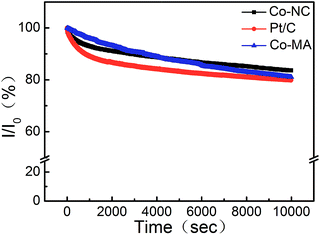
The durability of Co-NC and Co-MA was investigated by measuring the chronoamperometric (CA) response in comparison to that of Pt/C at −0.2 V in KOH solution (0.1 M, O2−saturated). After 10![[thin space (1/6-em)]](https://www.rsc.org/images/entities/char_2009.gif) 000 s, the effective current densities on Co-NC, Co-MA and Pt/C decreased by 16.4%, 18.9% and 20.2%, respectively. This indicates that the ORR active site washed away in alkaline medium. The small current density loss of Co-NC may be due to the enhanced degree of graphitization of Co-NC,35 which is a benefit from the uniform distribution of Co after the solvothermal process (Fig. 8).
000 s, the effective current densities on Co-NC, Co-MA and Pt/C decreased by 16.4%, 18.9% and 20.2%, respectively. This indicates that the ORR active site washed away in alkaline medium. The small current density loss of Co-NC may be due to the enhanced degree of graphitization of Co-NC,35 which is a benefit from the uniform distribution of Co after the solvothermal process (Fig. 8).
Conclusions
In summary, Co–N doped carbon nanotube (CNT) catalysts have been synthesized via a simple in situ pyrolysis method and the effect of solvothermal processing on the catalyst precursors has been examined. Results confirm that the catalysts fabricated by solvothermal processes, compared to that by non-solvothermal processes, have more homogeneous morphology, larger pore size and pore volume, higher pyridine-N content (48.1%) and a Co–Nx structure, which leads to excellent stability and catalytic activity in alkaline medium. This work mainly focus on the effects of different precursor processes, and these discoveries will help us to optimize synthesis methods for M/N/C catalysts.Experimental
Materials
Melamine and glyoxal solution (40%) were obtained from Sinopharm Chemical Reagent Co., Ltd. Cobalt nitrate hexahydrate was purchased from Shanghai Macklin Biochemical Co., Ltd. First, 5 g melamine and 3.5 g cobalt nitrate hexahydrate were added into 20 ml alcohol with magnetic stirring. After ultrasonic dispersion for 15 min, NaOH solution was used to alter the pH values. 2.5 ml glyoxal solution was dropped in the suspension under continuous magnetic stirring. This suspension was transferred into a high pressure reactor, and ethanol was added to make it 80% full. After heating the reactor at 180 °C for 4 h, the product was air-dried at room temperature, and then heated to 900 °C for 2 h in N2 in a tube furnace. The final product was named Co-NC. To explore the formative process of Co-NC, the metal-free catalyst was synthesized using the same method as Co-NC but cobalt nitrate was not added, and it was named Co-free.In contrast, another sample was prepared under the same conditions as Co-NC except for the fact that the precursors didn’t undergo the solvothermal process. This as-prepared sample was denoted Co-MA.
Characterization
The physical structure of the above-mentioned samples was studied using a field emission scanning electron microscope (FESEM, JSM-6700F) and a transmission electron microscope (TEM, JEM 2100), with an accelerating voltage of 15 kV and 200 kV respectively. The structure and constituents of the samples were represented by carrying out X-ray diffraction (XRD) on a D8 Advance (Bruker) diffractometer with Cu Kα radiation. X-ray photoelectron spectroscopy (XPS) was carried on an AXIS Ultra DLD system. The specific surface areas were assessed using a Micromeritics Tristar 3020 gas adsorption analyzer. Raman spectra of the powder samples were collected using a Lab-RAM HR800 instrument. Fourier transform infrared spectra (FT-IR) were measured using a NEXUS spectrophotometer.Electrochemical measurements
All of the tests were performed on a CHI 660B electrochemical workstation and a standard three-electrode system in 0.1 M KOH solution was adopted. A glassy carbon electrode (GCE) was regarded as the working electrode, and we opted to use a Ag/AgCl electrode and platinum wire as the reference and counter electrode. For the modification of the working electrode, 5 mg of catalyst and acetylene black respectively, 95 μL 5 wt% Nafion solution and 350 μL ethanol were mixed and dispersed homogeneously using an ultrasonic technique. Then this mixture was dropped onto the GCE and dried. The catalyst loading was 0.03 mg cm−2. Prior to each measurement, the modified electrode was activated in the same chemical environment. The scan rate for RDE polarization curves was 0.01 V s−1 or 0.05 V s−1. Koutechy–Levich (K–L) curves were drawn using the following formulas:| 1/j = 1/jk + 1/Bω1/2 | (1) |
| B = 0.2nFC0D2/30ν−1/6 | (2) |
![[thin space (1/6-em)]](https://www.rsc.org/images/entities/char_2009.gif) 485C mol−1), ν is the kinematic viscosity of the electrolyte and n is the electron transfer number which was calculated via the following equation:
485C mol−1), ν is the kinematic viscosity of the electrolyte and n is the electron transfer number which was calculated via the following equation:| n = abs(ID)/(abs(ID) × 4 + (IR/N)) | (3) |
The % HO2− was calculated based on eqn (4):
| % HO2− = 100 × (2IR/N)/(abs(ID) + (IR/N)) | (4) |
Conflicts of interest
There are no conflicts to declare.Acknowledgements
This research work has been financially supported by the Plan For Scientific Innovation Talent of Henan Province (174100510015) and the National Nature Science Foundation of China (51502082).Notes and references
- M. K. Debe, Nature, 2012, 486, 43–51 CrossRef PubMed.
- J.-H. Wee, Renewable Sustainable Energy Rev., 2007, 11, 1720–1738 CrossRef.
- A. H. Brian and C. H. Steele, Mater. Sustainable Energy Appl., 2010, 224–231 Search PubMed.
- C. Giordano and M. Antonietti, Nano Today, 2011, 6, 366–380 CrossRef.
- Y. Hu, J. O. Jensen, W. Zhang, L. N. Cleemann, W. Xing, N. J. Bjerrum and Q. Li, Angew. Chem., Int. Ed., 2014, 53, 3675–3679 CrossRef PubMed.
- N. Levy, A. Mahammed, M. Kosa, D. T. Major, Z. Gross and L. Elbaz, Angew. Chem., Int. Ed., 2015, 54, 14080–14084 CrossRef PubMed.
- Q. Lu, M. Zhao, J. Chen, B. Chen, C. Tan, X. Zhang, Y. Huang, J. Yang, F. Cao, Y. Yu, J. Ping, Z. Zhang, X. J. Wu and H. Zhang, Small, 2016, 12, 4669–4674 CrossRef PubMed.
- M. Q. Wang, C. Ye, S. J. Bao, Z. Y. Chen, Y. N. Yu, Y. Zhang and M. W. Xu, Chem. Commun., 2016, 52, 12992–12995 RSC.
- B. Y. Xia, Y. Yan, N. Li, H. B. Wu, X. W. Lou and X. Wang, Nat. Energy, 2016, 1, 15006 CrossRef.
- C. Tang, B. Wang, H. F. Wang and Q. Zhang, Adv. Mater., 2017, 29, 1703185 CrossRef PubMed.
- D. Wang, Z. Ma, Y. e. Xie and H. Song, J. Energy Chem., 2017, 26, 1187–1195 CrossRef.
- H. Wu, X. Jiang, Y. Ye, C. Yan, S. Xie, S. Miao, G. Wang and X. Bao, J. Energy Chem., 2017, 26, 1181–1186 CrossRef.
- X. Chen, S. Sun, X. Wang, F. Li and D. Xia, J. Phys. Chem. C, 2012, 116, 22737–22742 CrossRef.
- P. Z. Guo Gang, J. Am. Chem. Soc., 2013, 46, 1878–1889 Search PubMed.
- S. Iijima, Nature, 1991, 354, 56 CrossRef.
- C. Tang, M.-M. Titirici and Q. Zhang, J. Energy Chem., 2017, 26, 1077–1093 CrossRef.
- C. Tang and Q. Zhang, Adv. Mater., 2017, 29, 1604103 CrossRef PubMed.
- S. Z. Chen, W. Yang, L. W. Li, H. B. Zou and W. M. Lin, Adv. Mater. Res., 2012, 557–559, 1218–1222 Search PubMed.
- L. Y. Dan Zhou, L. Yu, J. Kong, X. Yao, W. Liu, Z. Xu and X. Lu, Nanoscale, 2014, 1–8 Search PubMed.
- L.-B. Lv, T.-N. Ye, L.-H. Gong, K.-X. Wang, J. Su, X.-H. Li and J.-S. Chen, Chem. Mater., 2015, 27, 544–549 CrossRef.
- X. Zhang, R. Liu, Y. Zang, G. Liu, G. Wang, Y. Zhang, H. Zhang and H. Zhao, Chem. Commun., 2016, 52, 5946–5949 RSC.
- C. Hu, Y. Xiao, Y. Zhao, N. Chen, Z. Zhang, M. Cao and L. Qu, Nanoscale, 2013, 5, 2726 RSC.
- Inorganics IR Grating Spectra, 1972, vol. Y1k–Y600k, p. Y54k Search PubMed.
- P. Lukanov, V. K. Anuganti, Y. Krupskaya, A.-M. Galibert, B. Soula, C. Tilmaciu, A. H. Velders, R. Klingeler, B. Büchner and E. Flahaut, Adv. Funct. Mater., 2011, 21, 3583–3588 CrossRef.
- C. Han, X. Bo, Y. Zhang, M. Li, A. Nsabimana and L. Guo, Nanoscale, 2015, 7, 5607–5611 RSC.
- L. Cao, Z. Lin, J. Huang, X. Yu, X. Wu, B. Zhang, Y. Zhan, F. Xie, W. Zhang, J. Chen, W. Xie, W. Mai and H. Meng, Int. J. Hydrogen Energy, 2017, 42, 876–885 CrossRef.
- X. Zou, X. Huang, A. Goswami, R. Silva, B. R. Sathe, E. Mikmeková and T. Asefa, Angew. Chem., Int. Ed., 2014, 53, 4372–4376 CrossRef PubMed.
- G. S. P. Jang-Soo Lee, S. Tai Kim, M. Liu and J. Cho, Angew. Chem., Int. Ed., 2013, 52, 1026–1030 CrossRef PubMed.
- E. A. K. I. N. Timonova, E. V. Boldyreva and L. N. Mazalov, J. Struct. Chem., 1988, 28, 68–76 CrossRef.
- T. Y. Ma, S. Dai, M. Jaroniec and S. Z. Qiao, J. Am. Chem. Soc., 2014, 136, 13925–13931 CrossRef PubMed.
- W. X. Justus Masa, M. Muhler and W. Schuhmann, Angew. Chem., Int. Ed., 2015, 54, 10102–10120 CrossRef PubMed.
- R. S. Donghui Guo, C. Akiba, S. Saji and J. N. Takahiro Kondo, Science, 2016, 351, 361–365 CrossRef PubMed.
- Y. W. Qi Shi, Z. Wang, Y. Lei, B. Wang, N. Wu, C. Han, S. Xie and Y. Gou, Nano Res., 2016, 9, 317 CrossRef.
- M. Zeng, Y. Liu, F. Zhao, K. Nie, N. Han, X. Wang, W. Huang, X. Song, J. Zhong and Y. Li, Adv. Funct. Mater., 2016, 26, 4397–4404 CrossRef.
- X. Wang, W. Li, Z. Chen, M. Waje and Y. Yan, J. Power Sources, 2006, 158, 154–159 CrossRef.
Footnote |
| † Electronic supplementary information (ESI) available. See DOI: 10.1039/c8ra03139h |
| This journal is © The Royal Society of Chemistry 2018 |

