 Open Access Article
Fluorinated anionic fenugreek gum: their self-assembly behaviors and use as a novel thickening agent in fracturing gel
Chen Wang *,
Xia Wang and
Liewei Qiu
Key Laboratory of Auxiliary Chemistry & Technology for Chemical Industry, Ministry of Education, Shaanxi University of Science & Technology, Xi'an 710021, P. R. China. E-mail: wangchenhg@sust.edu.cn
First published on 22nd May 2018
Abstract
A novel fluorinated anionic fenugreek gum (FAFG) was obtained with excellent solution, gel, and broken-gel liquid properties in tertiary oil recovery, which were studied in detail and fenugreek gum (FG) and anionic fenugreek gum (AFG) were used as contrast samples. The results show that, compared to the FG and AFG solution properties, FAFG shows self-assembly properties, and inclusion of more fluorinated groups further reduced the critical associating concentration, yielding better associating properties. Compared to the FG and AFG gels, the FAFG gels exhibit good temperature resistance, shear resistance, rheological behaviors, and excellent salt tolerance. These improvements are attributed to the introduction of fluorinated groups and sulfonic groups. Compared to the FG and AFG broken-gel solutions, the FAFG broken-gel solutions presented slightly higher apparent viscosities. Moreover, the FAFG broken-gel solutions had profoundly lower surface tension and interfacial tension and extremely lower formation damage rates. They can hence serve as clean-up additives themselves after gel breaking. This automatically improves the flowback efficiency and reduces the formation damage. The residue rates of the FAFG broken-gel liquids were lower than those of the AFG and FG broken-gel liquids. Combined with its other excellent properties, FAFG would be an ideal component in fracturing gel.
1. Introduction
Fenugreek gum (FG), which is derived from the endosperm of the seeds of fenugreek, is a highly branched polysaccharide. It is a galactomannan composed of an α(1/4)-β-D-mannan backbone attached to single α-D-galactopyranosyl groups at the O-6 positions of D-mannopyranosyl residues.1,2 FG has galactose and mannose residues in a 1![[thin space (1/6-em)]](https://www.rsc.org/images/entities/char_2009.gif) :
:![[thin space (1/6-em)]](https://www.rsc.org/images/entities/char_2009.gif) 1.02 ratio; thus, it is a galactomannan with the highest amount of galactose. Thus, it has the highest water solubility and binding capacity among the galactomannans and yields high-viscosity aqueous solutions.3–5 Therefore, FG is used in myriad applications as binding, disintegrating, suspending, thickening, gelling, stabilizing, and protective agents.6–8
1.02 ratio; thus, it is a galactomannan with the highest amount of galactose. Thus, it has the highest water solubility and binding capacity among the galactomannans and yields high-viscosity aqueous solutions.3–5 Therefore, FG is used in myriad applications as binding, disintegrating, suspending, thickening, gelling, stabilizing, and protective agents.6–8
Anionic FG (AFG) is a kind of modified FG in which partial hydroxyl groups are replaced by carboxymethyl groups or sulfonic groups. While there are a few reports on AFG, Bassi & Kaur9 have obtained a carboxymethyl derivative of FG, which was found to possess bioadhesive properties and was therefore used for drug delivery. Unlike the carboxymethyl group, the sulfonic salt remains ionized over a wide range of pH values, does not form insoluble salts with bivalent metals such as Ca2+ or Mg2+, and shows better tolerance to hard water. This makes sulfonic acid derivatives of FG suitable for hydraulic fracturing.10
Hydraulic fracturing is widely used to stimulate oil and gas production from a reservoir. This technique improves well productivity by removing near wellbore damage and by increasing reservoir permeability in low as well as high permeability formations.11 A hydraulic fracture is formed when a fluid is pumped down the well at high pressures for short periods of time. The high pressure fluid exceeds the rock strength and opens a fracture in the rock. A proppant is pumped into the fractures, and the mixture fills the fracture. The pressure is then released, allowing closure of the fracture onto the fluid/proppant mixture. After the treatment, the proppant remains in the created fracture in the form of permeable pack that serves to keep the fracture open. These proppant packs form conductive pathways for the hydrocarbons to flow into the wellbore, which will allow more extensive production at higher flow rates than otherwise possible. Leaving the gel in the fracture zone would cause formation damage by decreasing oil or gas production. Thus to complete the fracturing process, the fracturing fluid must be broken into broken-gel liquid. And the viscosity of broken-gel liquid should similar to that of water in order to recover from the formation.12
Nowadays, galactomannans and their derivatives are widely used as thickening agents for fracturing fluids to stimulate the oil and gas wells.13 However, fracturing fluids based on galactomannans and their derivatives, after a fracturing treatment, leave an insoluble polymer residue in the proppant pack inside the fracture and in the reservoir formation around the fracture.14 This residue reduces the permeability of the reservoir and the propped fracture. Hence, it damages the formation and limits the full potential that could be achieved with the stimulation operation.
Hydrophobically associating polysaccharides can aggregate together, assemble, and form a dynamic physical cross-linking network, which increases the hydrodynamic volume.15–17 Thus, it can substantially enhance the solution's viscosity and induce special rheological behavior in the aqueous solutions.18 Fluorocarbon chains possess a lower surface energy and a stronger associative effect than those of hydrocarbon chains.19 Therefore, their properties of thickening effects, salt resistance, and heat resistance are preferable when the fluorinated monomers are used as hydrophobic groups.20,21 Broken-gel liquids containing fluorinated groups possess a much lower surface tension and interfacial tension, which help produce more oil. In addition, when the fluorinated groups are incorporated into the molecules, they play the role of clean-up additives. This improves the efficiency of flowback and automatically reduces the formation damage. Therefore, fluorinated FG presents outstanding broken-gel performance.
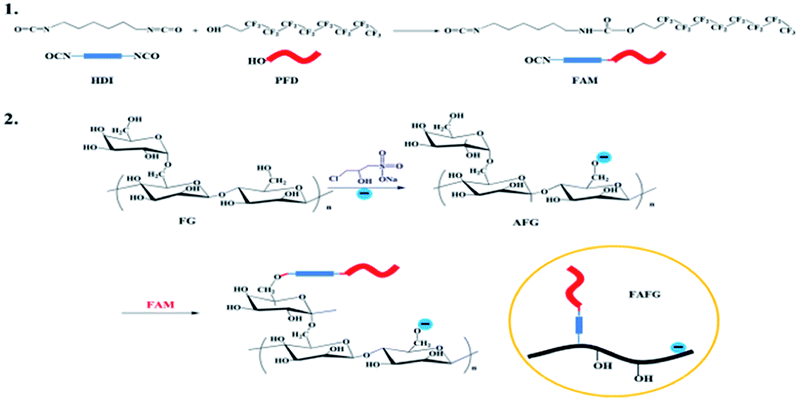
This study presents a novel fluorinated AFG (FAFG) with excellent salt tolerance and outstanding broken-gel performance in hydraulic fracturing. The AFG is obtained by the modification of FG with 3-chloro-2-hydroxy propanesulfonate (CHP). Then, the FAFG was synthesized from a fluorinated reactive monomer (FAM) and AFG. The molecular structure of the product was characterized through Fourier-transform infrared (FT-IR) and fluorine-19 nuclear magnetic resonance (19F NMR) spectroscopy. The rheological and associating behaviors of FAFG gels and the properties of broken-gel liquids are reported in detail.
2. Materials and methods
2.1. Materials
FG—whose average molecular weight, Mw, was approximately 1.0 × 10⁵—was purchased from Beijing Jiade Biochemistry Co., Ltd. (Beijing, China). Hexamethylene diisocyanate (HDI) was purchased from Tianjin Kermel Chemical Reagent Co., Ltd. (Tianjin, China). Dibutyltin dilaurate (T-12) was purchased from Tianjing Hongyan Chemical Reagent Co., Ltd. (Tianjin, China). 1H,1H,2H,2H-perfluoro-1-decanol (PFD) was purchased from Harbin Xeogia Group Co., Ltd. (Harbin, China). Acetone, ethanol, tetrahydrofuran, petroleum ether, and sodium hydroxide were purchased from Zhonghai Chemical Industry (Shandong, China). CHP, sodium tetraborate, and ammonium persulfate were purchased from Shanghai Haoye Chemical Co., Ltd. (Shanghai, China). The FG was extracted using acetone for 24 h. Distilled water was used for all experiments.2.2. Synthesis of AFG and FAFG
First, the FAM was synthesized from HDI and PFD through solution polymerization. A dry vessel fitted with a reflux condenser, mechanical stirrer, and digital thermometer, and a nitrogen gas inlet was charged with 0.11 mol of HDI and 50 mL of acetone. A solution of 20 mL of acetone with 0.1 mol of PFD was added dropwise into the vessel for 1.0 h. Then, the T-12 (0.02 wt% based on the total reactant mass) was added, and the contents were stirred for 6.0 h under circulation reflux. After removal of the acetone by distillation, a viscous liquid was obtained, and FAM was finally obtained by washing the viscous liquid with petroleum ether three times (100 mL each time).Second, AFG was synthesized from FG and CHP. Native FG powder (4.0 g) was suspended in a 200 mL mixture of solvents (the volume ratio of distilled water to ethanol was 1![[thin space (1/6-em)]](https://www.rsc.org/images/entities/char_2009.gif) :
:![[thin space (1/6-em)]](https://www.rsc.org/images/entities/char_2009.gif) 2) and stirred for 30 min at room temperature. Next, 5 mL of NaOH solution (20%) was added in intervals of 1.0 mL every 10 min under continuous magnetic stirring at 60 °C. CHP of a specified weight was then added portion-wise to the reaction mixture over a period of 20 min. The reaction mixture was then heated to 70 °C for 4 h. The pH of the mixture was neutralized before the product was filtered via vacuum filtration; subsequently, it was washed three times with 50 mL of a hydro-alcoholic mixture (50% ethanol). The obtained product was then oven-dried at 105 °C for 24 h and powdered in a glass mortar.
2) and stirred for 30 min at room temperature. Next, 5 mL of NaOH solution (20%) was added in intervals of 1.0 mL every 10 min under continuous magnetic stirring at 60 °C. CHP of a specified weight was then added portion-wise to the reaction mixture over a period of 20 min. The reaction mixture was then heated to 70 °C for 4 h. The pH of the mixture was neutralized before the product was filtered via vacuum filtration; subsequently, it was washed three times with 50 mL of a hydro-alcoholic mixture (50% ethanol). The obtained product was then oven-dried at 105 °C for 24 h and powdered in a glass mortar.
Finally, a dry vessel fitted with the same equipment as described in the first step was charged with 5.0 g of the dried AFG and 200 mL of tetrahydrofuran. The solution of 20 mL of tetrahydrofuran with different amounts of FAM was added dropwise into the vessel for 1.0 h. Then, T-12 (0.02 wt% based on the total reactant mass) was added, and the contents were stirred for another 12.0 h under circulation reflux. The product was extracted from the acetone for approximately 24 h and dried in a vacuum. The degree of substitution (DS) was determined by nitrogen analysis. The synthetic processes are shown in Scheme 1.
2.3. Preparation of solutions and gels
![[thin space (1/6-em)]](https://www.rsc.org/images/entities/char_2009.gif) :
:![[thin space (1/6-em)]](https://www.rsc.org/images/entities/char_2009.gif) 0.4. The mixtures were stirred with a glass rod until homogeneous gels were formed. FG and AFG gels were prepared under the same conditions. The gels were stored in containers under room temperature until use.
0.4. The mixtures were stirred with a glass rod until homogeneous gels were formed. FG and AFG gels were prepared under the same conditions. The gels were stored in containers under room temperature until use.2.4. Preparation of broken-gel liquid
The gel breaker (ammonium persulfate) was added to the FAFG gels at a mass ratio of gel to gel breaker of 1000![[thin space (1/6-em)]](https://www.rsc.org/images/entities/char_2009.gif) :
:![[thin space (1/6-em)]](https://www.rsc.org/images/entities/char_2009.gif) 0.5. The gel-breaking time and temperature were 2 h and 60 °C, respectively. The obtained solution was the broken-gel liquid. The broken-gel liquids of FG and AFG were prepared under the same conditions. The solutions were stored in containers under room temperature until use.
0.5. The gel-breaking time and temperature were 2 h and 60 °C, respectively. The obtained solution was the broken-gel liquid. The broken-gel liquids of FG and AFG were prepared under the same conditions. The solutions were stored in containers under room temperature until use.
2.5. Preparation of standard mineralized water
The degree of mineralization, M, is defined as the total mass concentration of all salt in water (mg L−1). The standard mineralized water was prepared as follows: 4902.68 g of distilled water was added to a 10 L beaker, which was continuously stirred by vigorous mechanical working to form a vortex. Then, 5.7165 g of anhydrous calcium chloride, 4.3150 g of magnesium chloride hexahydrate, and 87.2890 g of sodium chloride were added slowly in sequence—each must be completely dissolved before adding the next. The value of M was 19![[thin space (1/6-em)]](https://www.rsc.org/images/entities/char_2009.gif) 334 mg L−1. The total concentration of calcium and magnesium ions was 514 mg L−1. Other mineralized waters were prepared by increasing or decreasing the various salt concentrations.
334 mg L−1. The total concentration of calcium and magnesium ions was 514 mg L−1. Other mineralized waters were prepared by increasing or decreasing the various salt concentrations.
2.6. Test methods
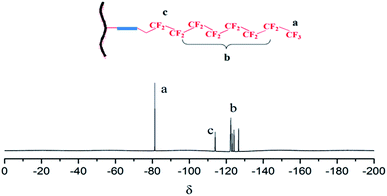
19F-NMR spectroscopy of FAFG was performed using an NMR spectrometer (DPX-400 spectrometer, Bruker). The digital resolution was ±0.01 ppm, with 0.1% D2O as solvent.
DS, which is defined as the number of substituted hydroxyl groups per sugar unit of FG, was determined from the contents of nitrogen. The nitrogen content of the products (N wt%) was measured using an elemental analyzer (EA, Heraeus Co., Germany). The DS was calculated as described elsewhere.14 FAFG-1, FAFG-2, and FAFG-3 correspond to the cases in which the DS values were 0.005, 0.01, and 0.02, respectively. The DS' (sulfonic acid groups) of AFG was 0.1.
Fluorescence spectroscopy (FS) measurements were performed using a Cary Eclipse Fluorophotometer at 25 °C with excitation at 338 nm and a bandpass slit width of 3.0 nm in a scanning range of 350–550 nm. Pyrene was used as the fluorescent probe.
Scanning electron microscopy (SEM, VEGA3, TESCAN) was used to observe the sample microstructures. Prior to SEM imaging, the specimens were frozen in liquid nitrogen slush, and the ice sublimed away at low temperatures under a vacuum. Then, the freeze-dried samples were glued onto an aluminum stub, and their surfaces were coated with gold.
The rheological properties of the gels were determined using an RS150L Haake rheometer. The shear and temperature-resistant measurements were carried out with increasing temperature from 25 °C to 70 °C under a shear rate of 170 s−1. The samples were then maintained at the test temperature (70 °C) for an additional 3600 s. The dynamic measurement of FAFG gel (tan![[thin space (1/6-em)]](https://www.rsc.org/images/entities/char_2009.gif) δ) was conducted in the temperature range of 25–70 °C. These measurements were taken within the linear viscoelastic region. The apparent viscosity measurements of salt resistance were examined, while the test temperature and shear rate were set at 60 °C and 7 s−1, respectively.
δ) was conducted in the temperature range of 25–70 °C. These measurements were taken within the linear viscoelastic region. The apparent viscosity measurements of salt resistance were examined, while the test temperature and shear rate were set at 60 °C and 7 s−1, respectively.
The residue content included the insoluble materials remaining in the broken-gel fluid after conventional gel breakage. A certain amount of broken-gel solution was poured into the centrifuge tube and centrifuged at 3000 rpm for 30 min. Then, the broken-gel residue was washed with 50 mL of distilled water and again centrifuged under the same condition after slowly pouring off the supernatant. This process was repeated three times. The obtained residue was dried to a constant weight and then weighed. The residue content was calculated as eqn (1):
| R = m/V | (1) |
The matrix permeability damage ratio was used to calculate the initial permeability ratio before damage. Then, the core was saturated again using the fracturing fluid filtrate, and the permeability ratio after damage was obtained. The matrix permeability damage ratio, D (%), was calculated as eqn (2):
| D = (K1 − K2)/K1 × 100% | (2) |
3. Results and discussion
3.1. Characterization of FAFG
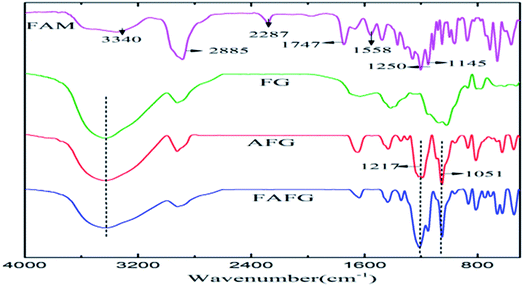
FAM was successfully incorporated into FAFG, and this was verified by FT-IR and 19F NMR (Fig. 1 and 2, respectively).![[double bond, length as m-dash]](https://www.rsc.org/images/entities/char_e001.gif) O: 1747 cm−1; νC–O: 1145 cm−1) in the spectrum of HDI.22 The carbimide group (2287 cm−1) is still present, which indicates that FAM is synthesized successfully. Comparing the FT-IR spectra of FG and AFG, the characteristic absorption peaks of the sulfonated group (1051 cm−1, 1217 cm−1) appear in the spectrum of AFG.23 These data indicate that AFG was prepared successfully.
O: 1747 cm−1; νC–O: 1145 cm−1) in the spectrum of HDI.22 The carbimide group (2287 cm−1) is still present, which indicates that FAM is synthesized successfully. Comparing the FT-IR spectra of FG and AFG, the characteristic absorption peaks of the sulfonated group (1051 cm−1, 1217 cm−1) appear in the spectrum of AFG.23 These data indicate that AFG was prepared successfully.Combined with the spectra of FAM, AFG, and FAFG, the characteristic absorption peaks of FAM appear in the FAFG spectrum. Simultaneously, the characteristic absorption of the aforementioned carbimide group vanishes. These data indicate that the FAM was successfully incorporated into the FAFG.
3.2. Properties of FAFG solutions
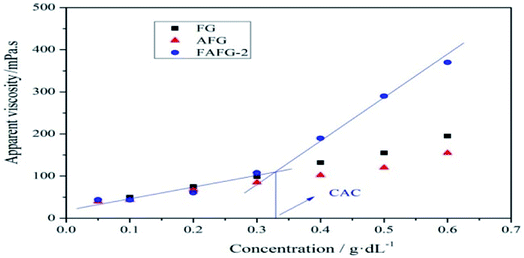
The relationship between the concentration and the apparent viscosity is shown in Fig. 3. When the FAFG concentration increases, the apparent viscosities rise correspondingly, yet there is a sudden increase in the apparent viscosity. However, this abrupt change does not appear in the viscosity–concentration curves for FG and AFG. The resultant trend indicates that fluorinated groups are successfully introduced into AFG, which endow it with the special increasing pattern of apparent viscosity.
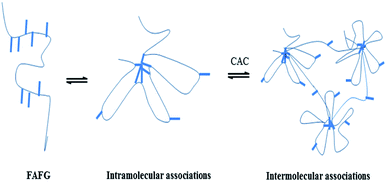
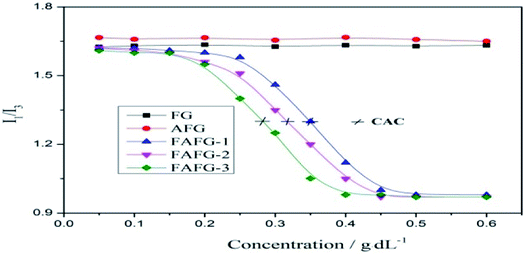
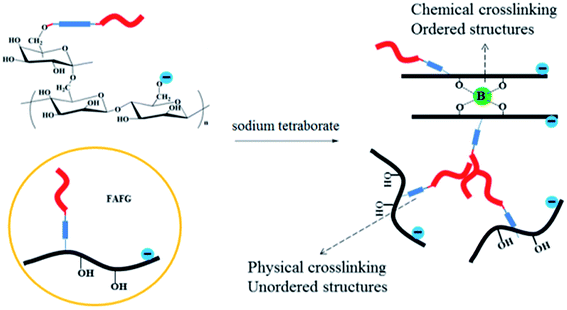
This nonlinear sudden increase of apparent viscosity of FAFG is the macroscopic expression of the transformation from intra-molecular aggregates to inter-molecular ones (Scheme 2), which results in the occurrence of the critical associating concentration (CAC). The CAC of FAFG-2 is 0.33 g dL−1. The transformation causes the macromolecular chains to cross-link, increasing the hydrodynamic volume.
As seen in Fig. 4, the I1/I3 of the FAFG samples declines slightly from the beginning owing to the small amount of intramolecular hydrophobic micro-domains in their aqueous solutions. With increasing FAFG concentration, numerous hydrophobic micro-domains appear because of intermolecular associations, which drastically weakness the polarity of the microenvironment surrounding the pyrene, abruptly reducing the value of I1/I3. Owing to the limited solubilization of pyrene in the solutions, the value of I1/I3 remains unchanged beyond certain concentrations. Additionally, the inclusion of more fluorinated groups further reduces the CAC values and yields better associating properties.
The value of I1/I3 in the FG and AFG aqueous solutions remains constant as their concentrations increase. It vividly displays that there are neither hydrophobic micro-domains nor associating effects in the FG and AFG solutions. However, the I1/I3 value of AFG is slightly higher than that of FG because the sulfonic acid groups in the AFGs result in a stronger polarity of the microenvironment surrounding pyrene. These conclusions confirm and supplement the results of the thickening effects by the measurement of apparent viscosity.
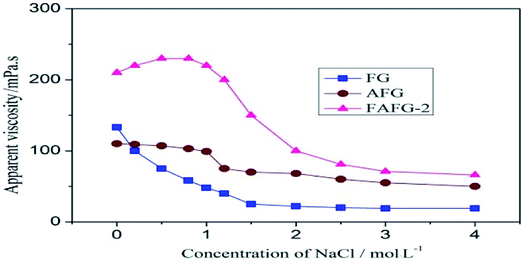
The non-polar hydrophobic groups in the FAFG tended to further increase the probability of association because of the enhancement of solution polarity with the relatively low concentration of NaCl solution; accordingly, a large increase in the number of the physical cross-linking points occurred and the apparent viscosity of the FAFG solution increased. However, when the concentration of NaCl was in the range of 0.8–2.0 mol L−1, the apparent viscosity of the FAFG solution decreased rapidly. This result is attributed to the shielding effect of the negative charges in FAFG, which led in turn to a reduction in electro-static repulsion between polymer coils and between polymeric segments in the same coil. Consequently, there was a less remarkable expansion of the polymer coils in the solution. Additionally, the strong polarity brought about weak hydrogen bond actions. Both resulted in a relatively lower hydrodynamic volume, which was synonymous with a lower viscosity. In high concentrations of NaCl, the fluorinated hydrophobic groups in FAFG associated to maintain the apparent viscosity and did not decrease further. In addition, the branched structures were markedly improved in FAFG by the incorporation of sulfonic acid groups even if the strong polar ionic groups were shielded. These provided a larger steric hindrance, enhancing the rigidity of the main chain and protecting FAFG from hydrolysis, which helped maintain the apparent viscosity of the solution. Thus, the self-assembly behavior of FAFG shows fine salt resistance.
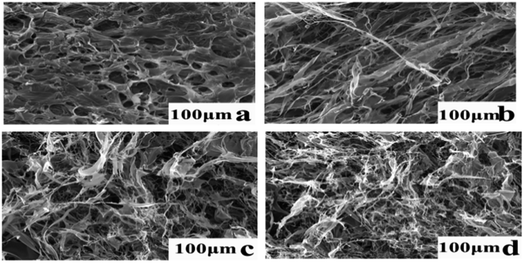
Fig. 7 shows four micrographs of AFG and FAFG solution samples with same sizes (100 μm). Fig. 7(a) shows that the AFG fibers appear uniformly distributed throughout the image, and void spaces exist among the fibers. However, as seen in Fig. 7(b), (c) and (d), the FAFG molecules were much more highly entangled and strongly interpenetrated than those of AFG. In addition, the higher DS yielded much tighter interpenetrations, indicating that the more fluorinated groups resulted in more physical networks in the solutions. The micrographs show that the FAFG solutions would be beneficial to fracturing operations.
3.3. Properties of FAFG gels
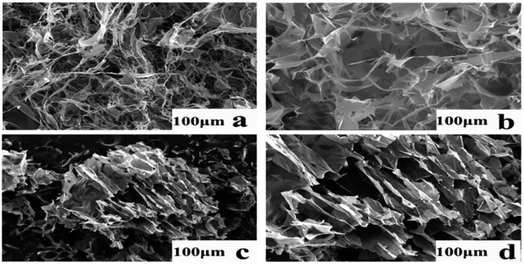
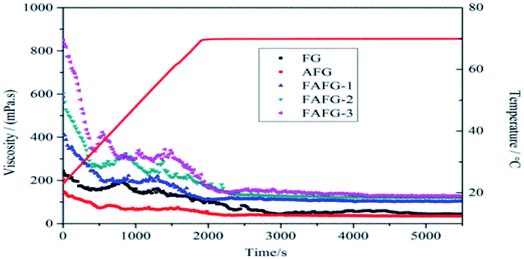
The cross-linking principles of FAFG and AFG are not the same. As shown in Scheme 3, the sodium tetraborate links FG macromolecules together through coordination bonds. Moreover, hydrophobic association occurs between FAFG macromolecules because they contain strong hydrophobic fluorinated groups. Thus, except for coordination cross-linking, physical cross-linking structures will also form in the gel system. The dynamic, three-dimensional networks endow the gel with a viscoelastic state.As the temperature increases, the viscosities of the FAFG gels suddenly rise because the moderate heat makes the intramolecular associations transform into intermolecular associations. However, extending the shear time and further increasing temperature damage the association between the molecules, reduce the viscosity. Finally, a dynamic equilibrium between the entanglement and disentanglement of molecular chains is reached, and the viscosity becomes constant. From the different DSs of the FAFG gels, it can be concluded that a higher DS improves the shear resistance and heat resistance.
![[thin space (1/6-em)]](https://www.rsc.org/images/entities/char_2009.gif) δ) is an important parameter for representing the viscoelasticity of a solution or a gel system. It exhibits viscidity when tan
δ) is an important parameter for representing the viscoelasticity of a solution or a gel system. It exhibits viscidity when tan![[thin space (1/6-em)]](https://www.rsc.org/images/entities/char_2009.gif) δ > 1 and elasticity when tan
δ > 1 and elasticity when tan![[thin space (1/6-em)]](https://www.rsc.org/images/entities/char_2009.gif) δ < 1. The loss factor (tan
δ < 1. The loss factor (tan![[thin space (1/6-em)]](https://www.rsc.org/images/entities/char_2009.gif) δ) and their digital photographs of FG, AFG and FAFGs at different temperatures are shown in Fig. 10.
δ) and their digital photographs of FG, AFG and FAFGs at different temperatures are shown in Fig. 10.
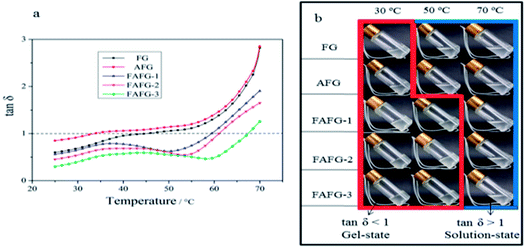 | ||
| Fig. 10 Loss factors and digital photographs of FAFG gel at different temperatures: (a) loss factors; (b) digital photographs. | ||
The tan![[thin space (1/6-em)]](https://www.rsc.org/images/entities/char_2009.gif) δ of FG and AFG increases as the temperature increases, but tan
δ of FG and AFG increases as the temperature increases, but tan![[thin space (1/6-em)]](https://www.rsc.org/images/entities/char_2009.gif) δ of FAFG shows different trends of decreasing at relative higher temperatures (40–60 °C). Correspondingly, the digital photographs in Fig. 10(b) presents that the FAFGs are gel-state and FG/AFG are solution-state at 50 °C. On the whole, tan
δ of FAFG shows different trends of decreasing at relative higher temperatures (40–60 °C). Correspondingly, the digital photographs in Fig. 10(b) presents that the FAFGs are gel-state and FG/AFG are solution-state at 50 °C. On the whole, tan![[thin space (1/6-em)]](https://www.rsc.org/images/entities/char_2009.gif) δ increases, showing the elasticity of the system decreases because the molecular thermal motions are increased. However, the tan
δ increases, showing the elasticity of the system decreases because the molecular thermal motions are increased. However, the tan![[thin space (1/6-em)]](https://www.rsc.org/images/entities/char_2009.gif) δ of FAFG shows decreasing in the temperature range of 40–50 °C (FAFG-1), 45–55 °C (FAFG-2), 50–60 °C (FAFG-3), suggesting that the FAFG can enhance the elasticity performances to some extent. These trends may be attributed to the temperature prompting “physical cross-linking” of hydrophobic groups in FAFG molecular fragments. They are thus associated together to improve the elasticity of the system. Their digital photographs in Fig. 10(b) vividly complement the transforming process from gel to solution with the increase of temperature. In the red square box, the tan
δ of FAFG shows decreasing in the temperature range of 40–50 °C (FAFG-1), 45–55 °C (FAFG-2), 50–60 °C (FAFG-3), suggesting that the FAFG can enhance the elasticity performances to some extent. These trends may be attributed to the temperature prompting “physical cross-linking” of hydrophobic groups in FAFG molecular fragments. They are thus associated together to improve the elasticity of the system. Their digital photographs in Fig. 10(b) vividly complement the transforming process from gel to solution with the increase of temperature. In the red square box, the tan![[thin space (1/6-em)]](https://www.rsc.org/images/entities/char_2009.gif) δ < 1 and digital photographs present gel-state. Otherwise, tan
δ < 1 and digital photographs present gel-state. Otherwise, tan![[thin space (1/6-em)]](https://www.rsc.org/images/entities/char_2009.gif) δ > 1 and digital photographs present solution-state in the blue square box. All the results show that the FAFG gels have better ability of temperature tolerance.
δ > 1 and digital photographs present solution-state in the blue square box. All the results show that the FAFG gels have better ability of temperature tolerance.
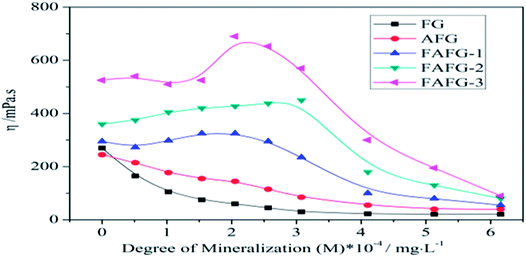
However, the viscosity of the FAFG gel reaches a maximum value when M is near 2 × 10⁴ mg L−1. When the M value exceeds 3 × 10⁴ mg L−1, the FAFG gel's viscosity falls sharply. Additionally, a higher DS increases the FAFG gel's viscosity because it is influenced by the association between fluorinated molecular chains in the system. The gentle increase in M (gently increased polarity) is good for association. This leads to an increase in the number of physical cross-linking points, increasing the viscosity. When M continues to increase in the FAFG gel systems, the curl of the molecules is aggravated, and even macromolecules are degraded by high M.
3.4. Properties of FAFG broken-gel liquids
The performance of the broken-gel liquids directly affects the flowback of fracturing fluid, which is a principal factor for formation damage. The rational use of a gel breaker is helpful for accelerating gel breaking and expediting the flowback. Ammonium persulfate was used as the gel breaker, and the properties of the broken-gel liquid were studied.| Samples | Viscosities (mPa s) | Surface tensions (mN m−1) | Interfacial tensions (mN m−1) | Residue rates (%) |
|---|---|---|---|---|
| FG | 5.4 | 40.99 | 4.88 | 245 |
| AFG | 2.9 | 47.12 | 6.77 | 175 |
| FAFG-1 | 3.3 | 25.05 | 1.99 | 203 |
| FAFG-2 | 3.9 | 22.23 | 1.37 | 218 |
| FAFG-3 | 4.2 | 20.30 | 0.77 | 236 |
However, the viscosity of FAFG is higher than that of FG and AFG. Furthermore, a higher DS leads to higher viscosity. Because there are fluorinated groups in FAFG, these can be associated together to entangle the FAFG broken-gel pieces. When DS increases, the viscosities of the sample broken-gel liquids increase accordingly owing to the presence of more associating points.
| Samples | Permeability of formation matrix (10−3 μm2) | Formation damage rates (%) | |
|---|---|---|---|
| Before damage | After damage | ||
| FG | 3.28 | 2.88 | 12.19 |
| AFG | 3.28 | 2.97 | 9.45 |
| FAFG-1 | 3.28 | 3.00 | 8.54 |
| FAFG-2 | 3.28 | 3.06 | 6.71 |
| FAFG-3 | 3.28 | 3.10 | 5.49 |
Likewise, the formation damage rates of the FAFG broken-gel liquids are much smaller than that of the FG broken-gel liquid (the formation damage rate of the FAFG-3 broken-gel liquid is 54.96% smaller than that of the FG broken-gel liquid). Moreover, the formation damage rate of the FAFG-1 broken-gel liquid is 35.71% smaller than that of the FAFG-3 broken-gel liquid, indicating that more fluorinated groups result in less formation damage. Because the crude oil in formation will be perfectly emulsified by the high surface activity of the broken-gel liquids, the formation damage is greatly reduced.
4. Conclusions
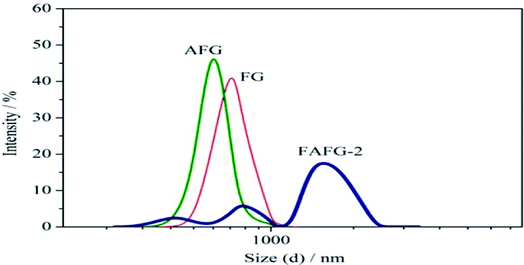
This study presented a novel FAFG with excellent salt tolerance and outstanding broken-gel performance in tertiary oil recovery. Compared to FG and AFG aqueous solutions, the FAFG aqueous solution showed self-assembly properties, and the CAC value of FAFG-2 was 0.33 g dL−1. The inclusion of more fluorinated groups reduces the CAC, yielding better associating properties. Additionally, multiple apparent aggregate sizes of FAFG appeared owing to both intramolecular and intermolecular associations. The incorporation of sulfonic acid groups and fluorinated groups enhanced the salt resistance of the aqueous solution.Compared to the FG and AFG gels, the FAFG gels exhibited good temperature resistance, shear resistance, rheological behavior, and excellent salt tolerance. These improvements are attributed to the introduction of fluorinated groups and sulfonic groups. In addition, increasing the DS of the FAFG gel yielded better rheological behavior.
Compared to the FG and AFG broken-gel liquids, the FAFG broken-gel solutions presented slightly higher apparent viscosities, profoundly lower interfacial and surface tensions, and extremely lower formation damage rates. The residue rates of the FAFG broken-gel liquids were lower than those of the AFG and FG broken-gel liquids. Additionally, increasing the DS of the FAFG broken-gel liquid leads to better broken-gel performance. These results evince the potential applications of FAFG in fracturing fluids with its other excellent properties.
Conflicts of interest
There are no conflicts to declare.Acknowledgements
We would like to express gratitude to the Natural Science Foundation of China [grant number 5160030644]; and the Scientific Research Fund of Shaanxi Provincial Education Department [grant number 17JK0101]; and the Natural Science Foundation of Shaanxi Province (2017JM2017).References
- M. Kasran, S. W. Cui and H. D. Goff, Food Hydrocolloids, 2013, 30, 552–558 CrossRef.
- H. L. Jian, X. Lin, W. A. Zhang, W. M. Zhang, D. F. Sun and J. X. Jiang, Food Hydrocolloids, 2014, 40, 115–121 CrossRef.
- G. Ravindran and L. Matia-Merino, Food Hydrocolloids, 2009, 23, 1047–1053 CrossRef.
- Y. Wei, Y. Lin, R. Xie, Y. Xu, J. Yao and J. Zhang, J. Food Eng., 2015, 166, 21–28 CrossRef.
- M. K. Youssef, Q. Wang, S. W. Cui and S. Barbut, Food Hydrocolloids, 2010, 23, 2049–2053 CrossRef.
- O. Kaltsa, N. Spiliopoulou, S. Yanniotis and I. Mandala, Food Hydrocolloids, 2016, 61, 625–632 CrossRef.
- M. Meghwal and T. K. Goswami, J. Food Process. Technol., 2012, 3, 1–10 Search PubMed.
- Y. Brummer, W. Cui and Q. Wang, Food Hydrocolloids, 2003, 17, 229–236 CrossRef.
- P. Bassi and G. Kaur, Eur. J. Pharm. Biopharm., 2015, 96, 173–184 CrossRef PubMed.
- V. Mathur and N. K. Mathur, J. Sci. Ind. Res., 2005, 64, 475–481 Search PubMed.
- R. Barati and J. T. Liang, J. Appl. Polym. Sci., 2014, 131, 318–323 CrossRef.
- M. Mage, Chem. Eng. News, 2013, 91, 4 Search PubMed.
- S. Wang, Y. Zhang, J. Guo, J. Lai, D. Wang, L. He and Y. Y. Qin, J. Pet. Sci. Eng., 2014, 124, 432–435 CrossRef.
- S. Yan, Y. Wang, J. He and H. Zhang, Russ. J. Appl. Chem., 2015, 88, 1884–1891 CrossRef.
- D. Charpentiervalenza, L. Merle, G. Mocanu, L. Picton and G. Muller, Carbohydr. Polym., 2005, 60, 87–94 CrossRef.
- Y. Feng, L. Billon, B. Grassl, G. Bastiat, O. Borisov and J. François, Polymer, 2005, 46, 9283–9295 CrossRef.
- X. Z. Yu, P. W. Fei, Z. L. Miao and E. J. Wang, J. Phys. Chem. B, 2005, 109, 22250–22255 CrossRef PubMed.
- C. Wang, X. Li, B. Du, P. Li and H. Li, Carbohydr. Polym., 2013, 95, 637–643 CrossRef PubMed.
- Y. X. Zhang, A. H. Da, G. B. Butler and T. E. Hogen-Esch, J. Fluorine Chem., 1991, 54, 91–93 CrossRef.
- H. Li, Z. Zhang, C. Hu, S. Wu and S. Ying, Eur. Polym. J., 2004, 40, 2195–2201 CrossRef.
- J. Song, W. Fan, X. Long, L. Zhou, C. Wang and G. Li, J. Pet. Sci. Eng., 2016, 146, 999–1005 CrossRef.
- E. Pretsch, P. Bühlmann and M. Badertscher, Structure determination of organic compounds: tables of spectral data, Springer, 4th edn, 2000, vol. 22, pp. 355–360 Search PubMed.
- L. Zhang, L. R. Kucera, S. Ummadisetty, J. R. Nykaza, Y. A. Elabd, R. F. Storey, K. A. Cavicchi and R. A. Weiss, Macromolecules, 2014, 47, 4387–4396 CrossRef.
- C. Schorn, D. Naumann, H. Scherer and J. Hahn, J. Fluorine Chem., 2001, 107, 159–169 CrossRef.
| This journal is © The Royal Society of Chemistry 2018 |

