 Open Access Article
Amplifying fluorescence signal contrast of aptamer-modified microspheres inspired by whispering-gallery mode lasing†
Sooyeon Kim‡
 ,
Ayaka Kuroda,
Mamoru Fujitsuka
 and
Tetsuro Majima
 *
*
The Institute of Scientific and Industrial Research (SANKEN), Osaka University, Mihogaoka 8-1, Ibaraki, Osaka 567-0047, Japan. E-mail: majima@sanken.osaka-u.ac.jp
First published on 6th June 2018
Abstract
We propose a new sensor design that maximizes fluorescence contrast, inspired by whispering-gallery mode lasing (WGM). Aptamer-modified glass microspheres (cf. 1–38 μm) and thrombin are used as a model sensory cavity and target protein, respectively. Two types of microsphere are prepared to compare fluorescence contrast: turn-on and turn-off types by using fluorophore-labeled target protein and fluorophore-labeled DNA duplex with thrombin-binding aptamer (TBA), respectively. For the turn-on type, a fluorescence increase was detected in the presence of 100 nM thrombin, but signal amplification upon excitation power did not occur. As for the turn-off type, in the absence of thrombin, fluorophores are densely populated around the microsphere, leading to fluorescence confinement and intensity amplification upon increasing the pump intensity. By adding thrombin, a complementary strand of TBA is dissociated from the microsphere, and the G-quadruplex structure of the thrombin aptamer recognizes and binds to thrombin. As the fluorophore density around the microsphere decreases, fluorescence amplification based on WGM resonance is halted, resulting in 29-fold enhanced contrast under increased excitation power.
Introduction
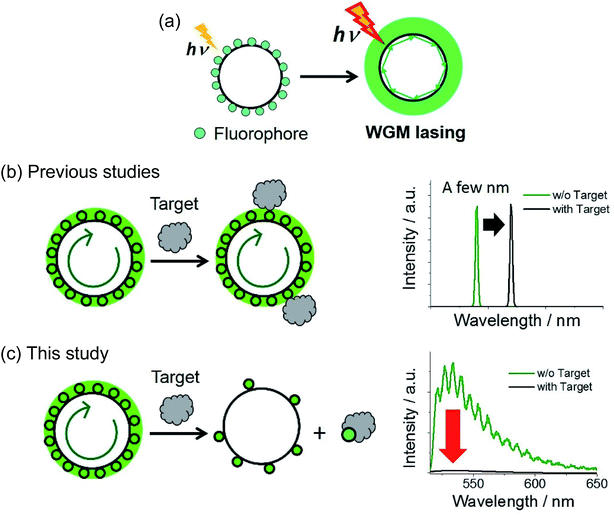
The design of novel materials is crucial for improving the selectivity, sensitivity, and response speed of biosensors. Nonetheless, biosensors based on fluorescence intensity changes often suffer from small signal-to-noise ratios in the presence of the target. For turn-on sensors, this dim signal contrast originates from either incomplete fluorescence quenching in the initial form or/and insufficient optical signal enhancement, with the reverse being true for turn-off sensors. Qualitative fluorescence sensors relying on spectral shifts1 or lifetime changes2 have been developed to mitigate this problem, being particularly useful in complex and heterogeneous environments, such as those found in living cells.A powerful alternative to the above methodologies is provided by fluorescence signal maximization, which enhances the signal-to-noise ratio and thus increases signal contrast. Herein, this approach was realized using a laser. In contrast to spontaneous fluorescence emission, the intensity of a laser signal exponentially increases with pumping (i.e., excitation light) intensity.3 Furthermore, the gain medium does not exhibit lasing at excitation intensities below a certain value, which is denoted as the laser threshold. Thus, proper exploitation of all-or-none laser characteristics allows the construction of extremely sensitive and bright fluorescent sensory systems. Whispering-gallery-mode (WGM) lasers have recently been employed in fluorescence sensors owing to their small laser threshold.4–13 WGM resonance occurs when pumped emission is confined in a spherical cavity (Fig. 1a), with repetitive total internal reflections along the cavity circumference achieving coherency and amplification of light and thus resulting in lasing. Various WGM lasers have been recently developed, characterized by their cavities: a spherically shaped structure connected by a pump optics,4–6 spherical self-assembly or molecular crystals,8,14,15 fluorophore-doped microspheres,7,9,10 and so on (summarized in Fig. S1†).
Since the properties of WGM lasing are strongly affected by changes in the surrounding environment (e.g., those of its refractive index, n), WGM-based sensors allow label-free detection of biomolecules based on the shift of laser peak position and splitting or broadening of the peak (Fig. 1b).5 Furthermore, Fan et al. developed a DNA- and antibody-conjugated flow system, namely optofluidic laser, capable of flowing a sample solution along the circular-shaped optical fiber11 or inside of ring-shaped resonator.12,13 The label-free sensing method as well as microfluidic-based sensors have been applied to detect the various targets, proving a high accuracy and sensitivity. On the other hand, WGM sensors based on a molecular self-assembly and crystal are rarely reported8 because it is challenging to design the molecular structure of building blocks that satisfy a supramolecular interaction, high emissivity, and sensitivity to a target simultaneously. Furthermore, to design a biocompatible and cell-permeable sensor, the cavity should be smaller than a few micrometers and be moderately non-toxic. Thus, the conventional cavities made by waveguides or microfluidics cannot be used inside of a cell (Fig. S1a and b†).
In this study, we propose a new fluorescence sensor composed of glass microspheres (1–38 μm) doped with DNA aptamer, which were used as biocompatible WGM cavities and sensory material of a target protein, respectively. Based on our design, the gain medium itself can directly interact/react with a target, and release or be doped on the surface of a cavity. As a result, in ideal, one can monitor all-or-none type response above a certain concentration of the target (Fig. 1c). As for a sensory material, we used aptamers, nucleic acid oligomers capable of binding a particular target by utilizing molecular interactions such as hydrogen bonding and hydrophobic interactions, endowing sensors with the required selectivity.16–19 Conjugation of aptamers to inorganic materials (e.g., metals, semiconductors, and ceramics) affords sensors with intriguing optical properties such as metal-enhanced fluorescence and scattering signals.20–22 Furthermore, the combination of WGM resonators and aptamer has been previously reported for the development of a label-free detection method (Fig. 1b).23,24 At the best of our knowledge, however, there have been no report that the gain medium on the microsphere cavity can directly interact or react with a target analyte, which switches the on–off of the fluorescence amplification and lasing (Fig. 1c). Herein, we labeled aptamer oligomers on the glass microsphere cavity, and achieved 29-fold signal contrast enhancement at high pump intensity upon recognizing the target protein.
Experimental section
Materials
Soda lime glass microspheres (SLGMS-2.5, 1–38 μm, 10 g) were obtained from Cospheric (USA). DNA oligomers are synthesized and purified by JBios (Japan) and Hokkaido System Science Co., Ltd. (Japan) and the sequences are summarized in Table S1.† Thrombin from human plasma (T1063, Sigma), BODIPY 493/503 NHS ester (D2191, Thermo Fisher Scientific), Alexa 488 TFP ester (A37563, Thermo Fisher Scientific), ninhydrin (N0719, TCI), 3-aminopropyltriethoxysilane (APTES; A0439, TCI), p-phenylene diisothiocyanate (PDC; P1279, TCI), aminomethyl polystyrene resin (A2047, TCI), and SNARF-1 succinimidyl ester (S22801, Thermo Fisher Scientific) were used without purification. Typically, experiments with DNA oligomers were conducted in 20 mM Tris HCl buffer (pH 8.0).Instrumentation
Fluorescence, circular dichroism (CD), Fourier transform infrared (FT-IR) spectroscopy, and X-ray photoelectron spectroscopy (XPS) measurements were conducted using a Horiba FluoroMax-4 spectrometer, JASCO spectropolarimeter J725, JASCO FT-IR 4100 spectrometer, and a Shimadzu KRAROS AXIS-165x instrument, respectively. DNA melting points were determined using a Shimadzu UV2700.General procedure of the glass surface modification25,26
Soda lime glass microspheres were activated by 6 h stirring in 6 M HCl, washed three times with ultrapure water, centrifuged at 5000 rpm, and dried at 130 °C for 2 h. The activated glass surface was modified with amine groups using APTES. A solution of APTES in toluene (30%) was slowly added to a suspension of glass microspheres (0.47 g) in the same (2.8 mL) under argon, followed by overnight incubation at 80 °C. The obtained APTES-functionalized microspheres were washed with toluene, dichloromethane, and acetone using a centrifuge and dried at 130 °C for 2 h, with amino group grafting subsequently confirmed by FT-IR and XPS analyses as well as by a ninhydrin assay.Next, isothiocyanate groups were grafted on the glass surface to make it amine-reactive. APTES-functionalized glass microspheres (0.20 g) were incubated in a 1% (w/w) PDC solution in 10/90 (v/v) pyridine/DMF under 2 h magnetic stirring at room temperature. The obtained PDC-functionalized microspheres were washed with methanol and acetone using a centrifuge and dried at 130 °C for 3 h. Successful isothiocyanate grafting was confirmed using a ninhydrin assay and functionalization with Cy5-labeled single-stranded DNA bearing an amino group.
Finally, fluorescent dye and aptamer labeling was carried out using APTES- and PDC-functionalized glass microspheres, respectively. Fluorescent dye labeling was performed in 100 mM phosphate-buffered saline (pH 8) by incubating APTES-functionalized glass microspheres (5 mg) with Alexa Fluoro 488 TFP ester (12 μM) under magnetic stirring overnight at room temperature. Aptamer grafting was performed by incubating PDC-functionalized microspheres (5 mg) in a 2.5 μM solution of the desired aptamer in 100 mM phosphate-buffered saline (pH 8) overnight. After the reactions were complete, the modified microspheres were washed with ultrapure water five times.
Thrombin binding assay
As for the single-stranded aptamer-modified microspheres (ssTBA), the assay buffer contained 100 mM KCl, 1 mM MgCl2, and 20 mM Tris HCl, and its pH was adjusted to 8.0. ssTBA microspheres (0.1 mg) were incubated in the assay buffer for 10 min to induce the formation of the G-quadruplex structure of TBA. Subsequently, a 100 nM solution of dye-labeled thrombin was added, and the suspension was stirred for 1 h at room temperature. For the control experiment, the same procedure was carried out using microspheres coated with complementary TBA strands (NH2-com in Table S1†).For the double-stranded aptamer-modified microspheres (dsTBA), microspheres (0.1 mg) were incubated in the assay buffer for 10 min. Subsequently, 1–1000 nM thrombin solutions were added to the dsTBA suspension, followed by 1 h stirring at 37 °C (total volume = 100 μL). In order to remove dissociated dye-labeled single strands, the dsTBA suspension was centrifuged, and the pellet was washed with assay buffer, followed by microscopic characterization. Simultaneously, the supernatant fluorescence intensity was measured to confirm the thrombin-induced dissociation of the DNA double strand. The control experiment was performed with BSA as the target protein using the same procedure. Power dependence tests were performed using microspheres exhibiting facile dissociation of fluorophore-labeled dsTBA, since the extent of fluorescence intensity decrease upon thrombin binding was rather varied among different particles.
Microscopy
Glass microsphere fluorescence images and spectra were taken using an objective-scanning confocal microscope (PicoQuant, MicroTime 200) coupled with an Olympus IX71 inverted fluorescence microscope. Typically, 70 μL of microsphere-containing aqueous solution was loaded into a micro-chamber created by a one-inch glass cover slip and a Secure-Seal spacer (S24733, Invitrogen), with excitation performed through an oil objective (Olympus, UP-lanSAPo 100×/1.40 Oil/0.17/FN26.5) with 405 nm (Spectra-Physics, Mai TAi HTS-W with an automated frequency doubler, Inspire Blue FAST-W; 0.8 MHz repetition rate) or 640 nm (PicoQuant, full width at half-maximum 120 ps) pulsed lasers controlled by a PDL-800B driver (PicoQuant). Emission radiation was collected using the same objective and detected by a single-photon avalanche photodiode (Micro Photon Devices, PDM 50CT) after passing through an appropriate dichroic beamsplitter, bandpass filter, and a 75 μm pinhole for spatial filtering to reject out-of-focus signals. Data collected using the PicoHarp 300 TCSPC module (PicoQuant) were stored in time-tagged time-resolved mode, with every detected photon recorded with its individual timing. All experimental data were obtained at room temperature. Moreover, only emission radiation that passed through a slit entered the imaging spectrograph (Acton Research, SP-2356) equipped with an electron-multiplying charge-coupled device (EMCCD) camera (Princeton Instruments, ProEM).Real-time fluorescence images were obtained using an Olympus IX81 inverted fluorescence microscope and a 488 nm CW laser (Coherent) to excite dye-labeled glass microspheres. The excitation power (13, 1300, and 3200 μW) was adjusted by adding ND filters. As in confocal microscopy, the sample solution in the micro-chamber was excited through an oil objective (Olympus, PlanApo 100×/1.40 Oil), with the emission image collected using the same objective and recorded by an EMCCD camera (Roper Scientific, Evolve 512) equipped with an appropriate dichroic beamsplitter and bandpass filter. Fluorescence images were analyzed by OriginPro 9.1 (OriginLab) and ImageJ software.
Results and discussion
Glass microsphere modification for fluorescence amplification
Soda lime spheres were used as biocompatible cavities for intracellular lasing due to exhibiting a suitable refractive index (n = 1.52 and 1.37 for glass spheres and cytosol, respectively) and low cytotoxicity.9 The microspheres were modified with 3-aminopropyltriethoxysilane (APTES) and 1,4-phenylene diisothiocyanate (PDC) to graft amine-reactive isothiocyanate groups on the glass surface25,26 for the subsequent attachment of fluorescent dyes or dye-labeled DNA oligomers bearing free amino groups (Scheme 1). Each modification step was controlled by Fourier transform infrared spectroscopy, X-ray photoelectron spectroscopy, ninhydrin assaying, and labeling with a single-stranded Cy5 oligomer (Fig. S2–S5†). Alexa Fluor 488 (A488) and boron-dipyrromethene (BODIPY) were used as green fluorophores due to their photostability and high fluorescence quantum yields (>0.9).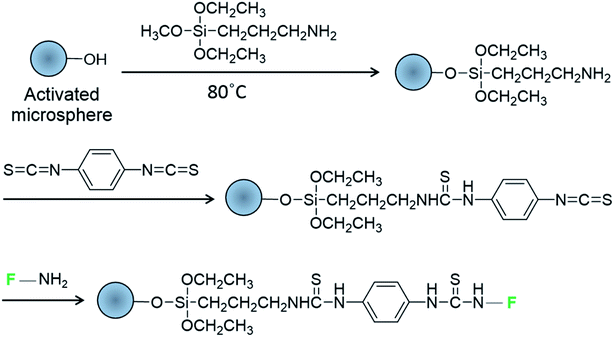 | ||
| Scheme 1 Modification of glass microspheres with fluorophore-labeled DNA oligomers (F) bearing amine groups. | ||
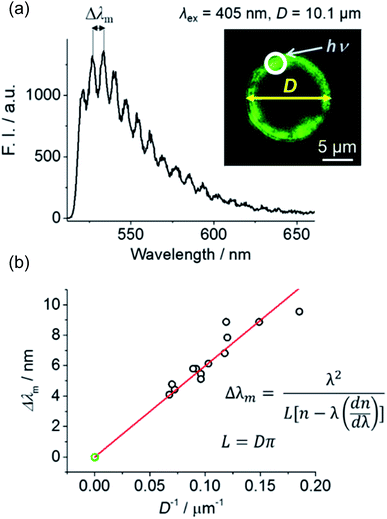
A488-doped microspheres were prepared to verify whether the chosen glass microspheres and the passivation method were suitable for WGM lasing. An aqueous suspension of A488-labeled microspheres was loaded into a micro-chamber, and the circumference of these spheres was excited using a 405 nm pulsed laser coupled with a confocal microscope (Fig. 2a, inset). The corresponding fluorescence spectrum was monitored using a spectrograph and EMCCD camera. At the maximum excitation power of our instrument (∼1 mW, pulse energy ≈ 1.25 pJ), the smooth fluorescence spectrum of A488 became spiked (Fig. 2a), indicating the occurrence of amplified stimulated emission due to WGM resonance.
The spacing between adjacent peaks in WGM lasing spectra (Δλm) is known to be inversely proportional to the diameter of the resonator (Δλm = λ2/(L[n − λ(dn/dλ)]), L = Dπ, where λ, L, and D denote the excitation wavelength, and the circumference and diameter of the spherical cavity, respectively).14 Fig. 2b shows that a good linear correlation was observed between reciprocal microsphere diameter and Δλm, confirming that the prepared fluorophore-doped glass microspheres can successfully act as WGM cavities. Preliminary testing was performed using polystyrene beads surface-labeled with a fluorophore. Although these beads have been successfully utilized as WGM resonators previously,7,9 we found them to exhibit strong Raman scattering rather than fluorescence amplification (Fig. S6†). Thus, micro-sized glass microspheres seemed to be more suitable as cavities of an aptamer-doped WGM sensor, wherein fluorophore doping was limited to the sensor surface.
Glass microspheric sensor with single-stranded aptamer
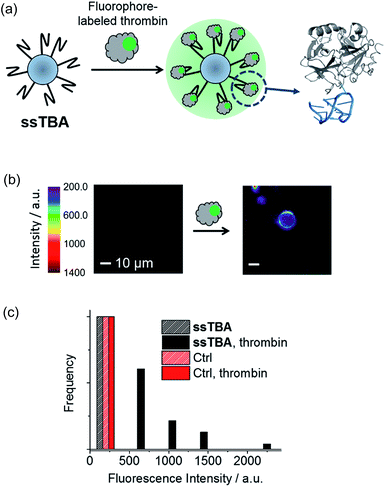
As shown in Fig. 3a and 4a, we designed two kinds of DNA aptamer-modified glass microspheres (1–38 μm) for the detection of thrombin, an important protein involved in blood coagulation. The G-quadruplex structure of a guanine-rich thrombin-binding aptamer (TBA) formed in the presence of potassium ions (right, Fig. 3a) can selectively recognize thrombin (Kd ≈ 200 nM).19,27,28 First, a turn-on sensor (ssTBA) was constructed by coating the microsphere surface with an amino-functionalized single-stranded TBA (Fig. 3a). Fluorophore-labeled thrombin can bind to the TBA-coated surface of microspheres, increasing the fluorophore density on the microsphere surface and may trigger fluorescence amplification through WGM lasing. Fluorophore-labeled thrombin was prepared by connecting BODIPY bearing a N-hydroxysuccinimide (NHS) ester group to the amino residues of thrombin.Using a single-particle fluorescence microscopy, fluorescence intensities of a single microsphere were observed. In the presence of thrombin, ssTBA showed a vivid fluorescence increase around a microsphere, while microspheres coated with TBA-complementary strands (Table S1†) were found to be insensitive to thrombin (Fig. 3b and c). Although these results suggested that ssTBA is a good turn-on sensor for thrombin detection, no abrupt fluorescence increase with increasing pump power was observed.
Increasing the density of fluorophores around microspheres is considered to be essential for realizing fluorescence amplification sensors based on aptamer doping. Thus, the intrinsic volume of thrombin was expected to prevent the arrangement of a sufficient number of fluorophores around ssTBA for WGM lasing, which encouraged us to design another microsphere sensor with a different working mechanism.
Glass microspheric sensor with double-stranded aptamer
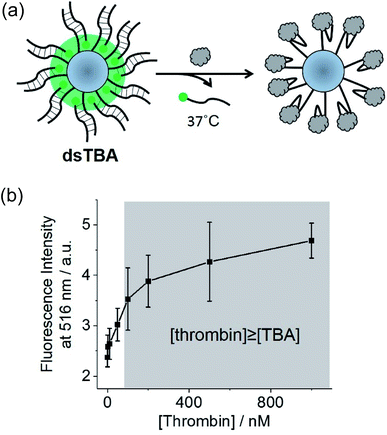
Herein, the less sterically demanding microsphere-attached DNA strands were labeled with fluorophore moieties (diameters of thrombin and the DNA double helix equal ∼4.1 and 2.0 nm, respectively). Thus, the release of fluorophore-labeled DNA strands from the cavity upon thrombin binding was used to design a turn-off sensor realizing fluorescence amplification (dsTBA, Fig. 4a). As compared to ssTBA, dsTBA does not necessitate a pretreatment of the target such as fluorophore labeling, hence, this approach is more advantageous in a practical application.In dsTBA, fluorophores were densely distributed around the microsphere, leading to a strong fluorescence signal. Upon the addition of thrombin, fluorophore-labeled complementary strands of TBA dissociated from the microsphere and subsequently bound to thrombin. Based on melting temperature and CD measurements (Fig. S8 and S9,† respectively), all experiments with dsTBA were performed at 37 °C to facilitate the dissociation of DNA double strands. To confirm that the above fluorescence decrease was induced by thrombin binding and not by spontaneous dissociation of the DNA double strand, the corresponding fluorescence intensities were monitored in the presence of various concentrations of thrombin (Fig. 4b). In these experiments, suspensions of dsTBA in thrombin solutions of desired concentrations were incubated at 37 °C for 1 h and centrifuged, affording a supernatant containing fluorophore-labeled DNA single strands dissociated from microspheres and thus indirectly indicating the extent of thrombin binding (Fig. 4a). The supernatant fluorescence intensities increased with increasing thrombin levels (Fig. 4b), indirectly indicating the extent of thrombin binding. As a result, a linear increase in supernatant fluorescence intensity was monitored up to 100 nM thrombin (Fig. 4b). From the measurements of supernatants containing Cy5-15mer (Table S1†) obtained before and after the microsphere labeling (1 h), the approximate labeling efficiency to PDC-modified microsphere was found to be 6.6 × 10⁻¹¹ mol mg−1. Thus, approximately 66 nM thrombin can bind to 0.1 mg dsTBA microsphere at least (shaded in grey, Fig. 4b). In accordance with our hypothesis, the fluorescence intensity of supernatant becomes constant over 100 nM thrombin. From this result, we confirmed that dsTBA can be used for the quantitative thrombin recognition.
Amplification of fluorescence signal contrast
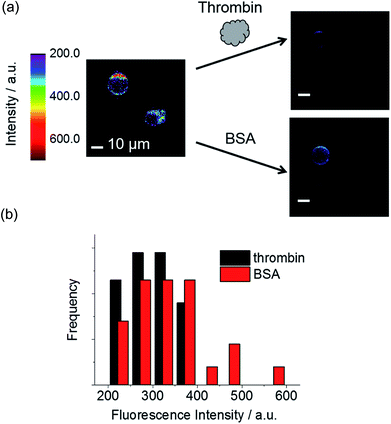
Next, we performed fluorescence microscopy imaging of a single dsTBA in the presence of thrombin and the control protein (bovine serum albumin, BSA). While the circumferences of all microspheres initially showed strong fluorescence signals because of a dense labeling of fluorophore-labeled aptamer strands (left, Fig. 5a), the addition of thrombin mostly resulted in dim microsphere fluorescence (right, Fig. 5a). On the other hand, BSA did not induce a dramatic fluorescence decrease of dsTBA.Furthermore, we investigated the influence of excitation power on signal contrast. As shown in Fig. 6, differences of dsTBA fluorescence intensities for various thrombin concentrations increased with increasing excitation power, e.g., taking the fluorescence contrast in the absence/presence of 1000 nM thrombin at 13 μW as the standard, 4.1- and 29-fold higher values were measured at 1300 and 3400 μW, respectively. The non-linear dependence of the intensity difference on power revealed that contrast enhancement originated from the amplification of dsTBA fluorescence in the absence of thrombin. Interestingly, a sudden fluorescence intensity decrease was observed at thrombin levels between 10 and 100 nM (Fig. 6). Considering the amount of aptamers on the glass microsphere (∼6.6 × 10⁻¹¹ mol mg−1), a thrombin concentration above 66 nM was required to release most fluorophore-labeled DNA single strands (0.1 mg dsTBA was suspended in 100 μL of analyte solution in this test). Thus, the dramatic difference observed for levels of 10 and 100 nM was in good agreement with the above calculation. In other words, controlled doping of the glass cavity allows dsTBA to be used as a quantitative sensor to determine whether the target analyte concentration exceeds a certain value.
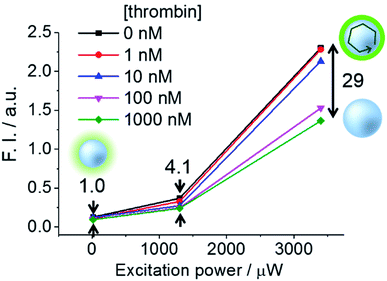 | ||
| Fig. 6 Signal contrasts of dsTBA at different thrombin concentrations and pump intensities, with the value obtained at a pump intensity of 13 μW taken as unity. | ||
Conclusion
In summary, we demonstrated a new fluorescence sensor type based on fluorescence amplification in a spherical cavity. By constructing two types of fluorescence microsphere sensors (ssTBA and dsTBA), dense doping of fluorophores on the microsphere surface was found to be the most important factor to induce fluorescence amplification. In general, the turn-on type is more advantageous as a fluorescence sensor, considering a detection sensitivity and signal contrast. ssTBA can work even at room to physiological temperatures and does not need an additional separation process after adding fluorophore-labeled targets. However, we finally found that the density of fluorophore of ssTBA is not enough to trigger lasing or amplified stimulated emission regardless of the introduced concentration of fluorophore-labeled thrombin.On the other hands, the excitation-power-dependent signal contrast of dsTBA was much larger than that of ssTBA although dsTBA necessitates magnetic stirring at elevated temperatures. Even though a 29-fold contrast enhancement was achieved in this study, the use of stronger excitation sources (e.g., nanosecond pulsed lasers with μJ pulse energies) and better doping methods is expected to evoke intense WGM lasing.
Our results clearly suggest that glass microspheres are good and highly versatile WGM resonators that can be coated with various fluorophores, aptamers, and any host/guest molecules bearing reactive functional groups. Importantly, glass microspheres are safe and easy to introduce into living organisms, thus being suitable for in vivo applications. Furthermore, the described sensing approach features simple sample preparation and is time-saving, providing results after several strong pump pulses. In future, not only fluorophore-labeled aptamers, but many conventional fluorescence probes can be also applied to this sensor design to realize all-or-none type sensors with extremely high fluorescence contrast.
Conflicts of interest
There are no conflicts to declare.Acknowledgements
This work was partly supported by a Grant-in-Aid for Scientific Research (Project 25220806, 16K13931, and others) from the Ministry of Education, Culture, Sports, Science, and Technology (MEXT) of the Japanese Government.References
- L. Petrizza, M. Collot, L. Richert, Y. Mely, L. Prodi and A. S. Klymchenko, RSC Adv., 2016, 6, 104164–104172 RSC.
- X. Feng, T. Zhang, J.-T. Liu, J.-Y. Miao and B.-X. Zhao, Chem. Commun., 2016, 52, 3131–3134 RSC.
- A. J. C. Kuehne and M. C. Gather, Chem. Rev., 2016, 116, 12823–12864 CrossRef PubMed.
- M. D. Baaske, M. R. Foreman and F. Vollmer, Nat. Nanotechnol., 2014, 9, 933–939 CrossRef PubMed.
- Y. Zhi, X. C. Yu, Q. Gong, L. Yang and Y. F. Xiao, Adv. Mater., 2017, 29, 1604920 CrossRef PubMed.
- T. Reynolds, N. Riesen, A. Meldrum, X. Fan, M. M. Hall Jonathan, M. Monro Tanya and A. François, Laser Photonics Rev., 2017, 11, 1600265 CrossRef.
- Z. Gao, C. Wei, Y. Yan, W. Zhang, H. Dong, J. Zhao, J. Yi, C. Zhang, Y. J. Li and Y. S. Zhao, Adv. Mater., 2017, 29, 1701558 CrossRef PubMed.
- M. Gao, C. Wei, X. Lin, Y. Liu, F. Hu and Y. S. Zhao, Chem. Commun., 2017, 53, 3102–3105 RSC.
- M. Humar and S.-H. Yun, Nat. Photonics, 2015, 9, 572–576 CrossRef PubMed.
- M. Schubert, A. Steude, P. Liehm, N. M. Kronenberg, M. Karl, E. C. Campbell, S. J. Powis and M. C. Gather, Nano Lett., 2015, 15, 5647–5652 CrossRef PubMed.
- Q. Chen, M. Ritt, S. Sivaramakrishnan, Y. Sun and X. Fan, Lab Chip, 2014, 14, 4590–4595 RSC.
- Y. Sun and X. Fan, Angew. Chem., Int. Ed., 2012, 51, 1236–1239 CrossRef PubMed.
- X. Fan and S.-H. Yun, Nat. Methods, 2014, 11, 141 CrossRef PubMed.
- X. Wang, Q. Liao, H. Li, S. Bai, Y. Wu, X. Lu, H. Hu, Q. Shi and H. Fu, J. Am. Chem. Soc., 2015, 137, 9289–9295 CrossRef PubMed.
- X. Wang, Q. Liao, Q. Kong, Y. Zhang, Z. Xu, X. Lu and H. Fu, Angew. Chem., Int. Ed., 2014, 126, 5973–5977 CrossRef.
- J. Liu, Z. Cao and Y. Lu, Chem. Rev., 2009, 109, 1948–1998 CrossRef PubMed.
- F. Hu, Y. Huang, G. Zhang, R. Zhao, H. Yang and D. Zhang, Anal. Chem., 2014, 86, 7987–7995 CrossRef PubMed.
- B.-R. Li, Y.-J. Hsieh, Y.-X. Chen, Y.-T. Chung, C.-Y. Pan and Y.-T. Chen, J. Am. Chem. Soc., 2013, 135, 16034–16037 CrossRef PubMed.
- L. Zhou, J. Ren and X. Qu, Mater. Today, 2017, 20, 179–190 CrossRef.
- P. Wu, Y. Gao, H. Zhang and C. Cai, Anal. Chem., 2012, 84, 7692–7699 CrossRef PubMed.
- H. Li, C.-Y. Chen, X. Wei, W. Qiang, Z. Li, Q. Cheng and D. Xu, Anal. Chem., 2012, 84, 8656–8662 CrossRef PubMed.
- X. Lin, A. P. Ivanov and J. B. Edel, Chem. Sci., 2017, 8, 3905–3912 RSC.
- G. Nunzi Conti, S. Berneschi and S. Soria, Biosensors, 2016, 6, 28 CrossRef PubMed.
- H. Zhu, J. D. Suter, I. M. White and X. Fan, Sensors, 2006, 6, 785–795 CrossRef.
- M. K. Walsh, X. Wang and B. C. Weimer, J. Biochem. Biophys. Methods, 2001, 47, 221–231 CrossRef PubMed.
- H. Sheng and B. C. Ye, Appl. Biochem. Biotechnol., 2009, 152, 54–65 CrossRef PubMed.
- M. Berezovski, R. Nutiu, Y. Li and S. N. Krylov, Anal. Chem., 2003, 75, 1382–1386 CrossRef PubMed.
- J. Choi and T. Majima, Chem. Soc. Rev., 2011, 40, 5893–5909 RSC.
Footnotes |
| † Electronic supplementary information (ESI) available: Additional information (Table S1, Fig. S1–S9) as noted in the text. See DOI: 10.1039/c8ra03192d |
| ‡ Present address: Laboratory for Cell System Control, Center for Biosystem Dynamics Research, RIKEN, 6-2-3 Furuedai, Suita, Osaka, 565-0874 (Japan). |
| This journal is © The Royal Society of Chemistry 2018 |

