 Open Access Article
On preparing highly abrasion resistant binderless and in situ N-doped granular activated carbon†
Zhenghan Caia,
Xuan Yanga,
Guanfeng Linb,
Cuixia Chena,
Yandan Chen*a and
Biao Huang *a
*a
aMaterials Engineering College, Fujian Agriculture and Forestry University, Fuzhou 350002, China
bJinshan College, Fujian Agriculture and Forestry University, Fuzhou 350002, China. E-mail: fjaucyd@163.com; bhuang@fafu.edu.cn; Fax: +86 591 83715175; Fax: +86 591 85715175; Tel: +86 591 83715175 Tel: +86 591 88160598
First published on 4th June 2018
Abstract
NaOH/urea, a cellulose solvent, has been applied for the preparation of binderless and in situ N-doped GACs (NaOH/urea-GACs). The dissolved cellulose binds lignin, hemicellulose and undissolved cellulose all together to form a granular precursor after kneading and extruding. During the process, NaOH and urea are dispersed in sawdust where the NaOH acts as an activator at high temperatures, and the urea plays the role of an in situ N-dopant. The results show that at a mass concentration ratio of 14 wt% NaOH/24 wt% urea which has been activated for 1 h at 850 °C after kneading for 2 h GACs with a specific surface area (SBET) of 811.299 m2 g−1, a microporosity of 59.20% and an abrasion resistance of 99.83% are obtained. The N content as well as its form of existence are also further explored. The desulfurization ability of the NaOH/urea-GACs is also investigated, and NaOH/urea-GACs, without removed alkali, are applied for desulfurization, and the adsorption process is appropriate for the Bangham model. The experimental results indicate that it is feasible to use an NaOH/urea solvent as a suitable chemical for the manufacture of GACs with good properties.
1. Introduction
GACs are widely used without producing secondary pollution in various fields such as wastewater treatment,1 gas purification2 and immobilized catalysis.3 Along with the deterioration of the environment and economic development, the demand for GACs is increasing. Therefore, it is necessary to explore new ways of preparing GACs. At present, the methods of GAC preparation can be divided into physical methods and chemical methods. The physical methods are mainly used to prepare GACs from the raw material of shells, for example coconut shell GACs.4 The chemical methods can be further divided into a binder method or a binderless method. The binder method is mainly used with powder activated carbon to form granules with a binder, but this method reduces the original surface area of the powder activated carbon. The binderless method is mainly used to form granules from precursors and then GACs are obtained after activation; this is a simple and effective way to prepare GACs. Various chemical reagents have been used in this method by many researchers, such as H3PO4,5 ZnCl2,6 KOH,7 and K2CO3.8 Molina-Sabio et al.9 described the preparation of activated carbon discs without a binder by using H3PO4 as an activating agent. J. M. et al.10 reported a method for the preparation of binderless activated carbon monoliths (ACM) by asphalt. Farma et al.11 used the fibres from the empty fruit bunches of oil palm to produce ACM by high pressure. Silvestre-Albero et al.12 depicted the preparation of ACM with high pressure and asphalt that had been activated into powdered activated carbon with KOH.Nitrogen-containing functional groups make activated carbon more widely applicable for energy storage. So far, nitrogen-containing activated carbon is mainly obtained by reactions with nitrogen-containing reagents, such as HNO3 and NH3,13,14 and the carbonization/activation of N-rich precursors.15,16 However, few studies report functional binderless-GACs with in situ N-doping. Solvents17 for the dissolution of cellulose such as NaOH/urea, NaOH/thiourea and LiOH/urea aqueous solution, pre-cooled to low temperatures, provide a good way to prepare binderless-GACs with high abrasion resistance and in situ N-doping.
In this work, GACs from sawdust were impregnated with an NaOH/urea solution. The dissolved cellulose binds lignin, hemicellulose and undissolved cellulose all together to form a granular precursor after kneading and extruding. In this process, NaOH and urea are dispersed into the sawdust, where the NaOH acts as an activator at high temperatures, and the urea plays the role of an in situ N-dopant. The experimental results indicate that it is feasible to use an NaOH/urea solvent as a suitable chemical for the manufacture of GACs with good properties.
2. Experimental
2.1 Materials
Sawdust collected from Fujian Province, China, was first removed of any impurities and air dried, then it was crushed and sieved to give particle sizes of 0.18–0.25 mm for subsequent studies. Sodium hydrate, urea, sodium thiosulfate, potassium dichromate, vitriol, iodine, potassium iodine, methylene blue, soluble starch, hydrochloric acid, disodium hydrogen phosphate, monopotassium phosphate and other analytical reagents were purchased from the Shanghai Sinopharm Chemical Reagent Company Ltd and all were of analytical grade.2.2 Preparation of the NaOH/urea solvents
Based on the preparation of a cellulose dissolving system invented by Lina Zhang17,18 The mass ratio varied between 7 wt% NaOH/12 wt% urea and 21 wt% NaOH/12 wt% urea. 14–42 g of NaOH and 24–48 g of urea were dissolved in distilled water while stirring to obtain a 150 g aqueous solution and pre-cooled to −12–0 °C for later use.2.3 Preparation of the GACs
Sawdust (50 g) between 0.18 and 0.25 mm in size was added to the NaOH/urea solution (150 g) which had been pre-cooled to −12–0 °C. The mixtures were kneaded at room temperature for 1–3 h and subsequently columnar material was extruded, then dried at 105 °C. During the activation process, the solidified sample was heated up to the final temperature (550–650–750–850–950 °C) and maintained for 30–45–60–75–90 min. The activated samples were boiled with 10 wt% industrial hydrochloric acid solution for 30 min. Further washing was finished with hot distilled water until the pH value was almost neutral. Finally, the products were dried at 105 °C for 8 h for further characterization studies.2.4 Physical and chemical characterization
The iodine number and the methylene blue adsorption value of the GACs were obtained in accordance with GB/T 12496 – 1999 (National Standards of P. R. C). Abrasion resistance was obtained on the basis of GB/T 13803.1 – 1999.Textural characteristics were determined by nitrogen adsorption at −196 °C with an automatic adsorption instrument (ASAP 2020 HD88, Micromeritic). The surface area of the sample was calculated by Brunauer–Emmett–Teller (BET) analysis in a relative pressure range of 0.05–0.30 at −196.15 °C. The micropore volume was determined according to the HK (Horvath–Kawazoe) method.
Surface morphologies were observed by field emission scanning electron microscopy (FSEM). FSEM images were obtained with a NovaNano SEM 230. The Raman spectra were recorded with a Renishaw inVia at a wavelength of 514 nm with a power of 25 mW by laser operation.
The surface functional groups and structure were studied by Fourier transform infrared spectroscopy (FT-IR) with a Nicolet 380. An Elementar Vario EL cube microanalyzer was applied for elemental analysis (EA: C, H, O and N). X-ray photoelectron spectroscopy (XPS) was carried out with a Thermo Scientific Escalab 250Xi.
The pH of the sample was determined according to GB/T 12496.7 – 1999. Briefly, 2.5 g of undried sample was weighed into a 100 mL conical flask with 50 mL carbon dioxide–free water. The conical flask was heated to boiling for 5 min. Then, it was cooled to room temperature and the evaporated water was replenished. Then the pH value was measured.
A sulfur dioxide absorption detector (Shenzhen Korno Electronic Technology, GT901-SO2) was used for desulfurization analysis by measuring the SO2 content of the reaction bed export at different times.
2.5 Desulfurization experiment
GACs without removed alkali were used in the desulfurization experiment. SO2 removal was carried out at 90–95 °C in a fixed bed with a quartz glass tube and a temperature controller (Φ 2.5 cm × 60 cm). GACs for desulfurization loading were 6 cm in height and 15.7 g, with ordinary GACs as the control group. SO2 removal was conducted by passing a simulated flue gas comprising N2 and 0.5% SO2. The gas space velocity (SV) was 160 mL min−1. Finally, the flue gas was sent through the NaOH solution after the reactor. The desulfurization efficiency was studied by determining the SO2 content of the reaction bed export.3. Results and discussion
3.1 The preparation of NaOH/urea-GACs
The main factors in the preparation of NaOH/urea-GACs which included the NaOH/urea mass concentration ratio, the kneading time, the activation temperature and the activation time were investigated by a single factor experiment as shown in Fig. S1, S2, S3 and S4,† respectively. The NaOH/urea mass concentration ratio (X1), the activation temperature (X2) and the activation time (X3), as critical variables for the preparation of the NaOH/urea-GACs, were analyzed by RSA to optimize the entire preparation process. Subsequently, optimal results were obtained (Tables S1 and S2†) based on the iodine value. Experimental data were fit and predicted with a second order model. Analysis of variance (ANOVA) was applied to analyze the experimental data at a 95% confidence interval (Tables S3 and S4†). Clearly, the model is significant, efficienct, appropriate and valid with a very low value of lack of fits value (p = 0.0588).19 Empirical relationships between variables and responses were expressed by the following equations:| Y = 882.48 + 20.17X1 + 35.70X2 + 27.54X3 − 5.03X1X2 + 9.13X1X3 + 10.92X2X3 − 37.14X12 − 27.20X22 − 16.09X32 | (1) |
Optimization of the variables to maximize the iodine value was finished by the quadratic model as shown in Fig. 1. Experimental results show that the produced carbons are of high abrasion resistance, all more than 97%. The conditions for a high abrasion resistance (>97.00%) with a better adsorption performance are 14 wt%/24 wt%, 2 h, 850 °C, and 60 min for the alkali urea ratio, the kneading time, the activation temperature and the activation time, respectively. The NaOH/urea-GACs were obtained with a high iodine value up to 861.24 mg g−1, a high methylene blue value up to 130.5 mg g−1, and a high surface area up to 811.299 m2 g−1.
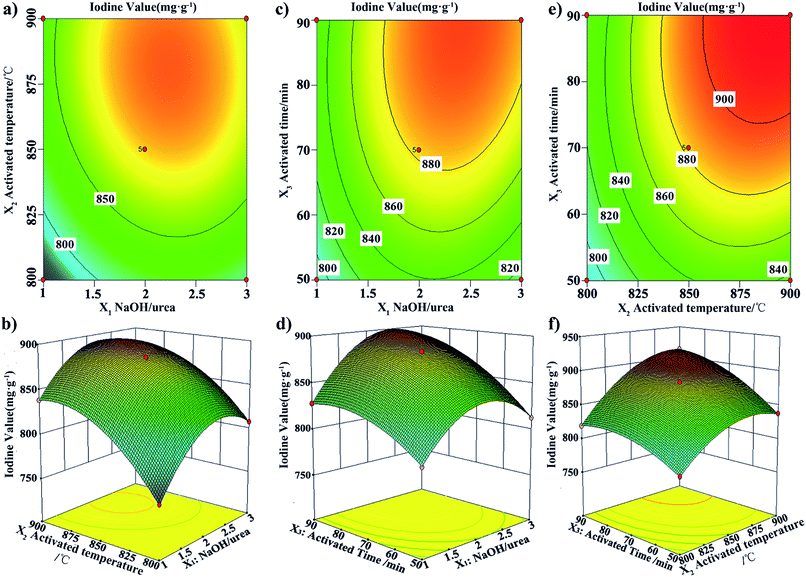 | ||
| Fig. 1 RSA for the Box–Behnken Design (BBD): (a) and (b) NaOH/urea-activation temperature; (c) and (d) NaOH/urea-activation time; (e) and (f) activation temperature-activation time. | ||
These results revealed the feasibility of using an NaOH/urea solvent as a suitable chemical for the manufacture of GACs with a good adsorption capacity and mechanical strength.
3.2 Chemical and structural characteristics of the NaOH/urea-GACs
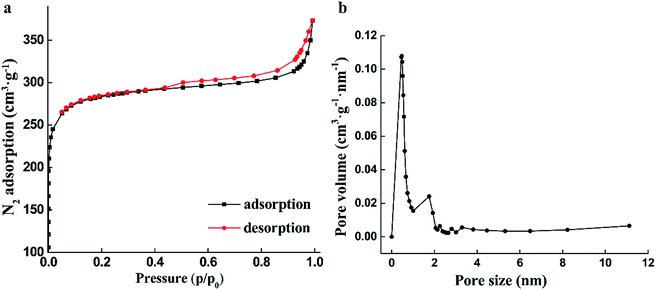
The nitrogen adsorption/desorption isotherm curve and the pore size distribution for the GACs, prepared under 14 wt%/24 wt%, 2 h, 850 °C, and 60 min, are shown in Fig. 2a and b, respectively.According to IUPAC, Fig. 2a shows the obtained isotherm curve belonging to a type I isotherm. At low pressures (P/P0 < 1), it shows an exponential increase, until it approaches a certain relative pressure. Additionally, the obvious desorption hysteresis loop is presented at intermediate and high relative pressures, which represents dense micropore structures. The adsorption isotherm of this material shows a good agreement with those reported in the literature.20
The Brunauer–Emmett–Teller surface area evaluated by the nitrogen adsorption isotherm corresponds to a value of 811.299 m2 g−1 for the produced GACs by NaOH/urea as shown in Table 1. The pore size distribution calculated by the standard BJH method appears in Fig. 2b. The volume distribution shows that the main part of the GAC pore diameter is in the range of 0.45–3.5 nm, with an average diameter of 2.74 nm. The single point of BJH adsorption total pore volume and micropore volume is found to be 0.5554 cm3 g−1 and 0.3282 cm3 g−1, respectively. Fig. 2b shows that most of the GAC pores are in the microporous range, with as much as 59.20%. In conclusion, the prepared GACs can be said to have both microporous and mesoporous structures, but it is mainly a microporous material.
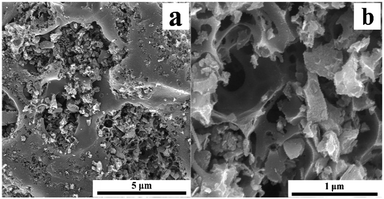
Scanning electron microscopy (SEM) techniques were used to observe the surface physical morphology of ordinary GACs and NaOH/urea-GACs as shown in Fig. 3. SEM images (a and b) indicate the pore structures of the NaOH/urea-GACs as a result of activation. As indicated, the NaOH/urea-GACs obtained an abundant specific surface area in the activation process. Thanks to the well-developed pores, the GACs possessed a high BET surface area and adsorption capacity. Raman spectra of the GACs at different ratios of NaOH/urea are shown in Fig. S5.† There are two major peaks, D (∼1345 cm−1) and G (∼1587 cm−1) bands, used to characterize the degree of disorder in ACs at a ratio of area ID/IG.21 The ID/IG value of NaOH/urea-GACs is 1.022, 1.020 and 1.005 for 14![[thin space (1/6-em)]](https://www.rsc.org/images/entities/char_2009.gif) :
:![[thin space (1/6-em)]](https://www.rsc.org/images/entities/char_2009.gif) 12, 14
12, 14![[thin space (1/6-em)]](https://www.rsc.org/images/entities/char_2009.gif) :
:![[thin space (1/6-em)]](https://www.rsc.org/images/entities/char_2009.gif) 24 and 21
24 and 21![[thin space (1/6-em)]](https://www.rsc.org/images/entities/char_2009.gif) :
:![[thin space (1/6-em)]](https://www.rsc.org/images/entities/char_2009.gif) 12, respectively. It is similar to other ACs activated with NaOH–KOH.22
12, respectively. It is similar to other ACs activated with NaOH–KOH.22
The capacity of GACs depends upon the porosity as well as the chemical reactivity of the functional groups at the surface. EA, XPS and FT-IR were applied to analyze the chemical performance of the NaOH/urea-GACs.
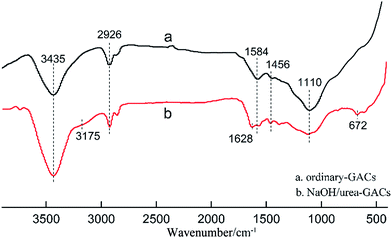
The FT-IR spectra of the GACs prepared without (Fig. 4a) and with (Fig. 4b) the addition of NaOH/urea are illustrated in Fig. 4. In general, the spectrum lines all contain several basic peaks. A strong and wide adsorption peak around 3435 cm−1 can be assigned to O–H stretching vibrations, typical peaks at 2926 and 2854 cm−1 are attributed to stretching of aliphatic bands in –CH3 and –CH2, the peak around 1600 cm−1 [1584 cm−1 (a) or 1628 cm−1 (b)] is related to C![[double bond, length as m-dash]](https://www.rsc.org/images/entities/char_e001.gif) O stretching vibrations of carbonyl groups,23,24 and a small peak around 1456 cm−1 is attributed to a C–H scissor vibration.25 The peak which weakens in NaOH/urea-GACs at 1110 cm−1 belongs to a C–O stretching vibration. However, as shown in Fig. 4b, preparation with an NaOH/urea system causes some changes in the spectra of NaOH/urea-GACs. Therefore, some peaks that may be related to N-containing groups could be observed in NaOH/urea-GAC spectra. Firstly, a small peak that appears around 3175 cm−1 more likely belongs to N–H.24 The obvious peaks around 1550 and 672 cm−1 correspond to the N–H in-plane bending vibrations25 and bonding vibrations,24 respectively.
O stretching vibrations of carbonyl groups,23,24 and a small peak around 1456 cm−1 is attributed to a C–H scissor vibration.25 The peak which weakens in NaOH/urea-GACs at 1110 cm−1 belongs to a C–O stretching vibration. However, as shown in Fig. 4b, preparation with an NaOH/urea system causes some changes in the spectra of NaOH/urea-GACs. Therefore, some peaks that may be related to N-containing groups could be observed in NaOH/urea-GAC spectra. Firstly, a small peak that appears around 3175 cm−1 more likely belongs to N–H.24 The obvious peaks around 1550 and 672 cm−1 correspond to the N–H in-plane bending vibrations25 and bonding vibrations,24 respectively.
To verify the presence of nitrides in the NaOH/urea-GACs, the samples were analyzed by EA. Thus, the C, H, O and N content of GACs with different NaOH/urea ratios, and ordinary-GACs are shown in Table 2. It’s pretty obvious that the content of N and O in NaOH/urea ratio GACs is higher than in ordinary-GACs. When the NaOH/urea-GACs are prepared with 14% NaOH/24% urea, the content of N and O reaches the highest with this increase in urea. Compared to 14 wt% NaOH/12 wt% urea GACs and 14 wt% NaOH/24 wt% urea GACs, except for an increase in the nitrogen, the oxygen content also increases, which seems to indicate that the presence of urea contributes to the formation of oxygen-containing groups in this system. But increasing the alkali reduces the oxygen content obviously due to its dehydration.
| Elements | C/% | H/% | O/% | N/% | Others/% |
|---|---|---|---|---|---|
| Ordinary-GAC | 70.39 | 0.96 | 3.66 | 0 | 24.99 |
NaOH/urea 14![[thin space (1/6-em)]](https://www.rsc.org/images/entities/char_2009.gif) : :![[thin space (1/6-em)]](https://www.rsc.org/images/entities/char_2009.gif) 12 12 |
62.90 | 2.38 | 13.23 | 1.08 | 20.41 |
NaOH/urea 14![[thin space (1/6-em)]](https://www.rsc.org/images/entities/char_2009.gif) : :![[thin space (1/6-em)]](https://www.rsc.org/images/entities/char_2009.gif) 24 24 |
62.59 | 2.10 | 17.53 | 2.25 | 15.53 |
NaOH/urea 21![[thin space (1/6-em)]](https://www.rsc.org/images/entities/char_2009.gif) : :![[thin space (1/6-em)]](https://www.rsc.org/images/entities/char_2009.gif) 12 12 |
80.34 | 1.74 | 12.74 | 1.38 | 3.81 |
It is widely known that most oxygen-containing functional groups show acidic properties, and nitrogen-containing functional groups show basic properties.26,27 So it is necessary to measure the pH of the samples. The pH variation of the NaOH/urea-GACs with a change in the NaOH/urea ratios is as follows: 9.21, 6.67 and 8.87 for 14![[thin space (1/6-em)]](https://www.rsc.org/images/entities/char_2009.gif) :
:![[thin space (1/6-em)]](https://www.rsc.org/images/entities/char_2009.gif) 12, 14
12, 14![[thin space (1/6-em)]](https://www.rsc.org/images/entities/char_2009.gif) :
:![[thin space (1/6-em)]](https://www.rsc.org/images/entities/char_2009.gif) 24 and 21
24 and 21![[thin space (1/6-em)]](https://www.rsc.org/images/entities/char_2009.gif) :
:![[thin space (1/6-em)]](https://www.rsc.org/images/entities/char_2009.gif) 12, respectively. The change can be associated with changes in the N and O content. Such as for 14 wt% NaOH/24 wt% urea GACs, O increases more than N so the pH is lower than 7. Compared to the pH of ordinary-GACs (5.63) which are activated by equivalent NaOH, the alkalinity of the NaOH/urea-GAC surface is enhanced.
12, respectively. The change can be associated with changes in the N and O content. Such as for 14 wt% NaOH/24 wt% urea GACs, O increases more than N so the pH is lower than 7. Compared to the pH of ordinary-GACs (5.63) which are activated by equivalent NaOH, the alkalinity of the NaOH/urea-GAC surface is enhanced.
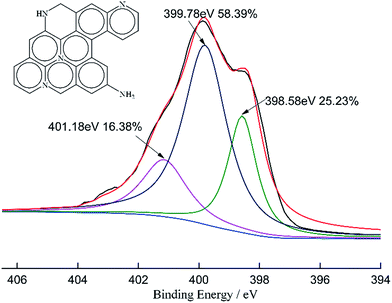
We further determine the form of N in the presence of NaOH/urea-GACs by XPS. The N1s peaks of 14% NaOH/24% urea-GACs are shown in Fig. 5. As previously reported, the surface state of N in AC analyzed by XPS is classified into pyridinic (N-6), pyrrolic/pyridone (N-5), amino/imino and graphitic nitrogen (N-Q) which have the values of around 398.1 eV, 400.5 eV, 399.8 eV and 401.3 eV, respectively.28–31 Pyrrole/pyridone (N-5) disappears due to activation at high temperatures while the graphitic nitrogen appears. Therefore, in NaOH/urea-GACs, nitrogen is present in mainly the pyridinic (N-6), amino/imino nitrogen and graphitic nitrogen (N-Q) forms .
In general, FT-IR, EA, pH and XPS analyses indicate that the surface alkaline functional groups of the GACs obtained by NaOH/urea activation are abundant with increasing nitrogen groups, and the alkalinity of the activated carbon surface is enhanced.
3.3 Desulfurization experiment
| q = [A × (C0 − Ct) × t]/(1000 × m) | (2) |
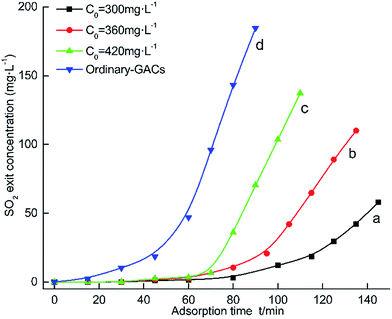 | ||
| Fig. 6 The breakthrough curve for desulfurization by ordinary GACs and NaOH/urea-GACs without removed alkali. | ||
Compared to the SO2 adsorption breakthrough curve shown in Fig. 6c, the SO2 adsorption breakthrough curve shown in Fig. 6d has a shorter through time and lower SO2 capacity, 61 min, 266 mg g−1 and 102 min, 339 mg g−1, respectively. Due to the remaining alkaline oxide, the GACs possess a very good desulfurization effect.
In Fig. 6(a–c), the tendency of the breakthrough curve is similar, which is to continue rising. As time passes, when the export concentration is the same as the initial concentration, the GACs have become saturated from adsorbing SO2.32 Furthermore, a, b and c through time and SO2 capacity are 345 mg g−1, 125 min; 339 mg g−1, 102 min; 315 mg g−1, 82 min, respectively.
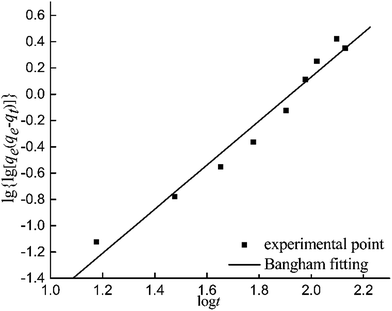
| qt = qe(1 − e−ktn) | (3) |
lg[lg(qe/(qe − qt))] = lg![[thin space (1/6-em)]](https://www.rsc.org/images/entities/char_2009.gif) k + n k + n![[thin space (1/6-em)]](https://www.rsc.org/images/entities/char_2009.gif) lg lg![[thin space (1/6-em)]](https://www.rsc.org/images/entities/char_2009.gif) t t
| (4) |
| k (min−n) | n | R2 | qe (mg g−1) | Experimental value qe (mg g−1) |
|---|---|---|---|---|
| 0.0006 | 1.6767 | 0.9680 | 344 | 345 |
As indicated in Table 3, the correlation coefficient of the Bangham model fitting R2 is 0.9680, which means that there is a good fit for the Bangham model. Therefore it is suitable to describe the adsorption process of SO2 on the surface of the GACs by the Bangham model.
Alkaline sodium salt remaining in the NaOH/urea-GACs, reacts with SO2 (the mechanism is as follows), which increases the absorption of SO2.
| Na2O + SO2(ad) → Na2SO3(ad) | (5) |
4. Conclusions
Highly abrasion resistant binderless and in situ N-doped GACs were prepared from sawdust with NaOH/urea solution. NaOH/urea was used as an assistant adhesion action agent and activating agent during the preparation process. It is very effective to prepare GACs with highly developed pores and excellent surface performance. Under optimal conditions, it resulted in NaOH/urea-GACs with iodine adsorption values of 861.24 mg g−1, a methylene blue value of 130.5 mg g−1, a special surface area of 811.299 m2 g−1 and an activation yield of 38–42%. The GACs were heteroporous with a micropore volume up to 59.20% and a total pore volume of 0.5554 cm3 g−1. The FTIR and XPS results indicate the presence of pyridinic, amino/imino nitrogen and graphitic nitrogen in the NaOH/urea-GACs. EA and pH analyses seem to indicate that the presence of urea contributes to the formation of oxygen-containing groups in this method. With their excellent properties, NaOH/urea-GACs can be effectively used as adsorbents for hazardous materials in the air and wastewater.Conflicts of interest
There are no conflicts to declare.Acknowledgements
The authors are grateful for the support from The National Key Research Program of China (Grant No. 2017YFD0601006), the National Natural Science Foundation of China (Grant No. 31770611), and the Scientific Research Program of Fujian Province (Grant No. 2017N5001).Notes and references
- K. A. Thompson, K. K. Shimabuku, J. P. Kearns, D. R. U. Knappe, R. S. Summers and S. M. Cook, Environ. Sci. Technol., 2016, 50, 11253–11262 CrossRef PubMed.
- A. Lanzini, H. Madi, V. Chiodo, D. Papurello, S. Maisano, M. Santarelli and J. V. Herle, Prog. Energy Combust. Sci., 2017, 61, 150–188 CrossRef.
- S. M. Kim, Y. K. Heo, K. T. Bae, Y. T. Oh, M. H. Lee and S. Y. Lee, Carbon, 2016, 101, 420–430 CrossRef.
- H. P. Zhang, L. Y. Ye and L. C. Yang, J. Xiamen Univ., Nat. Sci., 2004, 43, 833–835 Search PubMed.
- M. Hata, Y. Amano, M. Aikawa, M. Machida and F. Imazeki, Carbon, 2014, 72, 429 CrossRef.
- D. Angin, Fuel, 2014, 115, 804–811 CrossRef.
- M. Yu, J. Li and L. Wang, Chem. Eng. J., 2016, 310, 300–306 CrossRef.
- A. D. Roberts, J. S. M. Lee, S. Y. Wong, X. Li and H. Zhang, J. Mater. Chem. A, 2017, 5, 2811–2820 Search PubMed.
- M. Molina-Sabio, C. Almansa and F. RodríGuez-Reinoso, Carbon, 2003, 41, 2113–2119 CrossRef.
- J. M. Ramos-Fernández, M. Martínez-Escandell and F. Rodríguez-Reinoso, Carbon, 2008, 46, 384–386 CrossRef.
- R. Farma, M. Deraman, A. Awitdrus, I. A. Talib, E. Taer, N. H. Basri, J. G. Manjunatha, M. M. Ishak, B. N. M. Dollah and S. A. Hashmi, Bioresour. Technol., 2013, 132, 254–261 CrossRef PubMed.
- A. Silvestre-Albero, J. M. Ramos-Fernández, M. Martínez-Escandell, A. Sepúlveda-Escribano, J. Silvestre-Albero and F. Rodríguez-Reinoso, Carbon, 2010, 48, 548–556 CrossRef.
- G. Yang, H. Chen, H. Qin and Y. Feng, Appl. Surf. Sci., 2014, 293, 299–305 CrossRef.
- A. A. Adelodun, K. H. Kim, J. C. Ngila and J. Szulejko, Appl. Energy, 2015, 158, 631–642 CrossRef.
- D. Hulicova-Jurcakova, M. Seredych, Q. L. Gao and T. J. Bandosz, Adv. Funct. Mater., 2010, 19, 438–447 CrossRef.
- E. Raymundo-Piñero, D. Cazorla-Amorós and A. Linares-Solano, Carbon, 2003, 41, 1925–1932 CrossRef.
- L. N. Zhang, D. Ruan, H. P. Jin, J. P. Deng, J. P. Zhou and H. Chen, CN Pat., 200310111447.8, 2004.
- X. Luo and L. Zhang, Food Res. Int., 2013, 52, 387–400 CrossRef.
- F. N. Azad, M. Ghaedi, K. Dashtian, S. Hajati and V. Pezeshkpour, Ultrason. Sonochem., 2016, 31, 383–393 CrossRef PubMed.
- A. Omri, M. Benzina and N. Ammar, J. Ind. Eng. Chem., 2013, 19, 2092–2099 CrossRef.
- M. Sevilla, G. A. Ferrero and A. B. Fuertes, Carbon, 2017, 114, 50–58 CrossRef.
- D. Wang, G. Fang, T. Xue, J. Ma and G. Geng, J. Power Sources, 2016, 307, 401–409 CrossRef.
- G. Zhang, J. Qu, H. Liu, A. T. Cooper and R. Wu, Chemosphere, 2007, 68, 1058–1066 CrossRef PubMed.
- Y. Konis, S. Klein and I. Ohad, Fuel, 2015, 160, 35–42 CrossRef.
- J. Xie, F. Feng, H. Wei, H. Mao, H. Yan and C. Li, J. Funct. Biomater., 2008, 39(2), 293–296 Search PubMed.
- S. Sugashini, N. Carbon Mater., 2015, 30, 252–261 CrossRef.
- C. Pevida García, M. González Plaza, B. Arias Rozada, J. Fermoso Domínguez, F. Rubiera González and J. J. Pis Martínez, Appl. Surf. Sci., 2008, 254, 7165–7172 CrossRef.
- P. H. Matter, L. Zhang and U. S. Ozkan, J. Catal., 2006, 239, 83–96 CrossRef.
- B. Choi, H. Yoon, I. S. Park, J. Jang and Y. E. Sung, Carbon, 2007, 45, 2496–2501 CrossRef.
- C. O. Ania, V. Khomenko, E. Raymundo-Piñero, J. B. Parra and F. Béguin, Adv. Funct. Mater., 2010, 17, 1828–1836 CrossRef.
- K. Y. Kang, S. J. Hong, B. I. Lee and J. S. Lee, Electrochem. Commun., 2008, 10, 1105–1108 CrossRef.
- G. E. J. Poinern, Miner. Eng., 2011, 24, 1694–1702 CrossRef.
- J. X. Gao, T. F. Wang, G. R. Wang and J. F. Wang, Chin. J. Process Eng., 2009, 9, 18–22 Search PubMed.
- D. H. Bangham and W. Sever, Philos. Mag., 1925, 68, 124–125 Search PubMed.
Footnote |
| † Electronic supplementary information (ESI) available. See DOI: 10.1039/c8ra03243b |
| This journal is © The Royal Society of Chemistry 2018 |

