 Open Access Article
Development of nanofibrillar morphologies in poly(L-lactide)/poly(amide) blends: role of the matrix elasticity and identification of the critical shear rate for the nodular/fibrillar transition†
M. Yousfi *,
T. Dadouche,
D. Chomat,
C. Samuel
 ,
J. Soulestin,
M.-F. Lacrampe and
P. Krawczak
IMT Lille Douai, Institut Mines-Télecom, Department of Polymer and Composite Technology & Mechanical Engineering (TPCIM), 941 rue Charles Bourseul, CS 10838, F-59508 Douai, France. E-mail: mohamed.yousfi@imt-lille-douai.fr
First published on 14th June 2018
Abstract
Bio-based poly(L-lactide)/poly(amide-11) blends (PLA/PA11, 80/20 w/w) and poly(L-lactide)/poly(amide-6) blends (PLA/PA6, 80/20 w/w) are processed by twin-screw extrusion followed by injection-moulding and key rheological parameters controlling their morphologie are investigated. The same work is done using the same PLA modified by a multi-step reactive extrusion route with an epoxy-based chain extender to obtain modified poly(lactide)/poly(amide-11) (PLA-j/PA11 80/20 w/w) blends. The morphologies of the extruded materials and of the injection moulded parts are characterized by SEM and their formation is deeply discussed via rheological investigation to highlight the contribution of viscosity, elasticity and interfacial tension. The existence of a critical shear rate related to the transition from nodular to fibrillar morphology is highlighted and the results are in good agreement with the condition of fibrillation Ca/Ca(crit) ≥ 4. Interestingly, with the exception of PLA/PA6 specimens, all blends obviously display uniform thin-thread fibrillar morphologies after injection-moulding. Compared with pure PLA, a drastic increase of the ductility was observed in the blends exhibiting a fiberlike structure without meanwhile sacrificing the stiffness. This study confirms that, through the appropriate choice of blend components (viscosity and elasticity ratio, flow conditions, interfacial tensions) the in situ fibrillation concept provides access, at a reasonable cost, to new materials with improved thermomechanical performances, without sacrificing weight and ability to be recycled.
1. Introduction
Polymer blends are important industrial materials which are, still further, gaining in practical importance and scientific interest since the development of a blend is more economical than the synthesis of new functional polymer, which not only involves high costs but also cannot satisfy industrial demand.1 The great majority of useful polymer blends are not miscible, but their physical properties could be optimized by controlling the quality of the dispersion which depends on the melt rheological properties as well as on the mode of deformation of the blend components during compounding and/or processing stages. Compared to conventional composite materials which contain rigid fillers, polymer blends form a multiphase system with a deformable dispersed phase. Due to the complex nature of deformation of the minor phase, polymer blends have the potential of generating a wide range of morphologies during melt processing. These morphologies can roughly be divided in two classes: co-continuous systems and dispersion-like systems. In the latter, spherical, ellipsoidal, fibrillar or droplet-in-droplet morphologies have been reported in the scientific literature even with same composition.2The morphology created by the blending of immiscible fluids in industrial processes is the product of droplet deformation, breakup and coalescence. Taylor3 found that in purely viscous newtonian systems, the deformation and breakup of drops, is governed by two dimensionless parameters: the first one is ratio of the viscosity of the dispersed phase (ηd) to that of the continuous phase (ηm) denoted k (k = ηd/ηm), the second one is the Weber (or capillary) number, Ca, which represents the ratio of the viscous stresses imposed on the droplet by the external flow field to the interfacial tension forces that tend to restore the droplet to a spherical shape. The capillary number in shear flow is defined as:
Ca = ηm![[small gamma, Greek, dot above]](https://www.rsc.org/images/entities/i_char_e0a2.gif) /(Γd,m/R) /(Γd,m/R)
| (1) |
![[small gamma, Greek, dot above]](https://www.rsc.org/images/entities/i_char_e0a2.gif) is the shear rate, R is the radius of the droplet prior to undergoing deformation, and Γd,m is the interfacial tension between the dispersed phase (droplets) and the continuous phase (matrix).
is the shear rate, R is the radius of the droplet prior to undergoing deformation, and Γd,m is the interfacial tension between the dispersed phase (droplets) and the continuous phase (matrix).
At a certain critical shear rate (![[small gamma, Greek, dot above]](https://www.rsc.org/images/entities/i_char_e0a2.gif) c), the viscous forces exceed the interfacial ones and the droplet is broken up. The capillary number corresponding to the critical shear rate (
c), the viscous forces exceed the interfacial ones and the droplet is broken up. The capillary number corresponding to the critical shear rate (![[small gamma, Greek, dot above]](https://www.rsc.org/images/entities/i_char_e0a2.gif) c) is called the critical capillary number and is denoted by Ca(crit) with:
c) is called the critical capillary number and is denoted by Ca(crit) with:
Ca(crit) = ηm![[small gamma, Greek, dot above]](https://www.rsc.org/images/entities/i_char_e0a2.gif) c/(Γd,m/R) c/(Γd,m/R)
| (2) |
The critical capillary number in pure shear flow is minimum when the viscosity ratio (k) is equal to unity and increases to infinity for a viscosity ratio greater than 4 (ref. 4) (Fig. 1). Thus, systems with k > 4 should not be dispersible in pure shear flow.
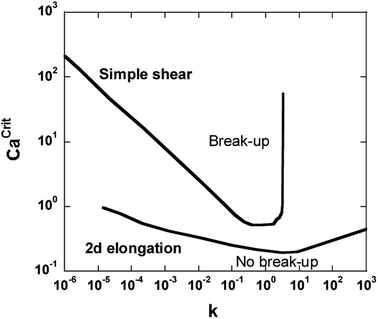 | ||
| Fig. 1 The Grace curve gives the relation between the critical capillary number Ca(crit) and the viscosity ratio k for the breakup of an initially spherical droplet in quasi-steady homogeneous flow (in simple shear and plane hyperbolic flow).4 | ||
In elongational flow, the critical capillary number is defined by
Ca(crit) = ηe,m![[small epsi, Greek, dot above]](https://www.rsc.org/images/entities/i_char_e0a1.gif) /(Γd,m/R) /(Γd,m/R)
| (3) |
![[small epsi, Greek, dot above]](https://www.rsc.org/images/entities/i_char_e0a1.gif) is the Hencky strain rate and ηe,m is the elongational viscosity of the matrix. Ca(crit) in elongational flow is lower and less sensitive to the viscosity ratio. Therefore, elongational flow fields are more effective than shear flow fields in transforming droplets into fibrous domains. More details on the theory of deformation in the case of newtonian and viscoelastic immiscible blends can be found in different review papers.5–8
is the Hencky strain rate and ηe,m is the elongational viscosity of the matrix. Ca(crit) in elongational flow is lower and less sensitive to the viscosity ratio. Therefore, elongational flow fields are more effective than shear flow fields in transforming droplets into fibrous domains. More details on the theory of deformation in the case of newtonian and viscoelastic immiscible blends can be found in different review papers.5–8
At a given viscosity ratio k with (1 ≤ k < 4), different modes of deformation and breakup are possible, depending on the capillary number values:
Ca < 0.1Ca(crit), there is no deformation of the droplet. The interfacial energy dominates.
0.1Ca(crit) ≤ Ca < Ca(crit), the droplet deforms slightly without break-up and reach a stable form.
Ca(crit) ≤ Ca ≤ 2 Ca(crit), the viscous stress dominates the interfacial stress, the droplet is unstable and breakup occurs by the splitting of the droplet into two equal parts before elongation into a filament can be achieved.
2Ca(crit) < Ca ≤ 4Ca(crit), the droplet is deformed into an unstable elongated fiber, then undergoes fragmentation via ‘end-pinching’ or Rayleigh capillary instabilities giving rise to several smaller droplets.9–12
Ca > 4 Ca(crit), the interfacial stress is completely overwhelmed by the shear stress, leading to large deformation of droplets into long fibrils. In this case, the dispersed droplets form long stable fibrils. Many researchers have used these criteria to study/predict the morphology and fibril formation in polymer blends.13,14
It is expected that in viscoelastic systems the critical capillary number also depends on the elasticity ratio.15–17 Wu18reports that the critical capillary number Ca(crit) is more important in the case of viscoelastic blends compared to newtonians ones. He proposes a V-shape describing the variation of Ca(crit) as a function of the viscosity ratio k as compared to the U-shape previously obtained in the case of newtonian melts. He also introduces an empirical equation between the critical capillary number and the viscosity ratio as:
 | (4) |
So elasticity of the droplet and matrix phases (often referred to as the first normal stress difference force N1) should be an important factor affecting the morphology of the dispersed phase particles. Since the experimental measurements of the normal force N1 are delicate, most studies devoted to the fibrillar morphology have focused on the effect of viscosity ratio neglecting the importance of the elasticity ratio between the dispersed and continuous phase, leading to contradictions and ambiguity to draw a clear correlation between the viscosity ratio and the optimal conditions of fiber formation and its temporal stability in the case of viscoelastic immiscible polymer blends.19–22 According to several literature reports,1,23–26 in the particular case of fiberlike morphology, the droplet–fibril transition could be controlled by the viscosity ratio (k) between the dispersed phase and matrix (a more viscous matrix promotes the breakdown of droplets27–31), the elasticity ratio (k′) between the dispersed phase and matrix (a more elastic matrix promotes deformation and extension of the nodules into fibrils14,17,23,32–39) and a compromise between deformation (shear or elongation) and relaxation should be achieved in order to have a stable filamentous morphology.21,22,40
Nevertheless, to summarize the results of the different studies on fibrillation41 and according to the work of Van Oene,42 to promote the droplet/fiber transition, it is thus necessary to develop a system such as the viscosity ratio k < 4 and in the same time the elasticity ratio k′ ≪ 1. A fine fibrillar morphology will be formed when the interfacial tension between the matrix and the minor phase is low.43
But it is not only necessary to form the fibrillar morphology. This one must also be stable in the flow. Then, a dispersed phase with a long relaxation time favors the temporal stability of the fibrillar structure.21
When a droplet undergoes high deformation in the matrix (reduced capillary number Ca/Ca(crit) > 1), it is known that the fiber breakup is generated by the strong applied stresses during flow. However, it was observed that rupture can occur by surface instabilities. In particular, when Ca/Ca(crit) > 2, highly elongated long thread suspended in another liquid is under non-equilibrium conditions, and its stability depends on the flow conditions, the interfacial tension, and its proper rheological properties as well as those of the suspending medium.44 When (2 < Ca/Ca(crit) < 4), the capillary instabilities (called Rayleigh disturbances) are the predominant mechanism of the rupture (see the ESI†).45
In simple shear flow with an affine deformation, Huneault et al.46 give the following equation to estimate the breakup time of the fibril:
 | (5) |
 | (6) |
Thus, the self-induced fibrillar morphology results of a complex rheological and thermal process, in which the discontinuous phase can form a fibrous structure under specific rheological and processing conditions, which results in one polymer being reinforced or softened by the other one. The basis for the creation of a stable self-induced fibrillar morphology is controlled by the rheological and interfacial properties of the molten components (viscosity and elasticity ratios, and interfacial tension) which control the deformation mode of the dispersed phase and guarantee the droplet/fiber transition24 and the relaxation of the fibrils which controls the stability of the morphology.47–51 Therefore, such materials called MFCs have attracted a great deal of interest and have been the subject during the last decade of several academic studies and industrial applications.52 Because they are exclusively based on thermoplastic polymers, these structured materials can provide an interesting solution to the problems of lightening to equivalent mechanical performances due to the low density of the polymer fiber while preserving the recyclability potential of the thermoplastic polymers.
Conventionally, the manufacture of these structured products is decomposed in two stages. The first step is the compounding of a blend of two immiscible polymers followed by drawing (hot or cold, i.e. above or below the glass transition temperature of the dispersed phase), cooling and quenching of the fibrillar morphology. The possibility of obtaining this morphology is directly related to the viscosity and elasticity ratios of the two materials, under the conditions induced by their flow in the extrusion and drawing processes. The second step, of forming process (by extrusion or injection) shall be carried out under conditions of temperature, strain rate deformation and residence time which do not to alter, or minimize the alteration of, the fibrillar structure previously obtained. For this purpose, the forming temperature of the dispersed phase must be 30 °C higher than that of the matrix. Thus, taking into account the constraints imposed on the one hand for obtaining the fibrillation of the dispersed phase during compounding and stretching and on the other hand for preserving the fibrillar structure during forming process, the number of polymers pairs suitable for these processes and showing an industrial interest is generally relatively limited.
Another approach is proposed here with the aim of extending the spectrum of polymer couples which can be used. The goal is to circumvent the constraints associated with the forming process stage by promoting fibrillation during this step and not only during the first compounding stage. This can be achieved, for example, by imposing a high stretching deformation in the feeding system of an injection mould. Thus, in the present study, a strategy is adopted consisting in the in situ generation, during the micro-injection forming process, of well-aligned high aspect ratio flexible nanofibrils having strong interfacial affinity with the matrix. Discussed here are blends of linear PLA (or chain branched modified PLA) and different polyamides (PA-11 and PA-6), which are chosen to form the fibrillar phase because of their impressive ductility, as well as their good compatibility with PLA.53,54
The present study addresses several key aspects concerning the development of fibrillar morphologies in a biobased polymer blends where nanometric poly(amide) fibrils could be controlled by processing parameters and rheology of neat polymers. In this respect, the article exposes and discusses several results such as: (i) the control over nanometric PA11 fibrils by viscosity and elasticity ratio, (ii) the identification of a critical shear rate and (iii) the use of reactive extrusion to generate PA11 (nano)fibrils at low shear rates. For this purpose, a precise shear rate characterization was accessed in injection-molding by high-speed image analysis and, on another side, normal stress differences of neat polymers were approached by two different methods. The correlation between viscoelastic properties of blend components, morphological structure and ultimate properties of the in situ polymer composites with a specific focus on the role of the matrix elasticity was highlighted.
2. Experimental
2.1 Materials
A semi-crystalline aliphatic polyester poly(l-lactic acid) (PLLA) (4032D, NatureWorks, USA) with a melting temperature of 170 °C is used as matrix. It has a d-lactide content of 1.4 ± 0.2%, a residual lactide content lower than 0.3%, a solid density of 1.24 g cm−3 and a melt flow index of 7 g/10 min measured at 210 °C under load of 2.16 kg.55Two polyamides 11 (PA11) with different viscosities having a solid density of 1.03 g cm−3 are chosen for the dispersed phase. The more viscous PA11, named PA11-HV (which stands for High Viscosity PA11) (Rilsan®BESVO, Arkema, France) has a melting temperature of 189 °C and a melt volume-flow rate of about 6 ml/10 min at 235 °C under load of 2.16 kg. The less viscous PA11, named PA-LV (which stands for Low Viscosity PA11) (Rilsan® BMNO, Arkema, France) has a melting temperature of 189 °C and a melt volume-flow rate of about 36, 5 ml/10 min at 235 °C under load of 2.16 kg(that is nearly 6 times lower than that of PA-HV). A polyamide 6 (PA6) with a solid density of 1.13 g cm−3 (Akulon® PA6C, DSM, The Netherlands) is also chosen for the dispersed phase. It has a melting temperature of 220 °C and an intrinsic viscosity of about 245 ml g−1. All polymers were dried in a vacuum at 80 °C for at least 12 h to minimize the moisture content before processing.
In addition, a chain extender ≪ CE ≫ agent with multiple epoxy functions (Joncryl 4300F, BASF, Germany) (Table 1) is used in order to increase the viscosity and elasticity of PLA. The notation PLA-j will designate the chain extender modified PLA. Before processing, all materials are dried at least 24 hours at 80 °C under vacuum in order to remove moisture.
| Name | Supplier | Trademark | Apparent density (g cm−3) | Mw (g mol−1) | Tg (°C) | Epoxy content (g mol−1) |
|---|---|---|---|---|---|---|
| Joncryl | BASF | 4300F | 1.08 | 5500 | 56 | 445 |
2.2 PLA modification by reactive extrusion
Solid granules of PLA are first mechanically grinded to a micron sized powder by the conventional cryogenic milling (CM) process using a rotary knife mill (Pulverisette 19, Fritsch, The Netherlands) fitted with a 0.5 mm sieve (trapezoidal perforation) at a high rotational rotor speed of 3400 rpm. Throughout the pulverisation process, the pellets are continuously submerged within a bath of liquid nitrogen inducing the formation of very fine particles. The total milling time is estimated to be 15 seconds (one cycle) and the material throughput quantity is ∼1 Kg h−1.After drying in a vacuum oven, some PLA powder is dry blended with 1% of chain extender ≪ CE ≫ agent and then extruded in a twin-screw extruder (HaakePolylab PTW 16/40, Thermo Scientific, Germany) at a temperature of 190 °C. The throughput is set at 0.75 kg h−1 and the screw speed at 80 rpm. Finally, the PLA-chain extender blend (designed by PLA-j) is quenched in water and pelletized. With those operating parameters, the residence time in the extruder ranges from 3 to 5 minutes and the material temperature reaches 205 °C in the die. Considering the chain extender reaction kinetics (supplier data), a conversion rate of 99% is expected.
2.3 Melt-blending
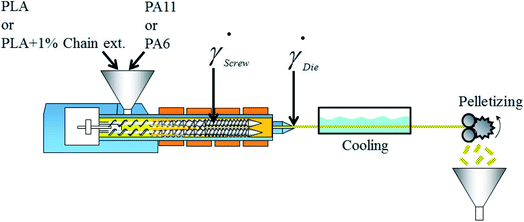
PLA/PA 80/20 w/w blends are first prepared by dry-blending, then extruded in the same twin-screw extruder as before. A screw speed of 150 rpm and a throughput of 0.7 kg h−1 are maintained for all the blends. A specific decreasing temperature profile (Table 2) is set in order to quickly melt the polymers and then operate a slight cool down, enabling the strand to have sufficient viscosity to withstand the upcoming drawing process. Hence, this temperature profile brings a material temperature in the die of ∼ 195 °C in the case of PLA/PA11 blends and ∼226 °C in the case of PLA/PA6 blends. After the extruder exit, the strand is cooled in a water bath and stretched in a pelletizer used as a drawing device at 25 m min−1 which represents the highest achievable speed without compromising the strand integrity. The measurement of the diameter of the die (D0) and of the stretched strands (Df) allows determining the stretching ratio (D02/Df2) (6.2 in this particular case). Table 3 summarizes the different blends obtained. Samples are designated by PLA/PA11-LV, PLA/PA11-HV and PLA/PA6 where LV and HV indicate Low Viscosity and High Viscosity polyamide 11 respectively.| Heating area | 1 | 2 | 3 | 4 | 5 | 6 | 7 | 8 | 9 | Die |
|---|---|---|---|---|---|---|---|---|---|---|
| Temperature (°C) (PLA/PA11 blends) | 200 | 200 | 200 | 200 | 200 | 200 | 190 | 190 | 190 | 190 |
| Temperature (°C) (PLA/PA6 blends) | 230 | 230 | 230 | 230 | 230 | 230 | 230 | 225 | 220 | 220 |
| Designation | Composition (wt%) | Stretching ratio | |
|---|---|---|---|
| PLA/PA11-LV | 80 (PLA) | 20 (PA11-LV) | 6.2 |
| PLA-j/PA11-LV | 80 (PLA + 1% joncryl) | 20 (PA11-LV) | 6.2 |
| PLA/PA11-HV | 80 (PLA) | 20 (PA11-HV) | 6.2 |
| PLA/PA6 | 80 (PLA) | 20 (PA6) | 6.2 |
In conditions used for melt blending (Fig. 2), the apparent shear rate in the extruder die, ![[small gamma, Greek, dot above]](https://www.rsc.org/images/entities/i_char_e0a2.gif) die, is calculated using the following equation56
die, is calculated using the following equation56
 | (7) |
 | (8) |
2.4 Injection-moulding
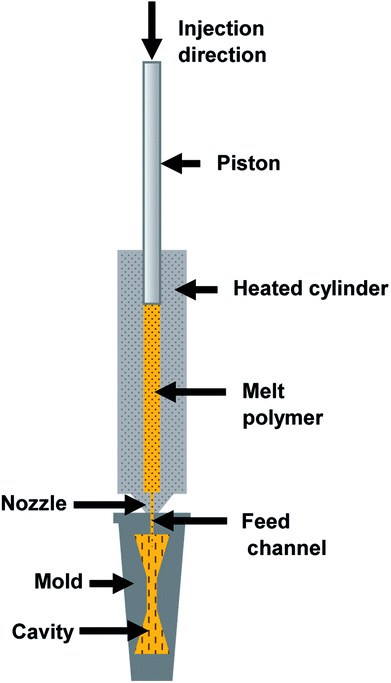
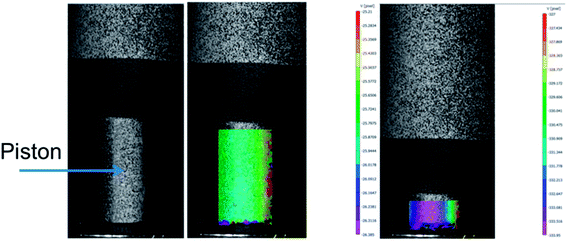
Specimens of the different compounds with different geometries (disks and dumbbells) are injection-moulded (HAAKE MiniJetII Piston Injection Moulding System, Thermo Scientific, Germany). The injection moulding temperature is set at 180 °C and 220 °C for PLA/PA11 and PLA/PA6 blends respectively. The injection pressure is set at 900 bars for 1 s, and the holding pressure is set at 500 bars for 5 s. The mould temperature is set at 40 °C.In order to investigate the link between the morphology of the micro-injection moulded parts and the rheological properties of used polymers, the shear rate during the micro-injection moulding process must be evaluated. A schematic illustration of the injection moulding system is presented in Fig. 3. During injection moulding, the polymer melt in the heated cylinder is transfered into the hot mould under high hydraulic pressure imposed by the piston. In order to evaluate the shear rate applied in the feed channel (![[small gamma, Greek, dot above]](https://www.rsc.org/images/entities/i_char_e0a2.gif) inj) located at the inlet of the mould cavity (Fig. 3), the piston speed should be measured. To do that, a digital image correlation (DIC) technique is used (Fig. 4). The 2D DIC system (vic-snap 2010, Correlated Solutions Ins, USA) measures the 2D displacement field of the piston during the thrust of the material, based on images from one camera (AVT Pike F-421B, CCD captor, square pixel size 7.4 μm, resolution 4 MP and acquisition speed in full resolution 16 ips). In order to use the DIC technique, a matt random speckle pattern is printed with a fine black liner on the front side of the piston prior to testing. The framing rate is 10 frames per second. The DIC data is post-processed with a subset size of 19 × 19 pixels and a grid point spacing of 5 pixels (vic 2D 2010, Correlated Solutions Inc, USA).
inj) located at the inlet of the mould cavity (Fig. 3), the piston speed should be measured. To do that, a digital image correlation (DIC) technique is used (Fig. 4). The 2D DIC system (vic-snap 2010, Correlated Solutions Ins, USA) measures the 2D displacement field of the piston during the thrust of the material, based on images from one camera (AVT Pike F-421B, CCD captor, square pixel size 7.4 μm, resolution 4 MP and acquisition speed in full resolution 16 ips). In order to use the DIC technique, a matt random speckle pattern is printed with a fine black liner on the front side of the piston prior to testing. The framing rate is 10 frames per second. The DIC data is post-processed with a subset size of 19 × 19 pixels and a grid point spacing of 5 pixels (vic 2D 2010, Correlated Solutions Inc, USA).
Knowing the dimensions of the injection moulding piston (φ = 11 mm) and of the feed channel (2 × 1 mm2), then the volumetric flow rate in the feed channel (called runner) is calculated following the eqn (9). Furthermore, it is possible to calculate the shear rate following the eqn (10).56
 | (9) |
 | (10) |
3. Characterization
3.1 Interfacial tension assessment
Surface energy of each polymer component (except PLA-j) is determined at 21 °C with the sessile drop method, using a drop shape analyser (DSA4, KrüssGmbh, Germany). From contact angle measurements performed with water and diiodomethane as probe liquids, the total surface energy, as well as disperse and polar parts are determined by using Owens–Wendt regression method.57 On each measurement, ten drops of each liquid are deposited and measured over the whole surface to ensure reproducibility at laboratory temperature.Since melt blending is necessarily carried out at elevated temperatures, the surface energies and interfacial tensions must be known at common melt temperature. To calculate the surface energy at the melt processing temperature (200 °C for PLA/PA11 blends) and (230 °C for PLA/PA6 blends), a constant polarity ratio (the ratio of polar part to total surface energy) is assumed58 as well as a thermal coefficient of surface tension  of 0.06 mN m−1 °C−1 for PLA59 and of 0.065 mN m−1 °C−1 for both polyamides grades.58 The melt interfacial tension γ12 between components 1 and 2 at the processing temperature is then estimated according to the fractional polarity using the geometric mean equation proposed by Owens and Wendt:57
 | (11) |
For PLA-j/PA11-LV and PLA/PA11-LV, the interfacial tension (Γ12) at processing temperature is determined by Palierne model [34], using the SEM images analysis (Section 4.3), shear oscillation rheometry (Section 4.2) and relaxation times (Section 4.2) measurements:
 | (12) |
3.2 Morphology analysis
Blend morphology of the longitudinal cross section of the extruded and injection-moulded samples, is observed under high vacuum with a scanning electron microscope (JEOL, JCM-6000 Plus, Japan) operating at 15 kV and a probe current of 130 pA. SEM micrographs of the PLA/PA blends are taken from samples fractured in liquid nitrogen for 3–5 min, and then coated with a thin gold layer (Polaron E5100 series II, Watford) to avoid charging on the fracture surface. The average PA domain diameters and their distribution are measured by means of image processing software (ImageJ©, USA).3.3 Shear oscillation rheometry measurements
Dynamic rheological measurements are performed using a rotational rheometer (HAAKE MARS III, Thermo Scientific, Germany), equipped with 35 mm diameter parallel-plates geometry, with a 1.5 mm gap size. Injection-moulded disks obtained from micro-injection moulding are used for these tests after being dried in a vacuum oven at 80 °C during 24 hours prior to experiment. Measurements are performed in nitrogen atmosphere at 200 °C for PLA/PA11 blends and 230 °C for PLA/PA6 systems. Linear domains of the different materials are identified from strain sweeps and a common strain of 10% is chosen for all samples which is within the linear viscoelastic region. Frequency sweeps are carried out between 0.1 and 100 rad s−1. Dynamic storage modulus (G′), dynamic loss modulus (G′′), and complex viscosity (|η*|) are recorded as functions of angular frequency (ω). The relaxation spectra H (λ) of neat polymers and blends are calculated. H (λ) from the storage modulus vs. angular frequency data using the Tikhonov non-linear regularization NLREG method integrated in the commercial software package RheoWin (ThermoScientific, Germany)60 which is a numerical procedures based on the regularization method proposed by Honerkamp and Weese,61 following the eqn (13):
 | (13) |
From the complex viscosity measurements, and assuming that the Cox-Merz rule |η*|(ω) = η(![[small gamma, Greek, dot above]](https://www.rsc.org/images/entities/i_char_e0a2.gif) ) is applicable to estimate the viscosities of the matrix and the dispersed phase at the predominant shear rate in the melt blending equipment, 80 s−1, the viscosity ratio (k) could be calculated.
) is applicable to estimate the viscosities of the matrix and the dispersed phase at the predominant shear rate in the melt blending equipment, 80 s−1, the viscosity ratio (k) could be calculated.
Elasticity in the droplet or matrix phase could be represented by the first normal stress difference N1. Consequently, the elasticity ratio can be calculated by:
 | (14) |
At very low frequency region (ω < 10 rad s−1), the elasticity (N1) is determined using the formula of Laun (eqn (15)).62
 | (15) |
At high share rates (ω > 1000 rad s−1), the elasticity (N1) is deduced from the swell die measurements described below (Section 3.4, eqn (24)).
Elasticity ratio also can be characterized for each shear rate by the Weissenberg number (Wi) which is often used as criteria of melt elasticity.63 In simple shear flow, the Weissenberg number gives the ratio of the elastic forces over the viscous forces. In the case of a Maxwell fluid, the Weissenberg number can be written as
Wi = λ![[small gamma, Greek, dot above]](https://www.rsc.org/images/entities/i_char_e0a2.gif)
| (16) |
![[small gamma, Greek, dot above]](https://www.rsc.org/images/entities/i_char_e0a2.gif) the shear rate.
the shear rate.
Assuming that the Cox-Merz rule could be applied for all materials investigated here, λ(ω) = λ(![[small gamma, Greek, dot above]](https://www.rsc.org/images/entities/i_char_e0a2.gif) ) (with ω in rad s−1 and
) (with ω in rad s−1 and ![[small gamma, Greek, dot above]](https://www.rsc.org/images/entities/i_char_e0a2.gif) in s−1), the elasticity of the polymers for each shear rate can be expressed as:
in s−1), the elasticity of the polymers for each shear rate can be expressed as:
 | (17) |
And then, the elasticity ratio for each shear rate can be calculated by:
 | (18) |
between the Weissenberg number of the droplet phase (Wid) and matrix (Wim). Such a ratio is used by different authors63–65 to quantify the elastic properties of different viscoelastic polymer blends. A Weissenberg number lower than unity indicates viscous-dominant (i.e. liquid-like) behavior and values higher than unity indicate elastic-dominant (i.e. solid-like) behavior.
3.4 Capillary rheometry measurements
Apparent melt viscosities of the polymers at 200 and 230 °C are determined at 3 different apparent shear rates(103, 104 and 105 s−1) by using a capillary rheometer (Goettfert, Rheograph 75 Model, Germany) equipped with a capillary die having a diameter (D) of 0.5 mm and a length (L) of 10 mm (L/D ratio of 20). The entrance pressure (ΔP) is measured directly above the die entrance by a pressure transducer of 100 MPa. The rheometer cylinder is 25 cm long and 1 cm in diameter. Material can be extruded through the die at controlled linear piston velocity ranging from 0.01 to 20 mm s−1.Die swell can also be calculated using the capillary rheometry measurements. When the temperature of the capillary rheometer reaches a stable level, the polymer is fed into the reservoir, and then tamped down to remove entrapped air. The piston speed is fixed to the desired shear rate and the measurements start 5 min after the beginning of the loading of the rheometer.
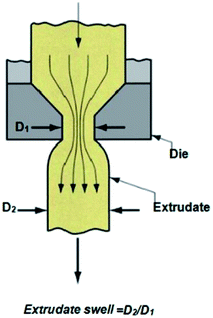
Extrudate swelling or die swell ratio is defined as the ratio of the extrudate diameter to the capillary die diameter66 (Fig. 5). Die swell is measured after the cooling of the hot extrudates of specified length. Swell measurements are performed after relaxation and complete elastic recovery of the strands. Since the diameter is measured after cooling, a correction factor is employed in order to normalize all swell data at the extrusion temperature rather than room temperature.67 Thus, the ratio of the extrudate diameter (D2) to the die diameter (D1) is multiplied by a density correction factor of:  to calculate the extrudate swell or Barus effect (B) as:
 | (19) |
Then, extrudate swell is used to calculate the first normal stress difference (N1) at high shear rate using the Tanner formula:66
 | (20) |
N1 = η![[small gamma, Greek, dot above]](https://www.rsc.org/images/entities/i_char_e0a2.gif) (8[(B)6 − 1)])0.5 (8[(B)6 − 1)])0.5
| (21) |
3.5 Tensile tests
Tensile properties are measured (Lloyd LR 10 K, United Kingdom) at 23 °C, at a constant crosshead speed of 10 mm min−1, with dumbbell-shaped specimens (1.5 mm thickness) prepared from micro-injection moulding according to the ISO 527-2 standard. All specimens are previously conditioned for at least 48 h at 20 ± 2 °C under a relative humidity of 50 ± 3%. At least, five specimens are tested for each material and the mean values and standard deviationsare calculated and reported.4. Results and discussion
4.1 Surface energy and interfacial tension at melt processing temperature
The contact angles, surface energy and polarity ratio of the neat materials at ambient (measured) and processing temperatures (calculated using procedure described in Section 3.1) are summarized in Tables 4 and 5.| Samples | γ polar (mN m−1) | γ dispersive (mN m−1) | Total surface energy (mN m−1) | Polarity ratio |
|---|---|---|---|---|
| PLA | 4.0 | 32.8 | 36.8 | 0.11 |
| PA11 | 3.5 | 27.2 | 30.7 | 0.11 |
| PA6 (ref. 68) | 14.5 | 37.4 | 51.9 | 0.28 |
A value of γPLA/PA11 ≈ 0.6 mN m−1 is found at 200 °C, suggesting a strong compatibility between the two immiscible polymers. In the case of PLA/PA6 blends, the melt interfacial tension at 230 °C is 3.1 mN m−1 which is coherent with the fact that PA6 is much more polar than PLA.
Finally, using eqn (12) and the results of the morphology analysis, a melting interfacial tension of 0.87 mN m−1 can be calculated for PLA/PA11-LV blend. This value is in agreement with the estimated interfacial tension based on the fractional polarity theory described before. The interfacial tension for PLA-j/PA11-LV blend is 0.44 mN m−1, which is in accordance with the fine morphology found for this blend (domain size for PA11 discrete phase was less than 0.3 μm, § 4.3).
4.2 Melt rheological behavior
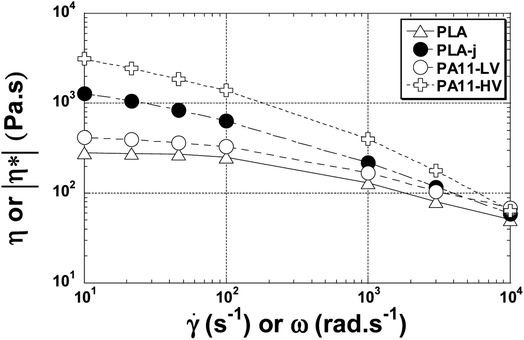
Fig. 6(a) shows the magnitude of the complex viscosity versus angular frequency at 200 °C of pure polymers used (PLA, the two grades of PA11 and PLA-j). In this range of frequency (0.1–100 rad s−1), pure PLA presents almost a newtonian behavior. The onset frequency of shear-thinning is located at 60 rad s−1. Furthermore, compared to pure PLA, a drastic increase of complex viscosity is noted for PLA modified by 1 wt% of chain extender ≪ CE ≫. The onset frequency of shear-thinning is shifted to 8 rad s−1 in the ≪ CE ≫ modified PLA. This could indicate the presence of branched structures in addition to linear ones. In addition, an increase in the elasticity is also observed for modified PLA (Fig. 7) manifested by a noticeable increase in the shear modulus (G′) in the whole considered angular frequency range. The introduction of chain branches due to chain extending reactions could explain the increase in melt viscoelasticity.70,71 PA11-LV and PA11-HV show a typical non-newtonian shear thinning viscosity profile with a similar onset frequency of shear-thinning at 10 rad s−1. In addition, in the whole examined angular frequency range, PA11-HV demonstrates a high melt viscosity and no newtonian plateau is observed. This result is consistent with the fact that PA11-HV has a high molecular weight compared to PA11-LV. At very low frequency, an unusual increase in the complex viscosity is observed in both PA11-LV and PA11-HV specimens probably due to the post-condensation of polyamide chains which occurred with increasing time since the frequency sweep is started at the highest frequency.72 Fig. 6(b) presents the complex viscosity of neat PLA and PLA/PA6 blends at 230 °C. PLA matrix at 230 °C shows a quasi-newtonian viscosity curve in the range 1 to 100 rad s−1. At low frequencies (ω < 1 rad s−1), a slight increase in the viscosity is highlighted. An increase in viscosity would mean an increase in molecular weight arising from further polycondensation. Similar behavior is observed in the case of PA6. This change in melt viscosity due to post-condensation reaction is characteristic of polyamide 6.73 It is useful to note that the onset frequency of shear-thinning at 230 °C is 50 and 15 rad s−1 for PLA, and PA6 respectively.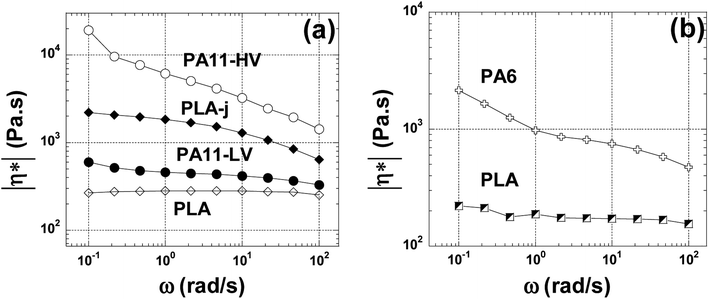 | ||
| Fig. 6 The complex viscosity angular frequency dependence at 200 °C for neat, modified PLA and PA11 samples (a) and for neat PLA, PA6 at 230 °C (b). | ||
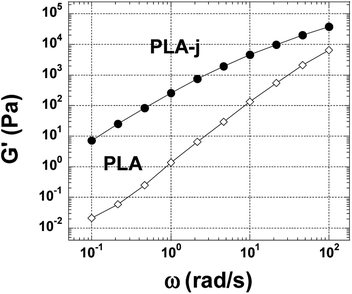
Fig. 8(a) shows the dependency of Weissenberg number (Wi) versus the shear rate for the neat and ≪ CE ≫ modified PLA matrix, low viscosity and high viscosity polyamide 11. It can be seen that for all materials, the (Wi) numbers increases as the shear rate increases since the elastic character of viscoelastic polymers increases as the shear stress increases. In the whole domain of shear rate or frequencies, the higher values of (Wi) are obtained in the presence of PA11-HV. The low viscosity polyamide 11 (PA11-LV) presentes a lower elasticity compared to PA11-HV but it shows a higher elasticity by looking at neat PLA matrix. It is useful to note that ≪ CE ≫ modified matrix (PLA-j) presents a melt elasticity almost three times higher than the unmodified PLA. At 100 rad s−1, the Weissenberg number increases from 0.27 in the case of neat PLA to 0.73 in the case of PLA-j.
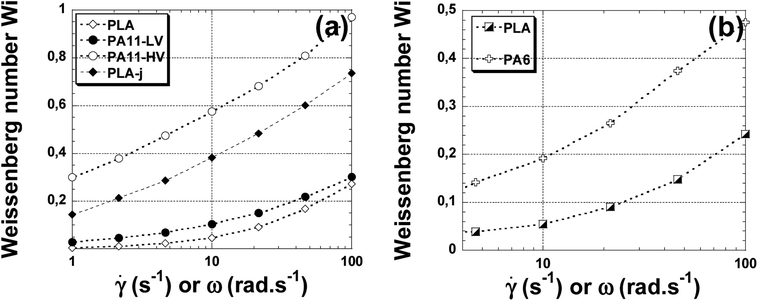 | ||
| Fig. 8 The Weissenberg number versus angular frequency at 200 °C (a) for neat PLA, PA11, PLA-j samples; at 230 °C (b) for neat PLA and PA6 samples. | ||
Fig. 8(b) shows the dependence of Weissenberg number on shear rate for PLA and PA6. For all polymers studied, the (Wi) number increases as (![[small gamma, Greek, dot above]](https://www.rsc.org/images/entities/i_char_e0a2.gif) ) increases. The high viscosity polyamide 6 exhibits the highest values of (Wi) in the whole range of the examined angular frequency.
) increases. The high viscosity polyamide 6 exhibits the highest values of (Wi) in the whole range of the examined angular frequency.
Fig. 9(a) shows the weighted relaxation spectrum of neat PLA, PA11-LV and PLA/PA11-LV blend. It is well documented in the literature that the relaxation time of pure PLA above its melting temperature is around 10−2 s.74,75 Zhou et al.76 found that the peak relaxation time for PLA (grade 4032D, such as the one used in the present study) is located at 10−2 s at 190 °C. Similar results (λ = 10−2 s) are found by Najafi et al. and Walha et al. on PLA (grade 3001D) at 200 °C.75,77 The relaxation of pure PA11-LV occurs also at high frequency (short relaxation times < 10−2 s) as seen in Fig. 9(a) and cannot be identified in the frequency domain used in the present study. In the case of PLA/PA11-LV blends, a large peak appears located at 0.62 s. This peak detected at longer relaxation times is associated with the shape relaxation of the PA11 droplets.
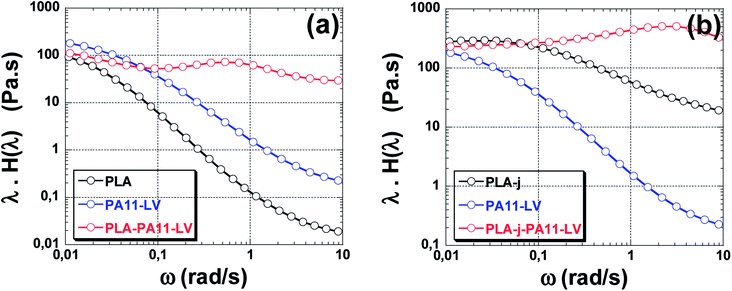 | ||
| Fig. 9 Weighted relaxation spectrum of neat PLA and PLA/PA11-LV blends (a), neat PLA-j and PLA-j/PA11-LV blends (b). | ||
Fig. 9(b) shows the relaxation spectrum of neat PLA, modified PLA containing 1% wt of ≪ CE ≫, and of PLA-j/PA11-LV blend. Two peaks can be easily identified, corresponding to two relaxation times. The first peak can be ascribed to the PLA-j matrix relaxation (0.03 s) which is 3 times higher than that of the unmodified PLA. Similar trend was found by Najafi et al.75 which correlated the increase in the relaxation time of chain-extender modified PLA by an increase in the melt elasticity. The second peak detected at long relaxation times domain is characteristic of the form relaxation of droplets (2.5 s in PLA-j/PA11-LV compared to 0.62 in PLA/PA11-LV).78
The viscosity versus shear rate curve from the oscillatory rheometry measurement fit reasonably well with the viscosity data obtained using rod capillary rheometry. Actually, according to the Cox–Merz theory,79 the oscillatory complex dynamic viscosity η* as a function of angular frequency and the steady state viscosity η as a function of shear rate can be superimposed for unfilled polymer melts, as shown in Fig. 10.
4.3. Morphology of the blends in the extrudate
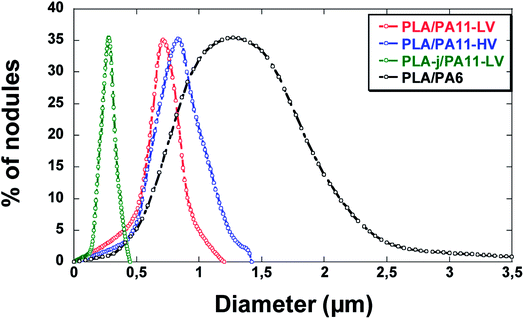
Fig. 11 and 12 show the SEM micrographs of longitudinal fracture surfaces of extrudates of different blends. Table 6 summarizes the average diameter of PA droplets in the blends and Fig. 13 represents the droplet size distribution. FWHM (full width at half maximum) is also measured in order to evaluate the polydispersity of diameter values.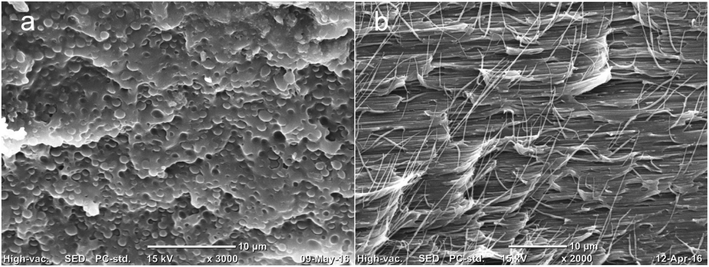 | ||
| Fig. 11 SEM observation of longitudinal fracture surfaces of extrudates for (a) PLA/PA11-LV, (b) PLA-j/PA11-LV. | ||
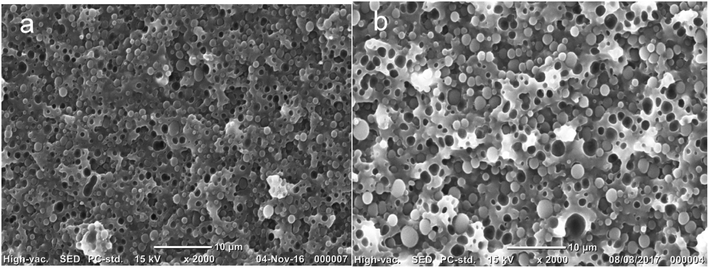 | ||
| Fig. 12 SEM observation of longitudinal fracture surfaces of extrudates for (a) PLA/PA11-HV, (b) PLA/PA6. | ||
| Blend | Average droplet diameter in the extrudate (μm) | FWHM (μm) |
|---|---|---|
| PLA/PA11-LV | 0.8 | 0.3 |
| PLA/PA11-HV | 0.9 | 0.4 |
| PLA/PA6 | 1.7 | 1.2 |
| PLA-j/PA11-LV | 0.3 | 0.1 |
All the unmodified PLA based blends present a uniformly distributed nodular morphology. The average size of PA11-LV droplets is 0.8 μm with a polydispersity FWHM of 0.3 μm (Fig. 11(a)). The presence of the fine morphological structure in the PLA/PA11-LV strands confirms the good compatibility between PLA and polyamide 11.54 The domain size of high viscosity polyamide 11 dispersed phase in the PLA-PA11-HV blend is slightly increased compared to that of the low viscosity PA11 (PA11-LV) with a nodule diameter in the range of 0.4–1.4 μm (averaged 0.91 μm). However, the droplet size varies more with a polydispersity FWHM of 0.4 μm (Fig. 12(a)). Compared to PA11-LV particles, PA6 droplets are much larger, with a mean particle size around 1.7 μm and the size distribution becomes wider (FWHM ∼ 1.2 μm). Compared to blends based on high viscosity polyamide 11 (PA11-HV), PLA/PA6 blend has a larger size distribution. The average diameters of PA6 nodules are almost twice larger than those of the PA11-HV(Fig. 12(b)). This difference between PA11 and PA6 based blends may be caused by the different polarity of the macromolecular chains of PA6 and PA11 as claimed by the difference in the melt surface energy between two polymers: the interfacial tension increases from 0.6 mN m−1 in the case of PLA/PA11 blend to 3.1 mN m−1 in the case of PLA/PA6 system (Section 4.1).
In contrast, electron microscopy images of the blend prepared from the modified PLA using ≪ CE ≫ (PLA-j/PA11-LV) reveal the presence of a fibril/matrix morphology (Fig. 11(b)). Long PA11 nano-fibrils with large aspect ratios and diameters of ∼0.3 μm are generated and are mainly parallel to each other along the extrusion direction. One can note the presence of some fibers not oriented in the direction of the flow direction, probably due to tearing during the cryo-fracture. The polydispersity of the fibrous domains is narrow with a FWHM of 0.1 μm.
To explain the fibrillation mechanism in the case of PLA-j-PA11 extrudates where the matrix is more viscoelastic than the dispersed phase, one can assume that prior to the entry of the extruder die, the dispersed phase in the extruded melt is present predominantly in the form of small droplets (fine nodular morphology). In the converging cross section at the die entrance, the extruded melt is subjected to a shear stress combined with an extensional stress. In this region, the droplets in the melt may elongate to a certain degree in the form of ellipsoids but do not fibrillize. However, once drawn by the external stretching device (Fig. 14), the droplets can elongate into fibrils under the uniaxial extensional stress since the more viscoelastic matrix can transmit the deformation stresses to the drops. One could also predict that the smaller droplets in the die entry region collide and can coalesce into larger droplets, and then they further extend into fibrils.80 Other authors have examined fibril formation in the converging die entrance and found droplet coalescence to occur there.30,80,81 In brief, in the case of the present study, the combined effect of deformation and coalescence leads to fibrillation of the PA11 dispersed phase droplets in viscoelastic PLA matrix modified by the ≪ CE ≫.
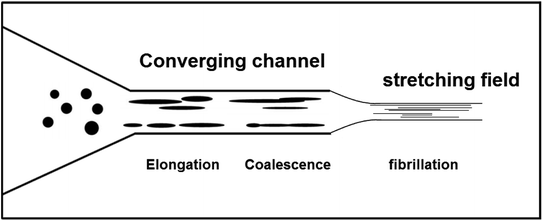 | ||
| Fig. 14 Schematic illustration of morphological evolution of in situ nanofibrillar PLA-j-PA11 blends. | ||
As reported in the Fig. 11(b) and Table 6, the PA11-LV fibrils exhibit a nanometric size distribution in the ≪ CE ≫ modified PLA matrix (PLA-j). This finer morphology (compared to that of unmodified PLA/PA11-LV blend) can be explained by the high compatibility between PA11 and PLA-j due to the low interfacial tension of PLA-j/PA11 blend as reported above (Section 4.1).
Table 7 summarized the values of the viscosity ratio k, the elasticity ratio k' and corresponding obtained morphology for different blends. In the case of PLA/PA11 blends, large difference in the values of k and k′ is found between the two type of polyamides. In the presence of low viscosity PA11-LV, the viscosity and elasticity ratio are slightly higher than unity. Although the viscosity of the PA11-LVis close to that of PLA matrix, the fact that the elasticity of the drop is higher than the elasticity of the matrix (k′ based on the elastic modulus ratio equals to 1.5), the development of a fibrous morphology does not occurs. So, the elasticity of neat PLA is not high enough to promote deformation and extension of the droplets into filaments. According to the approach of Mighri et al.,82,83 in the case of immiscible viscoelastic blends, the maximum elongational deformation of the dropletsis reached when the elasticity ratio k′ ≤ 0.37. In the case of the high viscosity PA11-HV, the viscosity ratio is very high (k > 6) and the elasticity ratio is greater than 4, unfavorable to the generation of a fibril/matrix morphology. However, it should be noted that nodular morphology observed in the photomicrographs of PLA/PA11-HVextrudate is finely homogeneous. According to the literature, in a shear flow field, with viscoelasticity ratios (k, k′) > 4, the deformation and breakup of a higher elastic drop in a weakly elastic matrix is not reached, giving rise in the majority of cases to a coarse and heterogeneous morphology.23,24,42 Nevertheless, the PLA/PA11 systems exhibit a very low interfacial tension at the melt processing temperature (γPLA,PA11 ≤ 0.6 mN m−1), which may partially explain the fine morphological structure obtained. In the case of PLA/PA6 extrudate blends, the viscosity and elasticity ratios are higher than 1 due to the weak viscoelasticity of neat PLA compared to PA 6. In these conditions, obtaining a fibrillar morphology is also not conceivable. In the case of PLA-j/PA11-LVextrudate blends, suitable rheological conditions to the fibrillation are found corresponding to a dual viscosity and elasticity ratio ≪1.
| Blend system | k (viscosity ratio) | k′ (elasticity ratio) (based on Wi ratio) | k′ (elasticity ratio) (based on G′ ratio) | Type of morphology |
|---|---|---|---|---|
| PLA/PA11-LV | 1.3 | 1.2 | 1.5 | Nodular |
| PLA/PA11-HV | 6.1 | 3.9 | 17.2 | Nodular |
| PLA/PA6 | 3.2 | 2.1 | 6.3 | Nodular |
| PLA-j/PA11-LV | 0.5 | 0.4 | 0.2 | Fibrillar |
However, the structured materials are obtained during extrusion and the question of the stability of their morphology arises.84 Then, the reduced breakup time was calculated for different PLA/PA blends in the extrudates and compared to the characteristic time for flow induced deformation (the inverse of the shear rate in the die ![[small gamma, Greek, dot above]](https://www.rsc.org/images/entities/i_char_e0a2.gif) −1). The results are summarized in Table 8. It can be seen that the reduced breakup time is widely higher than the residence time for all blends investigated, indicating that the nodular morphologies shown in PLA/PA extrudates is not due to the filaments capillary instabilities during shear flow.
−1). The results are summarized in Table 8. It can be seen that the reduced breakup time is widely higher than the residence time for all blends investigated, indicating that the nodular morphologies shown in PLA/PA extrudates is not due to the filaments capillary instabilities during shear flow.
4.4 Morphology of the micro-injected PLA/PA parts
SEM micrographs of longitudinally cryofractured sections of micro-injection moulded parts of PLA/PA11-LV,PLA/PA11-HV, PLA-j/PA11-LV and PLA/PA6 blends are presented in Fig. 15 and 16.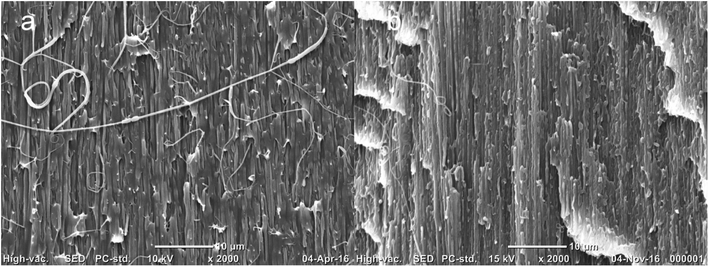 | ||
| Fig. 15 SEM pictures of longitudinal fracture surfaces of micro-injection moulded parts for (a) PLA/PA11-LV, (b) PLA/PA11-HV. | ||
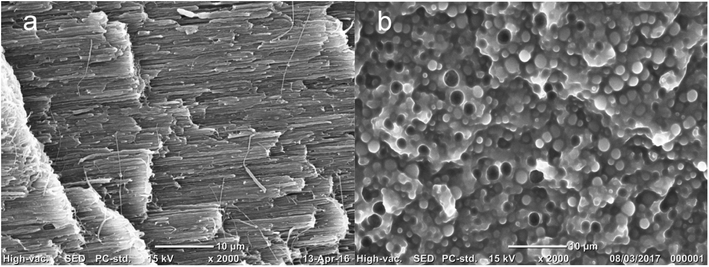 | ||
| Fig. 16 SEM pictures of longitudinal fracture surfaces of micro-injection moulded parts for: (a) PLA-j/PA11-LV, (b) PLA/PA6. | ||
The morphology of the microinjection moulded parts prepared from PLA/PA11-LV and PLA/PA11-HV blends are fibrillar despite the starting morphology in the extrudate is nodular. The diameter of fibrils of PA11 dispersed phase in the neat PLA matrix is between 0.2–0.8 μm (averaged 0.47 μm) for PA11-LV grade and between 0.1–0.7 μm (averaged 0.31 μm) for PA11-HV grade. The fine fibrillar morphology for the PLA-j/PA11-LV blend is conserved after microinjection moulding process. The diameter of PA11 dispersed phase is in the range of 0.1–0.5 μm (averaged 0.32 μm). The dispersed PA11 fibrils show tight contact with PLA-j matrix leaving no distinct voids between the elongated fibers and matrix. This indicates a good adhesion between the dispersed and continuous phases and these blends are extremely compatible. The average diameters of PA11 fibers for injection moulded PLA/PA11 and PLA-j/PA11 blends are summarized in Table 9.
| Blend | Average droplet diameter in the injected part (μm) | FWHM (μm) | Average fiber diameter in the injected part (μm) | FWHM (μm) |
|---|---|---|---|---|
| PLA/PA11-LV | 0.5 | 0.2 | ||
| PLA/PA11-HV | 0.3 | 0.2 | ||
| PLA/PA6 | 1.5 | 1.1 | ||
| PLA-j/PA11-LV | 0.3 | 0.2 |
In contrast to PLA/PA11 blends, the morphology is nodular for PLA/PA6 injection moulded specimens. The average diameter of dispersed phase domains in the presence of high viscoelastic polyamide 6 is 1.5 μm with a large polydispersity FWHM of 1.1 μm. One can note that a part of the dispersed particles are pulled out from PLA matrix during the fracture, leaving holes on the observation surface indicating a low adhesion between PLA matrix and PA6 dispersed phase (Fig. 17).
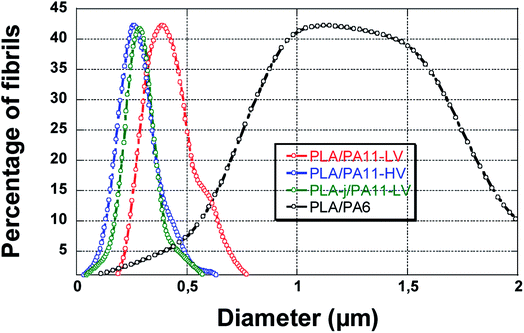 | ||
| Fig. 17 The size distribution of PA dispersed phase in micro-injection-moulded parts for PLA/PA11 and PLA/PA6 blends. | ||
The viscosity ratio (k) between the viscosities of the dispersed phase to the matrix is calculated at a shear rate of 105 s−1 corresponding nearly to the shear rate applied during the micro-injection moulding process (∼8500 s−1) previously measured by the digital image correlation technique (DIC).
Swell measurements are performed at 200 °C and 230 °C for PLA, at 200 °C for PA11 samples, and at 230 °C for PA6 samples. The N1 values in these conditions are then calculated using eqn (24). The results are reported in the Tables 10–12.
| Melt density (g cm−3) | η (at 10![[thin space (1/6-em)]](https://www.rsc.org/images/entities/char_2009.gif) 000 s−1) (Pas) 000 s−1) (Pas) |
B (Swelling ratio) | N1 (Pa) | |
|---|---|---|---|---|
| PLA | 1.09 | 50 | 1.59 | 5.50 × 10⁶ |
| PLA + 1% Joncryl | 1.09 | 58.3 | 1.88 | 1.08 × 10⁷ |
| PA11 (PA11-LV) | 0.91 | 68.4 | 1.23 | 3.04 × 10⁶ |
| PA11 (PA11-HV) | 0.91 | 63.1 | 1.31 | 3.59 × 10⁶ |
| Melt density (g cm−3) | η (at 10![[thin space (1/6-em)]](https://www.rsc.org/images/entities/char_2009.gif) 000 s−1) (Pas) 000 s−1) (Pas) |
B (Swelling ratio) | N1 (Pa) | |
|---|---|---|---|---|
| PLA | 1.08 | 40 | 1.47 | 3.41 × 10⁶ |
| PA6 | 0.98 | 136 | 1.55 | 1.38 × 10⁷ |
![[thin space (1/6-em)]](https://www.rsc.org/images/entities/char_2009.gif) 000 s−1
000 s−1
| Blends system | k (viscosity ratio) | k′ (elasticity ratio) | Type of morphology |
|---|---|---|---|
| PLA/PA11-LV | 1.4 | 0.55 | Fibrillar |
| PLA/PA11-HV | 1.2 | 0.65 | Fibrillar |
| PLA/PA6 | 3.4 | 4.1 | Nodular |
| PLA-j/PA11-LV | 1.2 | 0.28 | Fibrillar |
At high shear rates (105 s−1), favorable ratios for a stable fibrillation morphology are found for all PA11 based blends (PLA/PA11-LV, PLA/PA11-HV and PLA-j/PA11-LV). The viscosity ratios are closed to unity and the elasticity ratios are lower than 1 (Table 12); thus, the elasticity of the neat PLA is higher than PA11's ones at high shear rates. Therefore, the elasticity of the matrix (neat and modified PLA) is high enough to promote deformation and extension of the PA11 droplets, which is in agreement with SEM observations of microinjected specimens. As previously reported, at low shear rates (80 s−1), the morphology of PLA/PA11-LV and PLA/PA11-HV blends is nodular, but these same blends present suitable rheological properties to promote fibrillation of the dispersed phase at high shear rates.
In the case of blend prepared from PLA as matrix and PA6 as the dispersed phase, the viscosity ratios is higher than 3. PA6 exhibits also highest value of first normal stress difference, N1. VanOene reported that the drop elasticity has a stabilizing effect, which restrains droplet from deformation and breaking. Therefore, the increase in elasticity ratio (k' > 4) in the case of PLA/PA6 blends may prevent the droplet from the elongation to a stretched form under the shear/elongation flow field.
From these results, one can realize that there is a critical point (a critical shear rate) denoted ![[small gamma, Greek, dot above]](https://www.rsc.org/images/entities/i_char_e0a2.gif) tr which corresponds to the intersection between N1(
tr which corresponds to the intersection between N1(![[small gamma, Greek, dot above]](https://www.rsc.org/images/entities/i_char_e0a2.gif) ) curves of the matrix and that of the dispersed phase. The elasticity N1 at low share rates is calculated from Laun eqn (15) and from eqn (21) for high share rates.
) curves of the matrix and that of the dispersed phase. The elasticity N1 at low share rates is calculated from Laun eqn (15) and from eqn (21) for high share rates.
This critical shear rate ![[small gamma, Greek, dot above]](https://www.rsc.org/images/entities/char_e0a2.gif) trallows the transition from unsuitable to suitable rheological conditions to develop nano-fibrils from PA droplets.
trallows the transition from unsuitable to suitable rheological conditions to develop nano-fibrils from PA droplets.
It can be noted that the critical shear rate for PLA/PA11-LV blendsis found to be about 520 s−1 and for PLA/PA11-HV blend is about 3700 s−1. From these critical shear rates, the elasticity of the blend components becomes suitable to promote fibrillation. These results are in agreement with observed SEM images of the blends when high shear rate (>8500 s−1)is applied during micro-injection moulding. Since the elasticity ratio of PLA-j/PA11-HV is lower than that of PLA/PA11-HV, the critical shear rate decreases from 3700 s−1 to 1000 s−1 respectively. This shows that the more the elasticity ratio decreases the more the in situ fibrillation becomes favorable in the micro-injection moulding. In the case of PLA/PA6 blends, no critical shear rate is observed indicating a predominant nodular morphology regardless of the applied shear rate range investigated from 10−1 to 105 s−1.
From the critical shear rates obtained, one can predict the average radius of particles corresponding to the droplet/fibril transition (Fig. 18).
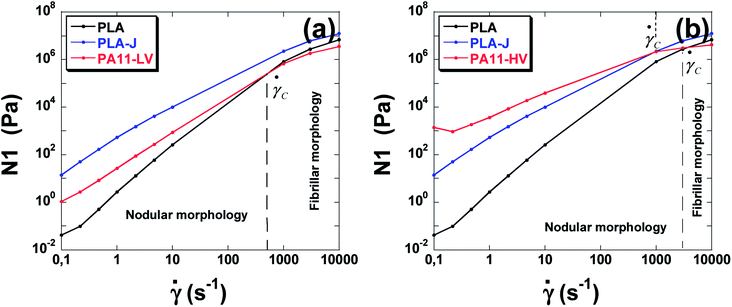 | ||
| Fig. 18 The elasticity of neat polymers used as a function of shear rate. (a) PLA, PLA-j and PA11-LV, (b), PLA, PLA-j and PA11-HV. | ||
As reported above, the transition from droplets to stable filaments is achieved when Ca = 4 Ca(crit) where Ca and Ca(crit) are the capillary number and critical capillary number respectively.
The Ca(crit) number at the critical shear rate corresponding to droplet–fibril transition is Ca(crit) = ηm![[small gamma, Greek, dot above]](https://www.rsc.org/images/entities/i_char_e0a2.gif) tr/(Γd,m/Rfibril) where ηm is the matrix viscosity at the critical shear rate, Γd,m is the interfacial tension and Rfibril is the radius of the fibril at the droplet–fibril transition.
tr/(Γd,m/Rfibril) where ηm is the matrix viscosity at the critical shear rate, Γd,m is the interfacial tension and Rfibril is the radius of the fibril at the droplet–fibril transition.
Using the Wu eqn (4) to determine the critical capillary number Ca(crit) (Section 1), this gives the following relation:
 | (22) |
The calculation gives Rfibril equals to 0.22 μm for PLA/PA11-LV blends and 0.125 μm for PLA/PA11-HV blends. These results are in perfect consistence with the above SEM image analyzes who gave average fibers radius of 0.25 μm and 0.15 μm for PLA/PA11-LV and PLA/PA11-HV respectively.
Finally, the reduced breakup time is calculated for different PLA/PA blends in the injection-moulding parts and compared to the characteristic time for flow induced deformation (the inverse of the shear rate)in the shear zone of the feed channel of the injection moulding machine (![[small gamma, Greek, dot above]](https://www.rsc.org/images/entities/i_char_e0a2.gif) −1). The results are summarized in Table 13. In all cases, the break-up time is much higher than the residence time indicating the stability of the obtained fibrillar morphologies.
−1). The results are summarized in Table 13. In all cases, the break-up time is much higher than the residence time indicating the stability of the obtained fibrillar morphologies.
4.5. Mechanical properties of PLA/PA blends
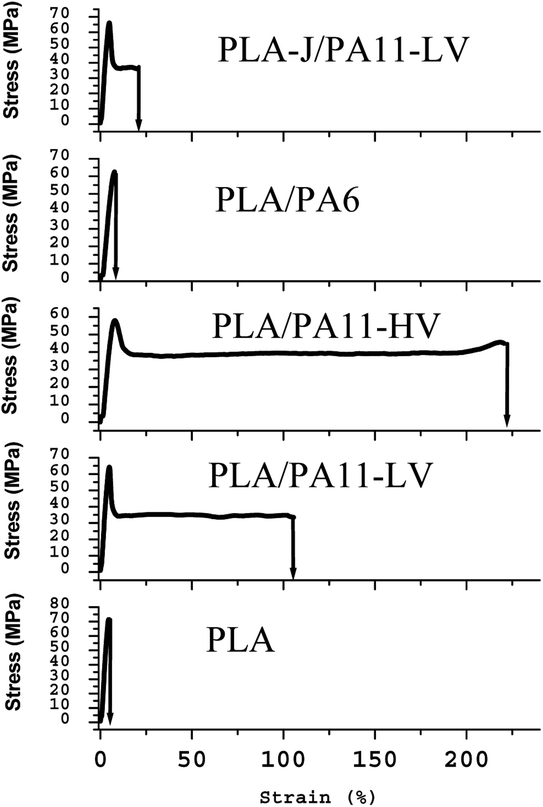
The tensile properties of PLA/PA blends are given in Table 14. Fig. 19 compares the mechanical performance of the microinjection moulded specimens prepared from neat polymers and PLA-PA11 blends. It is well known that PLA has a high tensile strength and modulus but is brittle. It can be seen that PA11 has obviously moderate yield stress and tensile modulus but a higher elongation at break. Furthermore, blending PA11 with PLA improves the mechanical performance of the PLA matrix. The tensile stress–strain behaviour changes from brittle (for the neat PLA) to ductile (for the PLA/PA11) blend as demonstrated by the increase in the elongation at break from 8.9% for neat PLA to 94.8% and 268.9% for PLA/PA11-LV and PLA/PA11-HV respectively, without sacrificing the stiffness. Compared to neat PLA matrix, the tensile modulus decreases by 11% and 18% in the case of PLA/PA11-LV and PLA/PA11-HV respectively. The obvious enhancement in mechanical performance of PLA could be explained by the highly oriented structures formed by the PA11 fibrils which are previously reported by SEM observations.| Tensile strength (MPa) | SD (MPa) | Elongation at break (%) | SD (%) | Tensile modulus (MPa) | SD (MPa) | |
|---|---|---|---|---|---|---|
| PLA | 70.4 | 0.6 | 8.9 | 0.6 | 4018 | 129 |
| PLA-j | 72.5 | 0.6 | 8.8 | 0.3 | 3778 | 346 |
| PA11-LV | 47.8 | 7.1 | 456.1 | 11.0 | 1222 | 78 |
| PLA/PA11-LV | 64.4 | 0.9 | 94.8 | 23.0 | 3569 | 120 |
| PLA-j/PA11-LV | 64.9 | 1.1 | 45.8 | 10.6 | 3212 | 145 |
| PA11-HV | 53.5 | 2.5 | 271.2 | 26.3 | 1191 | 99 |
| PLA/PA11-HV | 57.3 | 1.6 | 268.9 | 45.5 | 3273 | 116 |
| PA6 | 36.0 | 0.8 | 396.3 | 31.8 | 1948 | 39 |
| PLA/PA6 | 61.6 | 0.9 | 7.5 | 0.5 | 3363 | 247 |
The ratio of the viscoelastic properties of the phases certainly influences the type of morphology, the form of the particles of the disperse phase (droplets or fibrils) and their size. However, in this study, the link between the morphology and mechanical properties is not reflected for all blend samples. Although PLA-j/PA11-LV microinjection moulded specimens adopt predominant nanofibrillar morphology with well oriented nanofibrils; nevertheless, they have an elongation at break two times lower than that of PLA/PA11-LVfibrillar blends while the tensile strength and Young's modulus remain similar. This is probably due to the high percentage of branching groups used (1% by weight) of ≪ CE ≫. Indeed, similar results were reported recently by Ma et al.85 when using dicumyl peroxide (DCP) as a chain extender for PLA matrix. They found that the ductility of PLA/PBAT blends decreases with the increasing in chain-extender content. At 0.1 wt% by weight of DCP, the elongation at break was 300%, and it goes down to 40% with 1 wt% DCP. But the authors give no explanation for this phenomenon.
In the case of PLA/PA6 blends having a nodular morphology, a coarsening of the microstructure is observed which leads to a loss in ductility which would be associated with the relative decrease in the amount of interface, occurring together with the increase of the polydispersity and the domain size of the PA6 phases as previously observed from SEM micrographs. The tensile modulus of PLA/PA6 blend decreases by 16% compared to neat PLA matrix.
It is useful to mention that it is reported in different literature reports86,87 that in comparison with conventional injection moulding processes, the combination of higher shear rates and faster cooling rates in the micro-injection moulding process (mainly due to reduced thickness) favor the formation of highly oriented fibrils in the microparts compared to conventional macroparts. Accordingly, the fraction of the oriented structures formed during micro-injection moulding is higher than those formed during conventional injection moulding. This study is under investigation in our laboratory.
5. Conclusion
SEM analysis of PLA/PA blends showed that in the immiscible PLA/PA extrudates, the phase structure without the chain extender agent was predominantly nodular and totally fibrillar for the blend prepared with 1% CE agent, against a totally fibrillar morphology for microinjected moulded parts. The results showed also that the incorporation of the chain extension agent improved the adhesion between PLA and PA11 inducing the formation on in situ nano(fibrillated) polymer/polymer composites. In addition to the viscosity ratio, the effect of the elasticity ratio on the blend morphology was highlighted. Although the elasticity ratio was not favorable to fibrillation during the extrusion step, the situation could be reversed during the high shear rate injection moulding process. Critical shear rates and fibrils sizes related to the transition from nodular to fibrillar morphology have been determined and the results are in good agreement with the condition of fibrillation Ca/Ca(crit) ≥ 4. Regarding the mechanical performances, a drastic increase of the ductility was observed in the PLA/PA11 blends compared with pure PLA (with an elongation at break greater than 90% against only 9% for neat PLA), without sacrificing meanwhile the stiffness.Conflicts of interest
There are no conflits to declare.Acknowledgements
The authors are indebted for valuable assistance provided by Dr. Salim Chaki from IMT-Lille Douai in Digital Image Correlation experiments. They acknowledge Ms. Justine Piquet from IMT-Lille Douai for surface energy measurements. The authors also gratefully acknowledge the International Campus on Safety and Intermodality in Transportation (CISIT), the Nord-Pas-de-Calais Region and the European Community (FEDER funds) for funding contribution to the acquisition of the micro-injection moulding machine, the dynamic rheometer and the scanning electron microscope.References
- C. W. Macosko, Macromol. Symp., 2000, 149, 171–184 CrossRef
.
- H. E. H. Meijer, P. J. Lemstra and P. H. M. Elemans, Makromolekulare Chemie-Macromolecular Symposia, 1988, 16, 113–135 CrossRef
.
- G. I. Taylor, Proceedings of the Royal Society of London. Series A, Containing Papers of a Mathematical and Physical Character, 1932, vol. 138, pp. 41–48 Search PubMed
.
- H. P. Grace, Chem. Eng. Commun., 1982, 14, 225–277 CrossRef
.
- F. Rumscheidt and S. Mason, J. of Colloid Sci., 1961, 16, 238–261 CrossRef
.
- H. Karam and J. Bellinger, Ind. Eng. Chem. Res., 1968, 7, 576–581 Search PubMed
.
- S. Torza, R. Cox and S. Mason, J. Colloid Interface Sci., 1972, 38, 395–411 CrossRef
.
- L. Levitt, C. W. Macosko and S. D. Pearson, Polym. Eng. Sci., 1996, 36, 1647–1655 CrossRef
.
- S. Tomotika, Proc. R. Soc. A, 1935, 150, 322–337 CrossRef
.
- L. Rayleigh, P. Lond. Math. Soc., 1878, 10, 4–13 CrossRef
.
- S. Tomotika, Proc. R. Soc. A, 1936, 153, 302–318 CrossRef
.
- Y. Seo and J. Kim, Polymer, 2001, 42, 5029–5036 CrossRef
.
- P. Cassagnau and A. Michel, Polymer, 2001, 42, 3139–3152 CrossRef
.
- I. Pesneau, A. A. Kadi, M. Bousmina, P. H. Cassagnau and A. Michel, Polym. Eng. Sci., 2002, 42, 1990–2004 CrossRef
.
- S. H. Wu, Polym. Eng. Sci., 1987, 27, 335–343 CrossRef
.
- G. Serpe, J. Jarrin and F. Dawans, Polym. Eng. Sci., 1990, 30, 553–565 CrossRef
.
- W. Lerdwijitjarud, A. Sirivat and R. G. Larson, Polym. Eng. Sci., 2002, 42, 798–809 CrossRef
.
- S. Wu, Polym. Eng. Sci., 1987, 27, 335–343 CrossRef
.
- Y. Deyrail, R. Fulchiron and P. Cassagnau, Polymer, 2002, 43, 3311–3321 CrossRef
.
- Y. Deyrail, A. Michel and P. Cassagnau, Can. J. Chem. Eng., 2002, 80, 1017–1027 CrossRef
.
- M. A. Huneault, M. F. Champagne and A. Luciani, Polym. Eng. Sci., 1996, 36, 1694–1706 CrossRef
.
- A. Luciani and J. Jarrin, Polym. Eng. Sci., 1996, 36, 1619–1626 CrossRef
.
- W. Berger, H. W. Kammer and C. Kummerlőwe, Die Makromolekulare Chemie, 1984, 10, 101–108 CrossRef
.
- P. H. M. Elemans, Modelling of the processing of incompatible polymer blends, Eindhoven University, 1989 Search PubMed
.
- V. E. Dreval, G. V. Vinogradov, E. P. Plotnikova, M. P. Zabugina, N. P. Krasnikova, E. V. Kotova and Z. Pelzbauer, Rheol. Acta, 1983, 22, 102–107 CrossRef
.
- A. Taguet, P. Cassagnau and J. M. Lopez-Cuesta, Prog. Polym. Sci., 2014, 39, 1526–1563 CrossRef
.
- U. Sundararaj and C. W. Macosko, Macromolecules, 1995, 28, 2647–2657 CrossRef
.
- R. A. De Bruijn, Deformation and breakup of drops in simple shear flows, Eindhoven university, 1989 Search PubMed
.
- J. J. Elmendorp, A study of polymer blending microrheology, Delft University of Technology, 1986 Search PubMed
.
- M. V. Tsebrenko, N. M. Rezanova and I. A. Tsebrenko, Polym. Eng. Sci., 1999, 39, 2395–2402 CrossRef
.
- C. L. Tucker and P. Moldenaers, Annu. Rev. Fluid Mech., 2002, 34, 177–210 CrossRef
.
- J. J. Elmendorp and R. J. Maalcke, Polym. Eng. Sci., 1985, 25, 1041–1047 CrossRef
.
- F. Gauthier, H. L. Goldsmith and S. G. Mason, Rheol. Acta, 1971, 10, 344–364 CrossRef
.
- P. P. Varanasi, M. E. Ryan and P. Stroeve, Ind. Eng. Chem. Res., 1994, 33, 1858–1866 CrossRef
.
- W. J. Milliken and L. G. Leal, J. Non-Newtonian Fluid Mech., 1991, 40, 355–379 CrossRef
.
- S. Guido and M. Villone, J. Rheol., 1998, 42, 395–415 CrossRef
.
- F. Abbassi-Sourki, M. A. Huneault and M. Bousmina, Polymer, 2009, 50, 645–653 CrossRef
.
- T. Cherdhirankorn, W. Lerdwijitjarud, A. Sirivat and R. G. Larson, Rheol. Acta, 2004, 43, 246–256 CrossRef
.
- W. Lerdwijitjarud, R. G. Larson, A. Sirivat and M. J. Solomon, J. Rheol., 2003, 47, 37–58 CrossRef
.
- Y. W. Stegeman, F. N. van de Vosse and H. E. H. Meijer, Can. J. Chem. Eng., 2002, 80, 632–637 Search PubMed
.
- N. A. Plate, V. G. Kulichikhin and R. V. Talroze, Pure Appl. Chem., 1991, 63, 925–940 Search PubMed
.
- H. Vanoene, J. Colloid Interface Sci., 1972, 40, 448–467 CrossRef
.
- J. Reignier, B. D. Favis and M. C. Heuzey, Polymer, 2003, 44, 49–59 CrossRef
.
- H. A. Stone, B. J. Bentley and L. G. Leal, J. Fluid Mech., 1986, 173, 131–158 CrossRef
.
- L. Rayleigh, 1879.
- M. Huneault, M. Champagne and A. Luciani, Polym. Eng. Sci., 1996, 36, 1694–1706 CrossRef
.
- C. D. Han, Multiphase Flow in Polymer Processing, New York, 1981 Search PubMed
.
- A. Acrivos, Ann. N. Y. Acad. Sci., 1983, 404, 1–11 CrossRef
.
- J. M. Rallison, Annu. Rev. Fluid Mech., 1984, 16, 45–66 CrossRef
.
- L. A. Utracki and Z. H. Shi, Polym. Eng. Sci., 1992, 32, 1824–1833 CrossRef
.
- P. H. M. Elemans, H. L. Bos, J. M. H. Janssen and H. E. H. Meijer, Chem. Eng. Sci., 1993, 48, 267–276 CrossRef
.
- K. Friedrich, J. Hoffmann, M. Evstatiev and S. Fakirov, in Recent Advances in Composite Materials, ed. S. a. Paipetis, 2003, pp. 203–214 Search PubMed
.
- B. J. Rashmi, K. Prashantha, M. F. Lacrampe and P. Krawczak, Exp. Polym. Lett., 2015, 9, 721–735 CrossRef
.
- G. Stoclet, R. Seguela and J. M. Lefebvre, Polymer, 2011, 52, 1417–1425 CrossRef
.
- Q. K. Meng, M. C. Heuzey and P. J. Carreau, Polym. Degrad. Stab., 2012, 97, 2010–2020 CrossRef
.
- M. Yousfi, S. Alix, M. Lebeau, J. Soulestin, M.-F. Lacrampe and P. Krawczak, Polym. Test., 2014, 40, 207–217 CrossRef
.
- D. K. Owens and R. C. Wendt, J. Appl. Polym. Sci., 1969, 13, 1741–1747 CrossRef
.
- S. Wu, Polymer Interface and Adhesion, Dekker, New York, 1982 Search PubMed
.
- V. Khoshkava and M. R. Kamal, Biomacromolecules, 2013, 14, 3155–3163 CrossRef PubMed
.
- I. McDougall, N. Orbey and J. M. Dealy, J. Rheol., 2014, 58, 779–797 CrossRef
.
- J. Honerkamp and J. Weese, Macromolecules, 1989, 22, 4372–4377 CrossRef
.
- H. M. Laun, J. Rheol., 1986, 30, 459–501 CrossRef
.
- M. Astruc, S. Vervoort, H. O. Nouatin, T. Coupez, Y. De Puydt, P. Navard and E. Peuvrel-Disdier, Rheol. Acta, 2003, 42, 421–431 CrossRef
.
- Y. Iso, C. Cohen and D. L. Koch, J. Non-Newtonian Fluid Mech., 1996, 62, 135–153 CrossRef
.
- M. Xanthos, V. Tan and A. Ponnusamy, Polym. Eng. Sci., 1997, 37, 1102–1112 CrossRef
.
- R. I. Tanner, J. Non-Newtonian Fluid Mech., 2005, 129, 85–87 CrossRef
.
- E. A. Jensen and J. D. Christiansen, J. Non-Newtonian Fluid Mech., 2008, 148, 41–46 CrossRef
.
- M. Tagawa, K. Gotoh, A. Yasukawa and M. Ikuta, Colloid Polym. Sci., 1990, 268, 589–594 CrossRef
.
- A. Cayla, C. Campagne, M. Rochery and E. Devaux, Synth. Met., 2011, 161, 1034–1042 CrossRef
.
- R. Al-Itry, K. Lamnawar and A. Maazouz, Polym. Degrad. Stab., 2012, 97, 1898–1914 CrossRef
.
- R. Al-Itry, K. Lamnawar and A. Maazouz, Eur. Polym. J., 2014, 58, 90–102 CrossRef
.
- R. Salehiyan, T. Malwela and S. S. Ray, Polym. Degrad. Stab., 2017, 139, 130–137 CrossRef
.
- D. J. Dijkstra, Pure Appl. Chem., 2009, 81, 339–349 Search PubMed
.
- D. F. Wu, L. J. Yuan, E. Laredo, M. Zhang and W. D. Zhou, Ind. Eng. Chem. Res., 2012, 51, 2290–2298 CrossRef
.
- N. Najafi, M. C. Heuzey, P. J. Carreau, D. Therriault and C. B. Park, Rheol. Acta, 2014, 53, 779–790 CrossRef
.
- Y. Zhou, F. Yu, H. Deng, Y. Huang, G. Li and Q. Fu, J. Phys. Chem. B, 2017, 121, 6257–6270 CrossRef PubMed
.
- F. Walha, K. Lamnawar, A. Maazouz and M. Jaziri, Polymers, 2016, 8, 61 CrossRef
.
- R. E. Riemann, H. J. Cantow and C. Friedrich, Polym. Bull., 1996, 36, 637–643 CrossRef
.
- A. Y. Malkin, J. Non-Newtonian Fluid Mech., 2013, 192, 48–65 CrossRef
.
- M. V. Tsebrenko, A. V. Yudin, T. I. Ablazova and G. V. Vinogradov, Polymer, 1976, 17, 831–834 CrossRef
.
- M. V. Tsebrenko, G. P. Danilova and A. Y. Malkin, J. Non-Newtonian Fluid Mech., 1989, 31, 1–26 CrossRef
.
- F. Mighri, A. Ajji and P. J. Carreau, J. Rheol., 1997, 41, 1183–1201 CrossRef
.
- F. Mighri, P. J. Carreau and A. Ajji, J. Rheol., 1998, 42, 1477–1490 CrossRef
.
- F. Fenouillot and H. Perier-Camby, Polym. Eng. Sci., 2004, 44, 625–637 CrossRef
.
- P. Ma, X. Cai, Y. Zhang, S. Wang, W. Dong, M. Chen and P. J. Lemstra, Polym. Degrad. Stab., 2014, 102, 145–151 CrossRef
.
- Z.
M. Li, B. H. Xie, S. Y. Yang, R. Huang and M. B. Yang, J. Mater. Sci., 2004, 39, 433–443 CrossRef
.
- P. Deng, K. J. Liu, L. Zhang, H. Liu, T. Wang and J. Zhang, J. Macromol. Sci., Part B: Phys., 2014, 53, 24–39 CrossRef
.
Footnote |
| † Electronic supplementary information (ESI) available. See DOI: 10.1039/c8ra03339k |
| This journal is © The Royal Society of Chemistry 2018 |

