 Open Access Article
Relating alkaline stability to the structure of quaternary phosphonium cations†
Bingzi Zhang‡
a,
Hai Long‡ b,
Robert B. Kaspara,
Junhua Wanga,
Shuang Guc,
Zhongbin Zhuang
 de,
Bryan Pivovarb and
Yushan Yan
 *ade
*ade
aDepartment of Chemical and Biomolecular Engineering, University of Delaware, Newark, DE 19716, USA. E-mail: yanys@udel.edu
bNational Renewable Energy Laboratory, MS ESIF302, 15013 Denver West Parkway, Golden, Colorado 80401, USA
cDepartment of Mechanical Engineering, Wichita State University, Wichita, KS 67260, USA
dState Key Lab of Organic–Inorganic Composites, Beijing University of Chemical Technology, Beijing 100029, China
eBeijing Advanced Innovation Center for Soft Matter Science and Engineering, Beijing University of Chemical Technology, Beijing 100029, China
First published on 25th July 2018
Abstract
Alkali-stable quaternary phosphonium (QP) is a type of cationic group for hydroxide exchange membranes (HEMs). To elucidate the relationship between structure and alkaline stability, we investigated the kinetics and degradation mechanism of a series of QP cations by both experiment and computation, and established a semi-empirical formula based on the Taft equation to directly estimate alkaline stability of QP cations from the 31P NMR chemical shift δ and the steric substituent constant Es, facilitating the search for QP cations with improved alkaline stability.
Introduction
Fuel cells are one of the most promising candidates for next-generation vehicle power sources.1–3 Proton exchange membrane fuel cells (PEMFCs) are the leading technology in this field, but their commercialization has been hindered by the high cost and low durability of precious-metal catalysts.4 By contrast, by switching the working ion from a proton (H+) to hydroxide (OH−), hydroxide exchange membrane fuel cells (HEMFCs) enable non-precious metals such as silver5,6 and nickel6,7 as electrocatalysts and thus have the potential to solve the catalyst cost and durability problems.A major problem of the hydroxide exchange membrane (HEM) and hydroxide exchange ionomer (HEI) is poor alkaline stability, resulting from OH− attack of cationic groups linked to the polymer backbone.8–14 For example, the most widely used cations are quaternary ammoniums (QAs),15–27 such as benzyl trimethylammonium (BTMA).21 Experiment has shown that 77% of BTMA degraded in 1 M KOD CD3OD/D2O (5/1 vol) solution after 480 h at 80 °C (the typical HEMFC operating temperature), corresponding to a degradation rate constant at 80 °C (k80) of 8.3 × 10⁻⁷ M−1 s−1.28 Instability of cationic groups in an alkaline environment has limited the practical application of HEMFCs.29 Stabler cations are needed.
Switching the central atom from nitrogen to phosphorus yields quaternary phosphoniums (QPs), which showed promising alkaline stability. Yan's group developed a stabilized QP, benzyl tris(2,4,6-trimethoxyphenyl)phosphonium (BTPP-(2,4,6-MeO)),30–32 in which the nine methoxy groups provide strong electron donation and steric hindrance. BTPP-(2,4,6-MeO) was found to be twice as stable as BTMA.28 HEMs based on BTPP-(2,4,6-MeO)-functionalized polysulfone (PSf-BTPP-(2,4,6-MeO)) exhibited decent hydroxide conductivity (45 mS cm−1 at 20 °C) and improved alkaline stability compared to the typical commercial QA-based FAA membranes.31 The degradation mechanism study of BTPP-(2,4,6-MeO) in alkaline environment further showed that the major degradation pathway is ether hydrolysis of methoxy substituents instead of oxide formation.28 Accordingly, we replaced the methoxy groups with methyl groups and developed a superior QP cation, methyl tris(2,4,6-trimethylphenyl)phosphonium (MTPP-(2,4,6-Me)). MTPP-(2,4,6-Me) showed excellent alkaline stability (<20% degradation after 5000 h at 80 °C in 1 M KOD CD3OD/D2O (5/1 vol) solution; k80 = 1.3 × 10⁻⁸ M−1 s−1): 31 times that of BTPP-(2,4,6-MeO) (k80 = 4.0 × 10⁻⁷ M−1 s−1) and 64 times that of BTMA, making it one of the most stable cations for HEMs.28
In this work, to further elucidate the relationship between structure and alkaline stability, we investigated the kinetics and degradation mechanism of a series of QP cations by both experiment and computation. We identified transition state (TS) structures and computed the degradation reaction free energy barriers ΔG≠ for these cations by density functional theory (DFT), an approach that previously improved understanding of degradation of QA and imidazolium cations.33–35 Our computed ΔG≠ values show a good linear relationship with experimental values. From these results, we established a semi-empirical formula based on the Taft equation to directly estimate alkaline stability of QP cations from the 31P NMR chemical shift δ and the steric substituent constant Es, providing insight on how to further improve stability.
Experimental
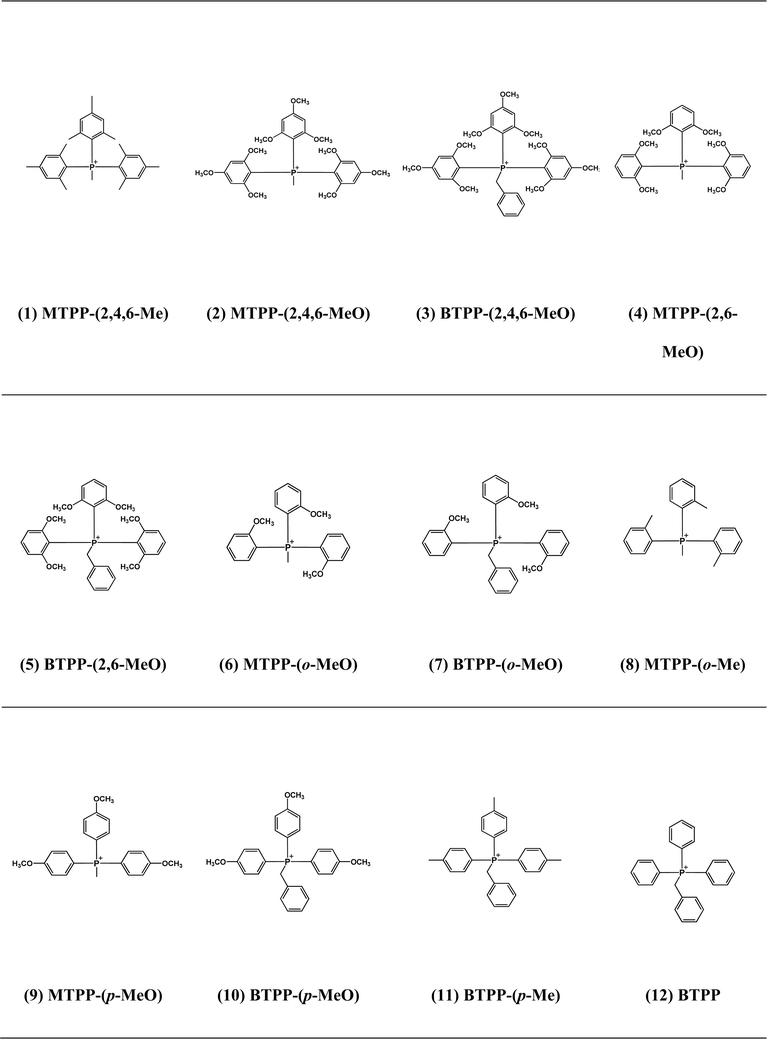
The QP cations studied in this work are shown in Table 1. The experimentally measured k80 for each cation was obtained through alkaline stability tests.28,29 The details of QP synthesis, alkaline stability tests and NMR spectra are shown in the ESI, Fig. S1–S12.† ΔG≠ was obtained by DFT calculation as we explained in detail elsewhere.8 In short, reactant and TS structures were optimized by the B3LYP36 method with Gaussian 09 (G09), with the 6-311++G(2d,p) basis set and polarizable continuum solvation model (PCM). Free energies at 80 °C and 1 atm for the reactants and TS were then calculated based on the optimized structure. ΔG≠ was obtained by subtracting the free energy of the TS from the total free energies of the ground states of reactants (cation + OH−).8 For cations with different reaction sites for the same degradation pathway (e.g., the ether hydrolysis pathway can be on either o-OCH3 or p-OCH3), ΔG≠ was calculated for all potential reaction sites, and the one with the lowest ΔG≠ value was reported.Results and discussion
Under the test conditions, QP cations have two possible degradation pathways: oxide formation (nucleophilic addition, Fig. S13†), and ether hydrolysis of the methoxy substituents (SN2, Fig. S14†). The experimentally measured rate constants for overall degradation (k80), oxide formation (kOF), and ether hydrolysis (kEH) for all the cations are shown in Table 2. According to their degradation mechanisms, these cations can be divided into three categories (Table S1†): (i) chiefly oxide formation (k80 = kOF); (ii) chiefly ether hydrolysis (k80 = kEH); (iii) a mixture of both (k80 = kOF + kEH). The first category includes some of the methoxy-substituted cations, for which oxide formation dominates ether hydrolysis rates (and thus k80 = kOF is an excellent approximation), as well as all of the methyl-substituted cations. Cation (1)–(5) have k80 values several orders of magnitude smaller than the other cations, indicating that occupying all of the ortho-positions can effectively prevent OH− from attacking the P center. Cation (1) shows the highest stability, because in addition to the large steric effect, the alkali-stable methyl substituents eliminate the ether hydrolysis degradation pathway. The k80 and kOF of cation (12) are not measurable by this test due to its prohibitively rapid degradation even at room temperature.| QP | k80 (M−1 s−1) | kOF (M−1 s−1) | ΔG≠OF,EXP (kcal mol−1) | ΔG≠OF,DFT (kcal mol−1) | kEH (M−1 s−1) | ΔG≠EH,EXP (kcal mol−1) | ΔG≠EH,DFT (kcal mol−1) |
|---|---|---|---|---|---|---|---|
| a N/A: it is not a viable pathway; N/M: it is a potential degradation pathway, but the value is not measurable due to limitation of experiment conditions; N/C: the value is not calculable from eqn (1). | |||||||
| (1) | 1.3 × 10⁻⁸ | 1.3 × 10⁻⁸ | 31.0 | 28.0 | N/A | N/A | N/A |
| (2) | 3.8 × 10⁻⁷ | 1.5 × 10⁻⁸ | 30.9 | 27.4 | 3.6 × 10⁻⁷ | 28.7 | 27.0 |
| (3) | 4.0 × 10⁻⁷ | N/M | N/C | 29.6 | 4.0 × 10⁻⁷ | 28.6 | 26.8 |
| (4) | 6.0 × 10⁻⁷ | 5.0 × 10⁻⁷ | 28.5 | 25.8 | 1.0 × 10⁻⁷ | 29.6 | 27.2 |
| (5) | 3.7 × 10⁻⁷ | 1.9 × 10⁻⁷ | 29.1 | 27.2 | 1.8 × 10⁻⁷ | 29.2 | 25.8 |
| (6) | 2.0 × 10⁻⁵ | 2.0 × 10⁻⁵ | 25.9 | 19.3 | N/M | N/C | 28.0 |
| (7) | 2.8 × 10⁻⁵ | 2.8 × 10⁻⁵ | 25.6 | 18.7 | N/M | N/C | 26.7 |
| (8) | 3.9 × 10⁻⁴ | 3.9 × 10⁻⁴ | 23.8 | 18.9 | N/A | N/A | N/A |
| (9) | 2.2 × 10⁻⁴ | 2.2 × 10⁻⁴ | 24.2 | 13.7 | N/M | N/C | 26.1 |
| (10) | 1.3 × 10⁻³ | 1.3 × 10⁻³ | 23.0 | 15.9 | N/M | N/C | 26.6 |
| (11) | 9.7 × 10⁻² | 9.7 × 10⁻² | 19.9 | 15.1 | N/A | N/A | N/A |
| (12) | N/M | N/M | N/C | 14.7 | N/A | N/A | N/A |
The computational ΔG≠ values for both pathways (ΔG≠OF,DFT and ΔG≠EH,DFT) were compared with experimental values (ΔG≠OF,EXP and ΔG≠EH,EXP) (Table 2). The experimental ΔG≠ follows from the rate constant k according to TS theory (eqn (1)):
 | (1) |
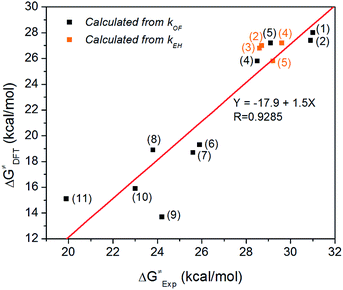
Fig. 1 shows experimentally measured ΔG≠ vs. DFT calculated ΔG≠ when both are available. A good linear fit is achieved (R = 0.9285), suggesting that the B3LYP/6-311++G(2d,p) method and PCM solvation model are effective in predicting the degradation trend of QPs for both pathways. We also used an alternative method to calculate ΔG≠ via M06![[thin space (1/6-em)]](https://www.rsc.org/images/entities/char_2009.gif) 37/6-311++G(2d,p) and SMD solvation model.38 However, this resulted in a worse fit (R = 0.7429, Fig. S15†). The good correlation between experimental and B3LYP/PCM calculated ΔG≠ values for QP cations is surprising, since for QA cations the same method usually shows a worse correlation with experiment. For example, we recently performed a similar fitting for 20 different QA cations using B3LYP/PCM method, resulting in a much worse fit with R = 0.3350. The degradation measurements were performed in different environments: a low-water environment (CD3OD/D2O (5/1 vol) solution) for QPs vs. aqueous solution for QAs. One possible explanation for this good correlation is that the PCM implicit solvation model used in B3LYP calculations underestimated the solvation effect of water, yielding data more consistent with the measurements in the less solvated environment.
37/6-311++G(2d,p) and SMD solvation model.38 However, this resulted in a worse fit (R = 0.7429, Fig. S15†). The good correlation between experimental and B3LYP/PCM calculated ΔG≠ values for QP cations is surprising, since for QA cations the same method usually shows a worse correlation with experiment. For example, we recently performed a similar fitting for 20 different QA cations using B3LYP/PCM method, resulting in a much worse fit with R = 0.3350. The degradation measurements were performed in different environments: a low-water environment (CD3OD/D2O (5/1 vol) solution) for QPs vs. aqueous solution for QAs. One possible explanation for this good correlation is that the PCM implicit solvation model used in B3LYP calculations underestimated the solvation effect of water, yielding data more consistent with the measurements in the less solvated environment.
 | ||
| Fig. 1 Experimentally measured ΔG≠ vs. DFT calculated ΔG≠ using B3LYP/6-311++G(2d,p) method and PCM solvation model. | ||
Both experimental and DFT data presented in Table 2 suggest that the oxide formation pathway usually has a lower reaction barrier than the ether hydrolysis pathway, implying that unprotected P atom is more vulnerable to OH− attacking than OCH3 group. In these cases, the rate determining step for the degradation is the oxide formation reaction. This is not surprising since OH− can attack the unprotected P atom easily via P atom's vacant d orbital. To make the reaction barrier of oxide formation higher, we have employed large steric hindrance in cations (e.g., cation (2) and cation (3)), which results in significant enhancement of ΔG≠OF. Take cation (3) (ΔG≠EH = 26.8 kcal mol−1, ΔG≠OF = 29.6 kcal mol−1) for example, regions near the P atom become very crowded, preventing OH− from attacking the P atom.
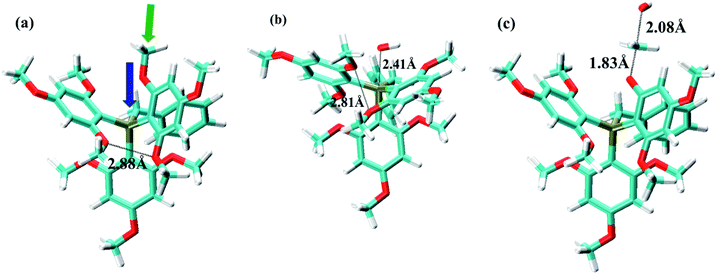
Fig. 2 shows the ground state, oxide formation TS, and ether hydrolysis TS of cation (3). This cation has three phenyls and one benzyl linked to P atom. For the oxide formation pathway, OH− can either attack the P atom through the pore formed by three phenyl ligands or by two phenyls and one benzyl. Obviously, the steric effect is weaker in the latter case owing to the smaller size of CH2 group in the benzyl ligand, so that this will be the major route for OH− to attack the P atom (Fig. 2a). This is confirmed by DFT data: the ΔG≠OF values for the above two routes are 33.4 kcal mol−1 and 29.6 kcal mol−1, respectively. As OH− approaches the P atom, the three ligands (two phenyls and one benzyl) move resembling the opening of an umbrella to accommodate the OH− (Fig. 2b). As the result, o-OCH3 on the phenyl groups will become closer to each other. The closest O–O distance for o-OCH3 groups in Fig. 2a and b is 2.88 Å and 2.81 Å, respectively, indicating slightly stronger steric interference in the oxide formation TS than in the ground state. For the ether hydrolysis pathway, as OH− approaches the methyl of OCH3 from the opposite direction of the bond between the methyl and the O atom, the three H atoms on methyl takes a similar umbrella flip movement (Fig. 2a and c). In this case, the increase of the steric hindrance is negligible (the ΔG≠EH values for different cations only change slightly (1–2 kcal mol−1) due to electronic effects). Therefore, for cation (3), ether hydrolysis reaction becomes the dominant degradation pathway.
Establishing a relationship between structure and alkaline stability would greatly benefit the search for new alkali-stable QP cations. A semi-empirical formula could bypass the need for screening experimentally or running DFT calculations (some QP cations are so large that DFT calculations of all potential degradation pathways would use as many as 100![[thin space (1/6-em)]](https://www.rsc.org/images/entities/char_2009.gif) 000 processor hours). Our proposed formula is based on the Taft equation (eqn (2)), which describes the relationship between reaction rate constants and the electronic and steric effects for different substituents:39–41
000 processor hours). Our proposed formula is based on the Taft equation (eqn (2)), which describes the relationship between reaction rate constants and the electronic and steric effects for different substituents:39–41
 | (2) |
 | (3) |
The following discussion will consider only ΔG≠OF because the ether hydrolysis pathway depends only on individual behavior of the methoxy groups, not on δ or Es. There are three types of steric effect in all the QPs studied: o-CH3, o-OCH3 and P–CH2C6H5. The steric effect of the para-substituent is negligible due to its large distance from the P center. We estimated Es by DFT as follows: we designed a new QP, MTPP-(p-Me) (cation (13)) (Fig. 3). The steric effect in cation (13) is weak so that it is very unstable experimentally. We performed a DFT calculation for the ground state of this cation and compared the free energies with its isomer, cation (8). The ΔG between two isomers is 16.5 kcal mol−1. By assuming that the electronic effects are similar for p-CH3 and o-CH3,43 this energy difference can be attributed to the steric effect of the o-CH3 group.
With Es = 0 for QPs with P–CH3 and para-substituents (e.g., in cation (9) and cation (13)), then Es = 16.5 for o-CH3. Similarly, we can calculate the ΔG values between other pairs of isomer cations. The ΔG between cation (6) and cation (9) is 8.0 kcal mol−1, and thus, Es(o-OCH3) = 8.0. The ΔG between cation (7) and cation (10) is 13.5 kcal mol−1, and the steric effect is assumed to be the linear combination of Es(o-OCH3) and Es(P–CH2C6H5), so that Es(P–CH2C6H5) = 13.5 − Es(o-OCH3) = 13.5 − 8.0 = 5.5. Based on these parameters, we can estimate the total Es for cations with multiple steric contributions. For example, for cation (3), Es(3) = Es(P–CH2C6H5) + 2 × Es(o-OCH3) = 5.5 + 2 × 8.0 = 21.5. The Es values for cations with the oxide formation pathway are presented in Table 3.
| Cations | δ | Es | ΔG≠OF,EXP (kcal mol−1) | ΔG≠OF,Fitted (kcal mol−1) |
|---|---|---|---|---|
| (1) | 6.53 | 33.0 | 31.0 | 30.9 |
| (2) | −3.79 | 16.0 | 30.9 | 30.1 |
| (4) | −1.84 | 16.0 | 28.5 | 29.7 |
| (5) | 7.85 | 21.5 | 29.1 | 28.7 |
| (6) | 20.1 | 8.0 | 25.9 | 24.0 |
| (7) | 24.7 | 13.5 | 25.6 | 24.0 |
| (8) | 21.7 | 16.5 | 23.8 | 25.1 |
| (9) | 18.8 | 0 | 24.2 | 22.9 |
| (10) | 20.8 | 5.5 | 23.0 | 23.4 |
| (11) | 22.0 | 5.5 | 19.9 | 23.2 |
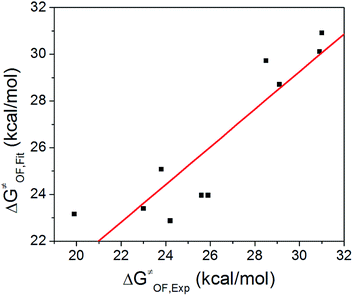
Based on δ, Es, and ΔG≠OF,Exp values in Table 3, we performed a three-dimensional linear fit to obtain a, b, c (eqn (3)) using software package GNUPLOT 4.2. The fitting gives: a = −0.20 kcal mol−1, b = 0.17 kcal mol−1, and c = 26.6 kcal mol−1. We then used these values, δ, and Es to calculate ΔG≠OF,Fitting by eqn (3) and presented the results in Table 3. Fig. 4 indicates that ΔG≠OF,Exp and ΔG≠OF,Fitting have a reasonable linear relationship (R = 0.8988). Thus, the stability of cations can be directly estimated by using the 31P NMR chemical shift δ and the Es deduced from the chemical structure.
Conclusion
The alkaline degradation mechanism and kinetics of a series of QP cations were studied experimentally and theoretically. B3LYP and PCM solvation model effectively predicted the degradation trend of QP cations for oxide formation and ether hydrolysis pathways. To explore the structure-stability relationship of QPs, a semi-empirical formula based on the Taft equation was established, by which alkaline stability of QP cations can be estimated from 31P NMR chemical shift δ and steric parameter Es. This relationship will be valuable in searching for QP cations with improved stability and also provide insight for structure-alkaline stability prediction of other types of cations such as QA. For example, if we replace P–CH3 in cation (1) (the most stable one we have) with P–CH2C6H5, we would increase Es by 5.5 so that the new cation may be a promising candidate to further boost alkaline stability.Conflicts of interest
There are no conflicts to declare.Acknowledgements
This work is supported in part by the MURI program of the ARO under contract W911NF-10-1-0520 and the ARPA-E program of the DOE under contract DE-AR-0000009.References
- S. Gu, B. Xu and Y. Yan, in Annual Review of Chemical and Biomolecular Engineering, ed. J. M. Prausnitz, M. F. Doherty and R. A. Segalman, 2014, vol. 5, pp. 429–454 Search PubMed.
- S. Gottesfeld, D. R. Dekel, M. Page, C. Bae, Y. Yan, P. Zelenay and Y. S. Kim, J. Power Sources, 2018, 375, 170–184 CrossRef.
- J. R. Varcoe, P. Atanassov, D. R. Dekel, A. M. Herring, M. A. Hickner, P. A. Kohl, A. R. Kucernak, W. E. Mustain, K. Nijmeijer, K. Scott, T. Xu and L. Zhuang, Energy Environ. Sci., 2014, 7, 3135–3191 RSC.
- R. Borup, J. Meyers, B. Pivovar, Y. S. Kim, R. Mukundan, N. Garland, D. Myers, M. Wilson, F. Garzon, D. Wood, P. Zelenay, K. More, K. Stroh, T. Zawodzinski, J. Boncella, J. E. McGrath, M. Inaba, K. Miyatake, M. Hori, K. Ota, Z. Ogumi, S. Miyata, A. Nishikata, Z. Siroma, Y. Uchimoto, K. Yasuda, K. I. Kimijima and N. Iwashita, Chem. Rev., 2007, 107, 3904–3951 CrossRef PubMed.
- J. R. Varcoe, R. C. T. Slade, G. L. Wright and Y. Chen, J. Phys. Chem. B, 2006, 110, 21041–21049 CrossRef PubMed.
- S. Gu, W. Sheng, R. Cai, S. M. Alia, S. Song, K. O. Jensen and Y. Yan, Chem. Commun., 2013, 49, 131–133 RSC.
- S. Lu, J. Pan, A. Huang, L. Zhuang and J. Lu, PNAS, 2008, 105, 20611–20614 CrossRef.
- H. Long, K. Kim and B. S. Pivovar, J. Phys. Chem. C, 2012, 116, 9419–9426 CrossRef.
- J. B. Edson, C. S. Macomber, B. S. Pivovar and J. M. Boncella, J. Membr. Sci., 2012, 399, 49–59 CrossRef.
- G. Merle, M. Wessling and K. Nijmeijer, J. Membr. Sci., 2011, 377, 1–35 CrossRef.
- S. Chempath, J. M. Boncella, L. R. Pratt, N. Henson and B. S. Pivovar, J. Phys. Chem. C, 2010, 114, 11977–11983 CrossRef.
- S. Chempath, B. R. Einsla, L. R. Pratt, C. S. Macomber, J. M. Boncella, J. A. Rau and B. S. Pivovar, J. Phys. Chem. C, 2008, 112, 3179–3182 CrossRef.
- C. S. Macomber, J. M. Boncella, B. S. Pivovar and J. A. Rau, J. Therm. Anal. Calorim., 2008, 93, 225–229 CrossRef.
- J. R. Varcoe and R. C. T. Slade, Fuel Cells, 2005, 5, 187–200 CrossRef.
- K.-D. Kreuer, Chem. Mater., 2014, 26, 361–380 CrossRef.
- M. A. Hickner, A. M. Herring and E. B. Coughlin, J. Polym. Sci., Part B: Polym. Phys., 2013, 51, 1727–1735 CrossRef.
- Y.-J. Wang, J. Qiao, R. Baker and J. Zhang, Chem. Soc. Rev., 2013, 42, 5768–5787 RSC.
- A. Brouzgou, A. Podias and P. Tsiakaras, J. Appl. Electrochem., 2013, 43, 119–136 CrossRef.
- H. Zhang and P. K. Shen, Chem. Soc. Rev., 2012, 41, 2382–2394 RSC.
- H. Zhang and P. K. Shen, Chem. Rev., 2012, 112, 2780–2832 CrossRef PubMed.
- J. Pan, C. Chen, L. Zhuang and J. Lu, Acc. Chem. Res., 2012, 45, 473–481 CrossRef PubMed.
- Y. A. Elabd and M. A. Hickner, Macromolecules, 2011, 44, 1–11 CrossRef.
- G. Couture, A. Alaaeddine, F. Boschet and B. Ameduri, Prog. Polym. Sci., 2011, 36, 1521–1557 CrossRef.
- A. Serov and C. Kwak, Appl. Catal., B, 2010, 98, 1–9 CrossRef.
- E. Antolini and E. R. Gonzalez, J. Power Sources, 2010, 195, 3431–3450 CrossRef.
- F. Bidault, D. J. L. Brett, P. H. Middleton and N. P. Brandon, J. Power Sources, 2009, 187, 39–48 CrossRef.
- T. W. Xu, J. Membr. Sci., 2005, 263, 1–29 CrossRef.
- B. Zhang, B. R. Kaspar, S. Gu, J. Wang, Z. Zhuang and Y. Yan, ChemSusChem, 2016, 17, 2374–2379 CrossRef PubMed.
- K. J. T. Noonan, K. M. Hugar, H. A. Kostalik, E. B. Lobkovsky, H. D. Abruna and G. W. Coates, J. Am. Chem. Soc., 2012, 134, 18161–18164 CrossRef PubMed.
- S. Gu, R. Cai, T. Luo, Z. Chen, M. Sun, Y. Liu, G. He and Y. Yan, Angew. Chem., Int. Ed., 2009, 48, 6499–6502 CrossRef PubMed.
- S. Gu, R. Cai, T. Luo, K. Jensen, C. Contreras and Y. Yan, Chemsuschem, 2010, 3, 555–558 CrossRef PubMed.
- S. Gu, R. Cai and Y. Yan, Chem. Commun., 2011, 47, 2856–2858 RSC.
- H. Long, K. Kim and B. S. Pivovar, J. Phys. Chem. C, 2012, 116, 9419–9426 CrossRef.
- H. Long and B. Pivovar, J. Phys. Chem. C, 2014, 118, 9880–9888 CrossRef.
- H. Long and B. S. Pivovar, ECS Trans., 2014, 64, 1211–1219 CrossRef.
- A. D. Becke, J. Chem. Phys., 1993, 98, 5648–5652 CrossRef.
- Y. Zhao and D. G. Truhlar, Theor. Chem. Acc., 2008, 120, 215–241 Search PubMed.
- A. V. Marenich, C. J. Cramer and D. G. Truhlar, J. Phys. Chem. B, 2009, 113, 6378–6396 CrossRef PubMed.
- R. W. Taft, J. Am. Chem. Soc., 1952, 74, 2729–2732 CrossRef.
- R. W. Taft, J. Am. Chem. Soc., 1952, 74, 3120–3128 CrossRef.
- R. W. Taft, J. Am. Chem. Soc., 1953, 75, 4538–4539 CrossRef.
- C. C. Mitsch, L. D. Freedman and C. G. Moreland, J. Magn. Reson., 1971, 5, 140–144 Search PubMed.
- J. Shorter, Usp. Khim., 1971, 40, 2081–2101 Search PubMed.
Footnotes |
| † Electronic supplementary information (ESI) available: Experimental section and additional characterizations and analysis of data for the studied QP cations. See DOI: 10.1039/c8ra03440k |
| ‡ These authors contribute equally. |
| This journal is © The Royal Society of Chemistry 2018 |


