 Open Access Article
Real time monitoring of the curing degree and the manufacturing process of fiber reinforced composites with a carbon nanotube buckypaper sensor
Shaowei Lu *,
Chenxu Zhao,
Lu Zhang*,
Duo Chen,
Dandan Chen,
Xiaoqiang Wang and
Keming Ma
Faculty of Aerospace Engineering, Shenyang Aerospace University, Shenyang, Liaoning 110136, China. E-mail: lushaowei_2005@163.com; zhanglu2006@foxmail.com
First published on 15th June 2018
Abstract
This paper proposes a flexible and highly sensitive carbon nanotube buckypaper as a sensing layer embedded within a composite for cure monitoring applications. The buckypaper was fabricated with mono-dispersion of multi-wall carbon nanotubes by a spray-vacuum filtration method. Six different curing conditions (with maximum heating temperatures of 120 °C, 108 °C, 95 °C, 90 °C, 85 °C and 75 °C) were designed to characterize and analyze the electromechanical response of the BP sensor to the composite structure, and the results indicated that the temperature coefficient of resistance of buckypaper is associated to the resin curing behavior. The critical value (−7.18 × 10⁻⁴ °C−1) of the temperature coefficient of resistance was determined. Experimental results also show that a stable three-dimensional network of resin molecular chains is formed and that the polymer presents a glassy state when the value of the temperature coefficient of resistance is greater than the critical value. Based on this relationship, a hypothesis was raised that for the complete curing of the resin, the temperature coefficient of resistance of the buckypaper sensor should meet the critical value condition, which was also consistent with the differential scanning calorimetry testing of the curing degree. The buckypaper sensor was found to be sensitive to the curing degree of the resin, and has a promising future in applications in composite manufacturing processes. Moreover, the properties of composite components are indeed able to be improved via the monitoring and optimization of the curing parameters.
1. Introduction
Fiber reinforced polymer (FRP) composites have been applied widely in many areas due to their attractive features of higher specific strength and stiffness, particularly in the aerospace field. The quality and benefits of the final products are influenced by manufacturing processes, and this is mainly due to the method used for the curing of the resin. A low degree of cure will lead to the quality of the products not meeting the required standards, and the continuation of these manufacturing processes will waste a lot of manpower, materials and financial resources.1 To ensure the quality of products, the curing process must be optimized and monitored, and there is an urgent need for a convenient, low-cost and on-line method for measuring the degree of cure.2,3The curing degree of resins or composite prepregs can be assessed using conventional analytical techniques, such as Fourier transform infrared (FTIR) spectroscopy,4 dynamic mechanical analysis (DMA),5 rotating or oscillating rheometry, dielectric analysis (DEA),6 acetone impregnation and so on.1 The most common technique is differential scanning calorimetry (DSC) which is a thermal analysis technique that measures the crystallization and melting behavior or other thermal transitions occurring within a sample when it is heated, cooled or studied at isothermal temperature.7–9 The properties of a resin can be characterized, including the curing degree.10 These methods require expensive equipment, typically work with small samples in size or weight, and some measurements are not very accurate.11,12 A critical problem is that these methods do not meet the requirements of real time on-line analysis of the curing degree. In this work we put forward a new method for real-time monitoring of the manufacturing process and analysis of the curing degree of polymer composites with BP sensors.
Buckypaper (BP) is an outstanding material which contains entangled networks of CNTs formed by van der Waals interactions.13,14 An important milestone in the history of carbon was the discovery of CNTs as one of the most important materials of the 21st century. Due to the use of CNTs as component materials, with their mesoporous structure, and excellent electrical and heat conductivity, CNT-only BP sensors for various applications have become an important topic in the last decade.15 In our previous study, a BP sensor was embedded into polymeric composites for monitoring of the manufacturing process and for gathering information on resin curing, which could be monitored in situ by the resistance change of the BP sensor. Given its embedded nature, this BP sensor has shown good prospects in monitoring the manufacturing process of composites. Meanwhile, the BP sensor can be cut into a desirable shape and placed at any position in a composite component according to requirements. In addition, the optimization of the carbon nanotube dispersion process ensures the stability of the BP sensor.16,17
In this paper, a low cost on-line method for monitoring the curing process and analysis of the curing degree is presented. During the monitoring process, the BP was embedded into composite laminates as a sensor, and the electrical resistance response of the BP sensor was adopted for the on-line analysis of the curing degree of composite structures. Due to its unique sensing network based on carbon nanotubes and good compatibility with composites, the curing degree of composite structures could be detected from the resistance–temperature coefficient of the BP sensor.
2. Experimental
2.1 Materials
The unidirectional glass fiber prepreg (6501/G15000/33%) was supplied by Weihai Guang Wei Composite Co., Ltd., China. Commercial multi-wall carbon nanotubes (TMIMI, Chengdu organic chemicals, Co., Ltd., China Academy of Science, China) with purity higher than 95% were used to fabricated the CNT-only buckypaper sensor.2.2 BP sample preparation
Currently, BP can be fabricated using several different methods, but there are mainly two approaches for preparation. The dry printing process, in which aerosols of CNTs are synthesized via floating-catalyst chemical vapor deposition (CVD) and are directly captured by membrane filters, or deposited on plastic films, is a smart approach for the production of high-quality single-walled carbon nanotube (SWCNT) buckypaper without any damage or contamination.18 A single-walled CNT macrofilm was prepared by the chemical vapor deposition method and showed a sheet electrical resistance of 8.62 Ω Sq−1.19 However, water-based solution methods are much more popular, because of the safety of the processing and materials used. Actually, overcoming the van der Waals forces between carbon nanotubes and consequently breaking up the multi-wall carbon nanotube (MWCNT) bundles into individual tubes is a challenging task in the preparation of a mono-dispersion of MWCNTs.20 In accordance with the previous parameter optimizations, the BP fabrication process was as follows: firstly, 500 mg MWCNTs and 5 ml Triton X-100 were added into 150 ml distilled water and the mixture was sonicated for 1 h. The sonicator (Q700, Sonicator Co., Ltd., USA) was operated in a pulse mode (on 2 s, off 2 s) with the power set at 100 W. After the completion of the dispersion process, the solution was ejected onto a 0.45 mm porous diameter filtration membrane, and filtered using a spray-vacuum filtration setup.21 The sample was dried at 80 °C for 12 h in air on the filter and peeled off afterwards.2.3 Fabrication of composite samples embedded with a BP sensor
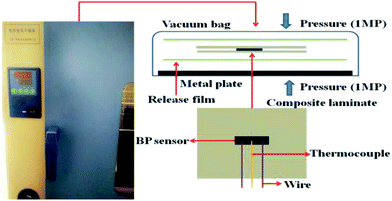
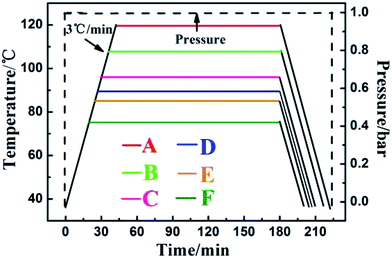
In this paper, the composite materials were manufactured by a vacuum bagging method, as shown in Fig. 1. The resin curing information can be monitored by the embedded BP sensor during the composite manufacturing process. A typical laminate was composed of [010] layer stacked prepregs, which were pre-cut into rectangular shapes of 150 mm × 150 mm. With the pre-determined orientation and position design, the BP was cut into a rectangular strip (30 mm × 10 mm) for use as a sensor. The BP and a K-type thermocouple were manually sandwiched between 5 or 6 layers of the prepreg.22According to these steps, 6 identical samples were prepared and compared under different curing systems, which have been marked A, B, C, D, E and F. First the prepregs embedded with BP sensors were placed in a vacuum bag system that was operated at a pressure of 1 MP and different curing temperatures. Temperature is a noticeable problem, so the samples were scanned over a temperature range from room temperature to the preset temperatures (sample A 120 °C, sample B 108 °C, sample C 95 °C, sample D 90 °C, sample E 85 °C, sample F 75 °C) at a heating rate of 3 °C min−1 to induce the resin curing process, and after that, the temperature was maintained isothermally for 3 h, then heating was stopped and the samples were allowed cool naturally to room temperature. A schematic diagram of the six curing systems at different temperatures is shown in Fig. 2.
2.4 Piezoresistivity evaluation of the BP sensors in resin phase change characterization
The sensitivity of the BP sensor is higher, and previous studies mentioned that BP can be infiltrated with alcohol and acetone. BP had different resistance responses to solvent penetration processes due to their different volatilization rates.21 Hence, as soon as any minor change occurs in the internal structure, the resistance changes sharply. In this paper, the direct current (DC) electrical resistance conductivities of the BP sensors were obtained using commercial four-probe resistance measuring apparatus (RTS-8, 4 PROBESTECH, China), which is an established method for measuring the electrical properties of solids and thin films in material science.23,24 The relative resistance change ΔR/R0 is used to describe the sensitivity of the BP sensors, where ΔR and R0 are resistance change and initial resistance at room temperature. The initial electrical resistance of the BP sensor was 2.26 Ω. In principle, the contact resistance was minimized by using silver paste as electrodes, and the temperature of the BP composite was measured using a thermocouple (TT-K-36, OMEGA, Co., Ltd., USA). To examine the temperature sensitivity, the thermocouple was placed next to the sensor.2.5 Curing degree measured using a DSC method
The curing degree of the epoxy resin was measured using TA Instruments Q100 Differential Scanning Calorimetry (DSC). The uncured composites were tested at a scanning rate of 5 °C min−1 from 30 °C to 230 °C to calculate the total heat of the complete reaction (HT). The residual reaction heat (Hr) for a sample cut from the middle of the laminate was thus obtained. The curing degree α of the composites was calculated:
 | (1) |
3. Results and discussion
3.1 Characterization of mono-disperse MWCNTs, BP and its composites
Through the previous study, a uniform and stable MWCNT mono-dispersion (Fig. 3a) was obtained by parameter optimization.25 The image shows a CNT suspension in water which has been proven to be stable for at least four weeks. The typical dispersion and morphology are shown in Fig. 3a and b. These TEM images reveal that the CNTs are no longer agglomerated. The TEM images show that the position and morphology of the MWCNTs remained intact after four weeks.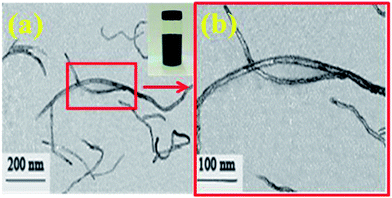 | ||
| Fig. 3 Optical image of aqueous CNTs and TEM image of disentangled CNTs in aqueous suspension (a), (b) TEM micrographs of the CNTs. | ||
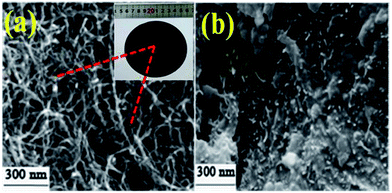
The sensing capabilities, micro-structure and quality of the BP, which was fabricated through a spray-vacuum filtration method, were ensured by the uniform and stable MWCNT mono-dispersion. Fig. 4 shows the macroscopically observable BP, the SEM morphology of the BP and the BP embedded into the composite after the normal curing process.
Intuitively, the surface smooth BP (Fig. 4a illustration) with thickness of 55 μm, when embedded into composite, will not destroy its mechanical properties. The pore structure and conductive entangled networks, which were formed by carbon nanotubes under the action of van der Waals interactions, can be observed in Fig. 4a. The SEM image of the BP composite (Fig. 4b) shows that the resin penetrated into the BP pore structure, and therefore the BP embedded into the composite exhibited good compatibility with the resin matrix.
3.2 The conducting mechanism of the BP sensor
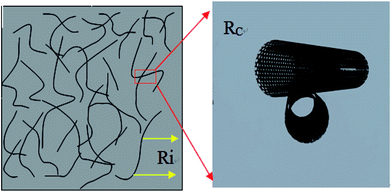
BP is a porous material with a 3D conductive network formed by the interaction of carbon nanotubes. The sensing network is complex and workers in this field have divided the resistance into two parts (Fig. 5) as follows: (1) the carbon nanotube structure itself gives intrinsic resistance; (2) contact resistance is formed by carbon nanotubes interacting with each other. When the distance between the resin impregnated carbon nanotubes is relatively close, due to the quantum tunneling effect, the electrons on the carbon nanotubes can break through the barrier and transfer to the neighboring carbon nanotubes, thus forming contact resistance,18 as shown in Fig. 5.This can be expressed using the formula
 | (2) |
3.3 Response of BP resistance to temperature
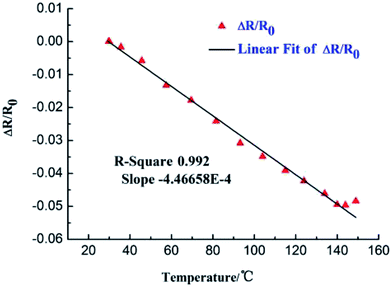
Due to drastic temperature differentials during operation, it is important to understand the effects of temperature on a sensor’s electrical properties. For the response of the BP sensor’s resistance to temperature (30 °C to 150 °C), an example of a highly linear electrical response to the applied monotonically increasing temperature profile is shown in Fig. 6. The slope has a gradient of −4.46 × 10⁻⁴, the fitting degree is 0.992, and the temperature sensing properties of the BP sensor are similar to those reported in the literature.18 This characteristic response has been studied and a mathematical model has been developed to take this behavior into account, which is given in the equation:
 | (3) |
3.4 Curing process monitoring with BP sensor
During the composite manufacturing process, the real-time resistance change of the embedded BP sensor provides valuable insights to reveal the resin curing process. During the experimental process, BP sensors are embedded into composite samples to monitor the curing process at different cure cycles, cycles A, B, C, D, E and F, which include three stages: (1) temperature ramping from 35 °C to the preset temperature (120 °C, 108 °C, 95 °C, 90 °C, 85 °C and 75 °C, respectively); (2) isothermal heating at the preset temperature for 3 h; (3) natural cooling to room temperature. Regardless of the different curing cycles, the general features of these three processing stages were reliably captured by the real-time resistance change of the BP sensor.Fig. 7 shows the temperature and relative resistance of cycles A, B, C, D, E and F, respectively. At the first stage, the relative resistance changes were −4.5 × 10⁻³, −4.1 × 10⁻³, −14 × 10−3, −4.6 × 10⁻³, −13 × 10−3, −3.6 × 10⁻³, when the temperature was increased from 35 °C to 120 °C, 108 °C, 95 °C, 90 °C, 85 °C and 75 °C, respectively. As the temperature ramped up to 120 °C, 108 °C, 95 °C, 90 °C and 85 °C, during stage 2, a rapid resistance increase of the BP sensor was accordingly observed. The resistance increase was as high as 2.48, 2.61, 2.35, 2.46, 2.45 and 2.47, respectively for the BP sensors in the glass polymer composite. In the subsequent isothermal stage, stage 3, the sensor resistance initially decreased, then gradually approached a stable value at the end of stage 3. In the cooling stage, as the temperature decreased, the relative resistance increased linearly at a relative low speed.
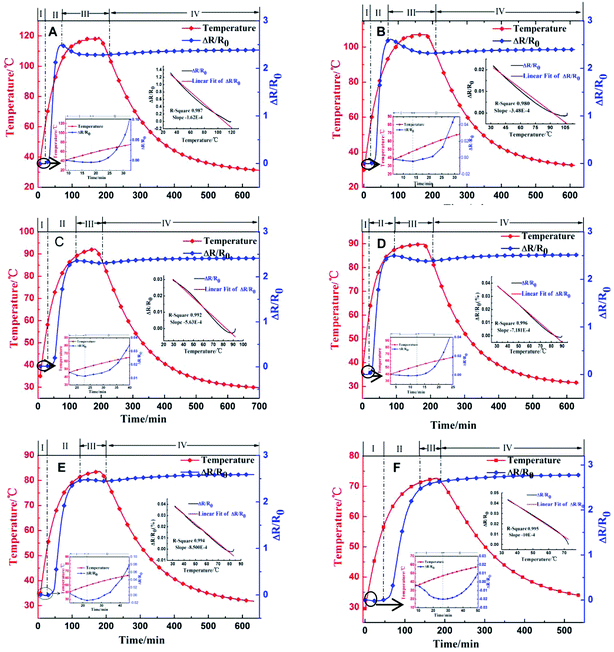 | ||
| Fig. 7 Temperature, and relative resistance of cycle A, cycle B, cycle C, cycle D, cycle E and cycle F. | ||
Compared with the other cure cycles, the relative resistance change curve of cycle F showed a similar trend in variation at stage 1. While, after stage 1 and during the isothermal stage, the resistance of the BP sensor increased as the curing process proceed.
Due to the components of the material and the pore structure, the BP sensor was very sensitive for the capture of the resin-infiltration networks of the CNTs. In addition, the relative resistance of the BP sensor was related to the phase change of the resin matrix during the composite manufacturing process. In stage 1, when the temperature was low, the matrix viscosity was still high and flow was difficult. As such, there was no resin infiltrated into the BP sensor. The small intrinsic negative temperature coefficient (NTC) of resistance contributes to this phenomenon.18 In stage 2, the resin viscosity decreases with temperature ramping. This allows the resin molecules to readily infiltrate into the networks of CNTs, to cause their expansion, and even to break the nanotube junctions. Thus, the sensor resistance shows a significant increase. As the curing process proceeds, the increase in the cross-linking density causes a drastic increase of the viscosity of the system as well as shrinkage of the matrix.27,28 Consequently, the resin infiltrated MWCNT network accordingly shrinks to cause the sensor resistance decrease at the beginning of stage 3.29 During the isothermal heating of stage 3, the cross-linked resin network is fully developed to stabilize the sensor resistance. Resin infiltration and curing shrinkage are shown in Fig. 8.29 However, for cycle F, after stage 1 and before the cooling stage, the variation trend of the resistance of the BP sensor is different. Using a lower temperature, as the time increases, led to a weak cross-linking reaction, and according to our present work, the resistance of the BP sensor decreased due to the shrinking of the resin causing solidification. While the slightly cross-linked resin was sensitive to temperature, the relatively stronger movement and relaxation of the resin segment destroyed the conductive network of the BP at 75 °C. Therefore, the resistance of the BP kept increasing before the cooling stage.
 | ||
| Fig. 8 MWCNT buckypaper's structure to have variable electrical conductivity at (a) bare MWCNT buckypaper (b) resin inflation process and (c) the curing process. | ||
For the cooling stage (stage 4), as mentioned in the previous section, because of the properties of carbon nanotubes, the temperature decreased and the resistance increased.
In other words, the intrinsic NTC effect of the MWCNT network plays the leading role. Certainly, the thermal expansion of the fully cured composite could also contribute to the sensor resistance change in stage 4. However, due to the relatively small thermal expansion coefficient of the fully cured epoxy/glass composite, this effect is negligible.
3.5 Resistance–temperature coefficient and curing degree
The curing degree of the composites is different under the different curing processes and the resin with different curing degrees have different responses to temperature. During the test, the temperature responses of the embedded BP sensors during the cooling stage of the different cure cycles were not identical. Hence, the concept of a temperature resistance coefficient (TCR) is introduced in this paper. As long as the TCR is definite, the degree of cure of a composite can be determined by a certain law.In the six sets of curing cycles, different TCR values can be obtained at the cooling stages of the different curing conditions. The TCR indicates the relative change in the resistance of a material when the temperature changes as a unit of temperature. The formula is expressed as:
| TCR = ΔR/(R0ΔT) | (4) |
In the cooling phase, the relationship between temperature and relative resistance is shown in Fig. 7. As the temperature decreases, the resistance increases linearly. The fit and slope TCR of the different curing cycles and the degree of cure mentioned above are shown in Table 1.
| Temperature/°C | 120 | 108 | 95 | 90 | 85 | 75 |
| Slope value | −1.62 × 10⁻⁴ | −3.48 × 10⁻⁴ | −5.63 × 10⁻⁴ | −7.18 × 10⁻⁴ | −8.50 × 10⁻⁴ | −10.00 × 10⁻⁴ |
| Adj. R-squared | 0.987 | 0.980 | 0.992 | 0.996 | 0.994 | 0.995 |
| Degree of cure % | 1 | 0.993 | 0.988 | 0.976 | 0.814 | 0.799 |
Fig. 9 shows the relationship between the curing degree and the TCR. Absolute values of TCR are on the X axis, and the curing degree is on the Y axis. From the curve, we find that the temperature is negatively related to the TCR, and the higher of the absolute value of the TCR, the lower the curing degree. Moreover, there is a jump in the curve between 85 °C and 90 °C.
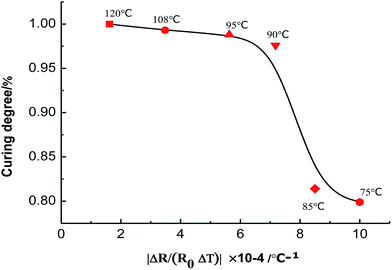 | ||
| Fig. 9 Curve of absolute values for the curing degree against the resistance temperature coefficient. | ||
In this study, a hypothesis that there is a relationship between the absolute TCR values of BP sensors and the curing degree of their composites was presented. Once the TCR is determined, the curing degree of composites can be obtained from the curve. A lower curing degree causes a lower cross-link density of the resin, thus, the entire resin network is more sensitive to changes in temperature. With the change in temperature, the chain relaxation of the resin network with a low curing degree is more obvious, and there is greater impact on the conductive network of BP because the resin and BP have good compatibility. Therefore, the lower the curing degree, the higher the absolute value of TCR for the BP sensor. This means that BP sensors embedded in the composite are more sensitive to temperature. From the jump in the curing degree from the curve, it is easy to see that the minimum curing temperature is 90 °C, and the corresponding TCR is −7.18 × 10⁻⁴ °C−1. When the TCR value is below −7.18 × 10⁻⁴, the resin chain segment molecules are basically not moving, and form a stable three-dimensional cross-linked network inside, meanwhile, the curing is basically complete.
In practical engineering, the curing degree of the composite can be obtained by monitoring the TCR value in the curing process of the composite. By adjusting the curing system of composite materials, the TCR of BP was optimized, and this improved the curing degree of the composites and improved the manufacturing quality of the composites. In addition, this method can be used in process monitoring and allows control under different positions, different thicknesses and different process conditions, which are not available by other methods.
4. Conclusions
A flexible and highly sensitive BP sensor was fabricated by a spray-vacuum filtration method with mono-dispersion of MWCNTs. By using vacuum bagging and prepreg laminates as examples, the embedded BP sensor was able to provide in situ resin curing information during the manufacturing process, which is highly valuable and critical for quality assurance of the host composite structures. In this paper, six different curing cycles were formulated, and six sets of TCR data were obtained during cooling. Through the relationship between the absolute value of TCR and the curing degree curve, our results indicate that the curing degree of the material can be known as long as the TCR is determined. When the absolute value of the TCR is below the critical value of 7.18 × 10⁻⁴, the stable three-dimensional network is formed and the interior has reached the glass state. This means that curing is basically completed.Therefore, the degree of cure of composite materials is able to be measured on-line by this novel BP sensor, which presents great potential applications. Moreover, in actual production, the curing system can be controlled most appropriately by measuring the TCR value, which can save energy and improve quality.
Conflicts of interest
There are no conflicts of interest to declare.Acknowledgements
This work was financially supported by National Natural Science Fund (11602150, U1733123); Aeronautical Science Foundation (2017ZE54029); Shenyang science project (18-013-0-23); Natural science foundation of Liaoning Province (20170540695); Scientific Research Fund for Public Welfare of Liaoning Province (20170014).References
- M. K. Moghaddam, A. Breede, A. Chaloupka, A. Bödecker, C. Habben and E. M. Meyer, et al., Design, fabrication and embedding of microscale interdigital sensors for real-time cure monitoring during composite manufacturing, Sens. Actuators, A, 2016, 243, 123–133 CrossRef.
- M. Rudolph, C. Naumann and M. Stockmann, Degree of Cure Definition for an Epoxy Resin Based on Thermal Diffusivity Measurements, Mater. Today, 2016, 3, 1144–1149 CrossRef.
- M. Erdmann, V. Trappe, H. Sturm, U. Braun and E. Duemichen, Cure conversion of structural epoxies by cure state analysis and in situ cure kinetics using nondestructive NIR spectroscopy, Thermochim. Acta, 2017, 650, 8–17 CrossRef.
- J. Zhang, T. Li, H. Wang, Y. Liu and Y. Yu, Monitoring extent of curing and thermal–mechanical property study of printed circuit board substrates, Microelectron. Reliab., 2014, 54, 619–628 CrossRef.
- W. Stark, M. Jaunich and J. Mchugh, Dynamic Mechanical Analysis (DMA) of epoxy carbon-fibre prepregs partially cured in a discontinued autoclave analogue process, Polym. Test., 2015, 41, 140–148 CrossRef.
- M. Xie, Z. Zhang, Y. Gu, M. Li and Y. Su, A new method to characterize the cure state of epoxy prepreg by dynamic mechanical analysis, Thermochim. Acta, 2009, 487, 8–17 CrossRef.
- L. A. Khan, A. Nesbitt and R. J. Day, Hygrothermal degradation of 977-2A carbon/epoxy composite laminates cured in autoclave and Quickstep, Composites, Part A, 2010, 41, 942–953 CrossRef.
- M. Rudolph, C. Naumann and M. Stockmann, Degree of Cure Definition for an Epoxy Resin Based on Thermal Diffusivity Measurements ☆, Mater. Today, 2016, 3, 1144–1149 CrossRef.
- A. M. Youssef, A. El-Gendy and S. Kamel, Evaluation of corn husk fibers reinforced recycled low density polyethylene composites, Mater. Chem. Phys., 2015, 152, 26–33 CrossRef.
- G. Kister and E. Dossi, Cure monitoring of CFRP composites by dynamic mechanical analyser, Polym. Test., 2015, 47, 71–78 CrossRef.
- J. A. Quintana, P. G. Boj, J. M. Villalvilla, M. A. Diaz-Garcia, J. Ortiz and L. Martin-Gomis, et al., Determination of the glass transition temperature of photorefractive polymer composites from photoconductivity measurements, Appl. Phys. Lett., 2008, 92, 3267 CrossRef.
- V. M. Yurov, V. C. Laurinas, E. N. Eremin and M. S. Gyngazova, Determination of glass transition temperature for polymers by methods of thermoactivation spectroscopy, Mater. Sci. Eng., 2016, 110, 012018 Search PubMed.
- J. Y. Oh, S. J. Yang, J. Y. Park, T. Kim, K. Lee and Y. S. Kim, et al., Easy Preparation of Self-Assembled High-Density Buckypaper with Enhanced Mechanical Properties, Nano Lett., 2015, 15, 190 CrossRef PubMed.
- M. Endo, H. Muramatsu, T. Hayashi, Y. A. Kim, M. Terrones and M. S. Dresselhaus, Nanotechnology: ‘buckypaper’ from coaxial nanotubes, Nature, 2005, 433, 476 CrossRef PubMed.
- E. Khaled, M. S. Kamel, H. N. Hassan, A. A. Haroun, A. M. Youssef and H. Y. Aboul-Enein, Novel multi walled carbon nanotubes/beta-cyclodextrin based carbon paste electrode for flow injection potentiometric determination of piroxicam, Talanta, 2012, 97, 96–102 CrossRef PubMed.
- J. Zhang, D. Jiang, H. X. Peng and F. Qin, Enhanced mechanical and electrical properties of carbon nanotube buckypaper by in situ cross-linking, Carbon, 2013, 63, 125–132 CrossRef.
- J. Li, Y. Zhu, X. Wang, N. Wang and J. Zhang, Light-induced vibration characteristics of free-standing carbon nanotube films fabricated by vacuum filtration, J. Appl. Phys., 2014, 116, 1753 Search PubMed.
- B. R. Loyola, Y. Zhao, K. J. Loh and V. L. Saponara, The electrical response of carbon nanotube-based thin film sensors subjected to mechanical and environmental effects, Smart Mater. Struct., 2013, 22, 025010 CrossRef.
- Y. L. Li, I. A. Kinloch and A. H. Windle, Direct spinning of carbon nanotube fibers from chemical vapor deposition synthesis, Science, 2004, 304, 276 CrossRef PubMed.
- S. Lu, D. Chen, X. Wang, X. Xiong, K. Ma and L. Zhang, et al., Monitoring the glass transition temperature of polymeric composites with carbon nanotube buckypaper sensor, Polym. Test., 2017, 57, 12–16 CrossRef.
- S. Lu, D. Chen, X. Wang, X. Xiong, K. Ma and L. Zhang, et al., Monitoring the manufacturing process of glass fiber reinforced composites with carbon nanotube buckypaper sensor, Polym. Test., 2016, 52, 79–84 CrossRef.
- C. Boller, F. K. Chang and Y. Fujino, Encyclopedia of Structural Health Monitoring, 2009, vol. 29, pp. 222–229 Search PubMed.
- T. Ansbæk, D. H. Petersen, O. Hansen, J. B. Larsen, T. M. Hansen and P. Bøggild, Fundamental size limitations of micro four-point probes, Microelectron. Eng., 2009, 86, 987–990 CrossRef.
- R. Lin, D. H. Petersen, F. Wang, B. R. Yates, K. S. Jones and O. Hansen, et al., Junction leakage measurements with micro four-point probes, Ion Implantation Technology, 2012, pp. 175–178 Search PubMed.
- S. Lu, D. Chen, X. Wang, J. Shao, K. Ma and L. Zhang, et al., Real-time cure behaviour monitoring of polymer composites using a highly flexible and sensitive CNT buckypaper sensor, Compos. Sci. Technol., 2017, 152 Search PubMed.
- G. Schuszter, E. S. Bogya, D. Horváth, Á. Tóth, H. Haspel and Á. Kukovecz, Liquid droplet evaporation from buckypaper: On the fundamental properties of the evaporation profile, Microporous Mesoporous Mater., 2015, 209, 105–112 CrossRef.
- P. K. Mallick, Fiber-Reinforced Composites: Materials, Manufacturing, And Design, 1993, p. 2 Search PubMed.
- S. Luo, W. Obitayo and T. Liu, SWCNT-thin-film-enabled fiber sensors for lifelong structural health monitoring of polymeric composites – from manufacturing to utilization to failure, Carbon, 2014, 76, 321–329 CrossRef.
- S. Luo and T. Liu, SWCNT/Graphite Nanoplatelet Hybrid Thin Films for Self-Temperature-Compensated, Highly Sensitive, and Extensible Piezoresistive Sensors, Adv. Mater., 2013, 25, 5650–5657 CrossRef PubMed.
| This journal is © The Royal Society of Chemistry 2018 |

