 Open Access Article
Hydrodynamic electrospray ionization jetting of calcium alginate particles: effect of spray-mode, spraying distance and concentration†
Sven Rutkowskia,
Tieyan Si*a,
Meiyu Gaibc,
Johannes Frueh *ac and
Qiang He
 *a
*a
aKey Lab of Microsystems and Microstructures Manufacturing, Micro/Nanotechnology Research Center, Harbin Institute of Technology, Yikuang Street 2 B1, Harbin 150080, P. R. China. E-mail: tieyansi@hit.edu.cn; Johannes.Frueh@hit.edu.cn; qianghe@hit.edu.cn; Fax: +86045186403605
bSchool of Engineering and Materials Science, Queen Mary University of London, Mile End, Eng, 215, London E1 4NS, UK
cNational Research Tomsk Polytechnic University, 634050 Tomsk, Russian Federation
First published on 4th July 2018
Abstract
Hydrodynamic electrospray ionization jetting was applied for generating and characterizing calcium cross-linked alginate microparticles. These microparticles show different diameters and aspect ratios for three electrospray modes (dripping, conejet and multijet modes), four spraying distances (5, 10, 15 and 20 cm), and six spraying concentrations. Comparing the three different electrospray modes, we found that the conejet mode results in the smallest particle diameters, lowest aspect ratio and smallest variations over the parameter space mentioned above. For all spraying modes, the resultant particle diameters become independent of the spraying distance at a sprayed solute concentration ≥ 2.5%. The aspect ratio of microparticles varies significantly for different spraying modes and distances. An increasing aspect ratio of all spray modes was determined for sodium alginate spraying concentrations ≤ 1.5% and spraying distances of 20 cm; this phenomenon can be explained with the chain ejection effect. This systematic investigation offers a basic database for industrial applications of hydrodynamic electrospray ionization.
Introduction
Electrospray (ES) was introduced at the end of 19th century and first patented by Cooley in 1903.1 This patent describes the dispersion of charged fluids of various viscosities and the ability to produce filaments, which were “hardened” on different surfaces such as gelatine and collodion. Later on, Zeleny described the general electrospray process and its instabilities,2,3 which occur during the spraying process of highly charged liquids. ES was developed further into the electrospray ionization (ESI) technique by Dole in 1968.4 ESI transfers charged liquids into the gas phase to keep molecular structures intact. In the 1980s, this ESI method was developed into the gentle ionization technique for mass spectrometry (MS) and ion mobility spectrometry (IMS) by Fenn,5–7 who received the Nobel prize in Chemistry in 2002: “for the development of methods for identification and structure analyses of biological macromolecules”.8 Today the ESI method is well known and mostly used in analytic chemistry. ESI is an affordable and gentle ionization method for MS, particle production and IMS.9,10Nowadays, the hydrodynamic electrospray ionization jetting (HESIJ) method is commonly used for producing hydrogels.18 Hydrogels have wide applications in many different fields ranging from food production to anti-biofouling. Calcium alginate (Ca-Alg) is one of the most commonly used hydrogels.16,17 As polyelectrolyte particles and calcium cross-linked alginate hydrogels in the colloidal scale are used for: drug delivery,18,19 colloidal motors,20,21 food industry16 and anti-biofouling.17 Polyelectrolyte particles are commonly produced in wet chemical synthesis.22 Xie et al. (2015) mentioned that HESIJ is able to produce alginate particles whose diameter ranges from 0.15 to 2 mm (ref. 11–15) in a large variety of shapes.23 The HESIJ method is realized using single or multi ES needle jetting (so-called electrospray co-jetting).23 HESIJ co-jetting was applied for loading of particles and capsules with drugs or modification of the particle shape.23–27
The main focus of this work is to produce micrometer scaled Ca-Alg hydrogel particles by HESIJ method. The produced Ca-Alg hydrogels have a spherical, cylindrical or more complex geometry. Average particle sizes and aspect ratios of the electrosprayed Ca-Alg particles depend on the spraying conditions. The resultant particles were investigated over the following parameters space: ES modes (used in short term version as spray modes): dripping mode, conjet mode and multijet mode;28 applied ES voltage UES at the ES needle tip, which were calculated as the electrical field EN; distance between the ES needle and the counter electrode with the electrolyte liquid surface (spraying distance) and concentration of the spraying fluid sodium alginate (Na-Alg).
The Ca-Alg particle diameter can be controlled by the concentration of Na-Alg in the electrospray liquid. A high aspect ratio can be produced with large spraying distances.
Methods and materials
Materials
Sodium alginate (Na-Alg) was purchased from Sigma-Aldrich, Dorset, UK (CAS: 9005-38-3) and dissolved in ultrapure water to ethanol absolute = 8![[thin space (1/6-em)]](https://www.rsc.org/images/entities/char_2009.gif) :
:![[thin space (1/6-em)]](https://www.rsc.org/images/entities/char_2009.gif) 2 solution. Ultrapure water was produced with a Purelab Classic from Elga Labwater, Lane End, High Wycombe, UK. Ethanol absolute was purchased from Tianli Chemical Reagent Co., Ltd., Tian Jin City, China. CaCl2 anhydrous was obtained from Heng Xing, Tianjin, China and dissolved in ultrapure water. Polyallylamine hydrochloride (PAH) (MW = 50.000 g mol−1) and fluorescein isothiocyanate (FITC) (MW = 389.38 g mol−1) were purchased from Sigma (St. Louis, USA). FITC was labelled to PAH according to ref. 29 PAH-FITC was used for fluorescence marking and dissolved in ultrapure water at a concentration of 2 g L−1.
2 solution. Ultrapure water was produced with a Purelab Classic from Elga Labwater, Lane End, High Wycombe, UK. Ethanol absolute was purchased from Tianli Chemical Reagent Co., Ltd., Tian Jin City, China. CaCl2 anhydrous was obtained from Heng Xing, Tianjin, China and dissolved in ultrapure water. Polyallylamine hydrochloride (PAH) (MW = 50.000 g mol−1) and fluorescein isothiocyanate (FITC) (MW = 389.38 g mol−1) were purchased from Sigma (St. Louis, USA). FITC was labelled to PAH according to ref. 29 PAH-FITC was used for fluorescence marking and dissolved in ultrapure water at a concentration of 2 g L−1.
Experimental method
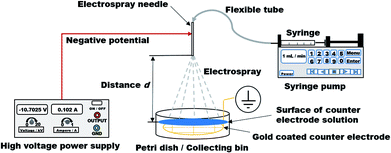
![[V with combining dot above]](https://www.rsc.org/images/entities/i_char_0056_0307.gif) = 1 mL min−1 to the ES needle, which was linked via flexible tube (Longerpump #16, outer diameter: 7 mm, inner diameter: 3 mm, Longer Precision Pump Co., Ltd, Baoding, Hebei, China). A Petri dish (inner diameter: 6.6 mm, height: 11 mm) was placed at distances d, ranging from 5 to 20 cm. This Petri dish was used as a collecting bin for the produced Ca-Alg polyelectrolyte particles. A grounded grid-like gold coated counter electrode (diameter: 6.4 mm, average mesh size: 10 × 14 mm) was placed inside of the collecting bin. The counter electrode had the same diameter like the inner diameter of the used Petri dish. Petri dish was filled with 15 mL CaCl2 (c = 2 mol L−1) for every spray process as a part of the counter electrode. The described setup is graphically displayed in Scheme 1.
= 1 mL min−1 to the ES needle, which was linked via flexible tube (Longerpump #16, outer diameter: 7 mm, inner diameter: 3 mm, Longer Precision Pump Co., Ltd, Baoding, Hebei, China). A Petri dish (inner diameter: 6.6 mm, height: 11 mm) was placed at distances d, ranging from 5 to 20 cm. This Petri dish was used as a collecting bin for the produced Ca-Alg polyelectrolyte particles. A grounded grid-like gold coated counter electrode (diameter: 6.4 mm, average mesh size: 10 × 14 mm) was placed inside of the collecting bin. The counter electrode had the same diameter like the inner diameter of the used Petri dish. Petri dish was filled with 15 mL CaCl2 (c = 2 mol L−1) for every spray process as a part of the counter electrode. The described setup is graphically displayed in Scheme 1.
 | (1) |
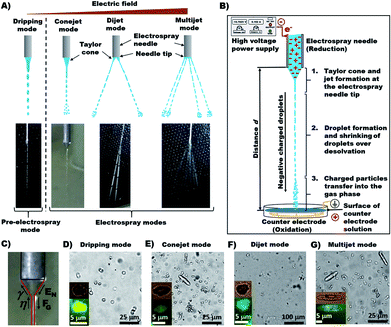
The main forces are the electric field at the capillary tip of the ES needle EN and the gravitational force FG, which are directed oppositely to the surface tension γ and viscosity η of a droplet forming and hanging at the needle tip. Applied EN is the only force which can be changed during ES process and it must be strong enough to form a stable ES jet through prevailing γ and η. While EN is being increased, the spray mode is changing until the multijet mode is reached. The multijet mode itself can get wider and bulkier because of the formation of more jet arms, which emerge from the ES needle tip. Increasing EN makes the multijet mode more “active in behavior” (actively changing the number of jets, positions of jets and jet angles). Occurrence of more jet arms at the needle tip has two possible ways: (a) formation of new jet arms; (b) formation of new jet arms and removal of already existing jet arms. The multijet mode appears to be unstable because of non-regular and unsteady shape. A further increase of EN can result in so-called coronal discharge, which should be avoided, because it can damage the experimental setup. On the other hand, the coronal discharge can cause chemical ionization reactions with sprayed chemicals reactants, due to approaching atmospheric pressure chemical ionization (APCI).
In the second stage, the droplet formation occurs after a certain jet length, where FG is more influential than EN, which is strongest at the ES needle tip. Solvent evaporation causes droplets shrinking on their way to the counter electrode. Droplet shrinking causes the convergence of same charges on droplet surface, due to the amount of charges being constant. Therefore, the droplet surface charge density is increasing. So-called Coulomb explosion occurs, if the surface charge repulsion is higher than the surface tension. This effect is described by the Rayleigh limit:28
 | (2) |
In the third stage, the transfer of charged particles into the gas phase, which is described by three different release models, (a) the ion evaporation model (IEM); (b) the charge residue model (CRM); (c) the chain ejection model (CEM) (ESI, Fig. S3†). The third stage occurs only if the droplets are small enough. The necessary droplet size depends on the type of ions or molecules, which are supposed to be transferred into the gas phase. The CRM model assumes that proteins are available in a folded form in droplets.4 In the process of solvent evaporation, some droplet charges are passing over to the macromolecules, which allows therefore a complete transfer into the gas phase. Winger et al. in 1993 proved CRM effective.34 The second release mechanism is the IEM, which was verified by Thomson and Iribarne.35,36 The IEM is appropriate for droplet radii between 10 Å and 100 Å. In order to perform ion transfer into the gas phase, the applied EN must be strong enough to transfer ions directly from the droplet surface into the gas phase. The ion release from the droplet surface is supported by Coulomb repulsion. Mora demonstrated that the IEM model is applicable for small ions.37 Since 2009, Hogan et al. describe the phenomenon of very high charged proteins in acid conditions.38 The measured protein charge was higher than the charge numbers calculated with the Rayleigh eqn (2). Therefore, the CEM was proposed39 to explains the high charge phenomenon with a higher number of charges transferred to disordered polymers, which are then performing chain extension.40 The transfer of completely solvent-free ions into the gas phase can be explained with these three release mechanisms.
Results and discussion
The electric field at the ES needle tip determines the generation of ES modes. Certain ES modes only occur above a threshold electric field strength, which is denoted here as EN. EN can be calculated with the following equation:28
 | (3) |
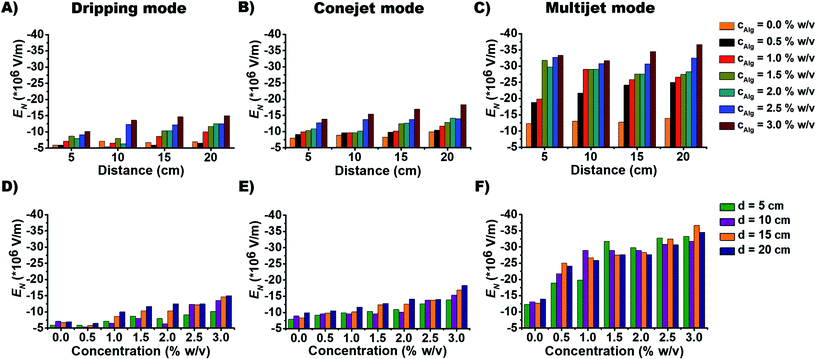
The dependence of EN on alginate concentration cNa-Alg for dripping mode, conejet mode and multijet mode are displayed in Fig. 2D–F. At cNa-Alg ≥ 1.5% w/v, the influence of d on EN decreases. This relation is demonstrated by the difference of EN (ΔEN) against cNa-Alg in ESI, Fig. S4A.† Cohesion and adhesion of droplets at the ES needle tip are increasing proportionally with η and γ, which means a higher EN at higher solute concentration of the spraying liquid is required. This concentration has higher influence on ES modes than the case of spraying distance d at alginate concentrations exceeding 1.5% for the dripping and conejet mode (ESI, Fig. S4A†). For the multijet mode, a cNa-Alg exceeding 0.5% w/v was found to be sufficient to diminish the influence of d on EN. This fact is shown over the difference of EN (ΔEN) against d in ESI, Fig. S4B.† For Na-Alg, η depends significantly on the quantity of guluronic acid (% G-blocks), which means higher values of η and MW for high percentages of G-blocks.41 Considering an increasing cNa-Alg, the viscosity η is increasing linearly. EN is also related to ES mode, as a higher EN is necessary to produce a stable multijet mode compared to a conejet mode or dripping mode (Fig. 2C and 2F).
The geometric shape of the produced particles in different ES modes are obviously different (Fig. 1). The dripping mode generates mostly round Ca-Alg particles (Fig. 1D). The conejet mode produces round and rod-like particles (Fig. 1E), so does the dijet mode (Fig. 1F) and multijet mode (Fig. 1G). While the multijet mode generates more rod-like particles than other modes.
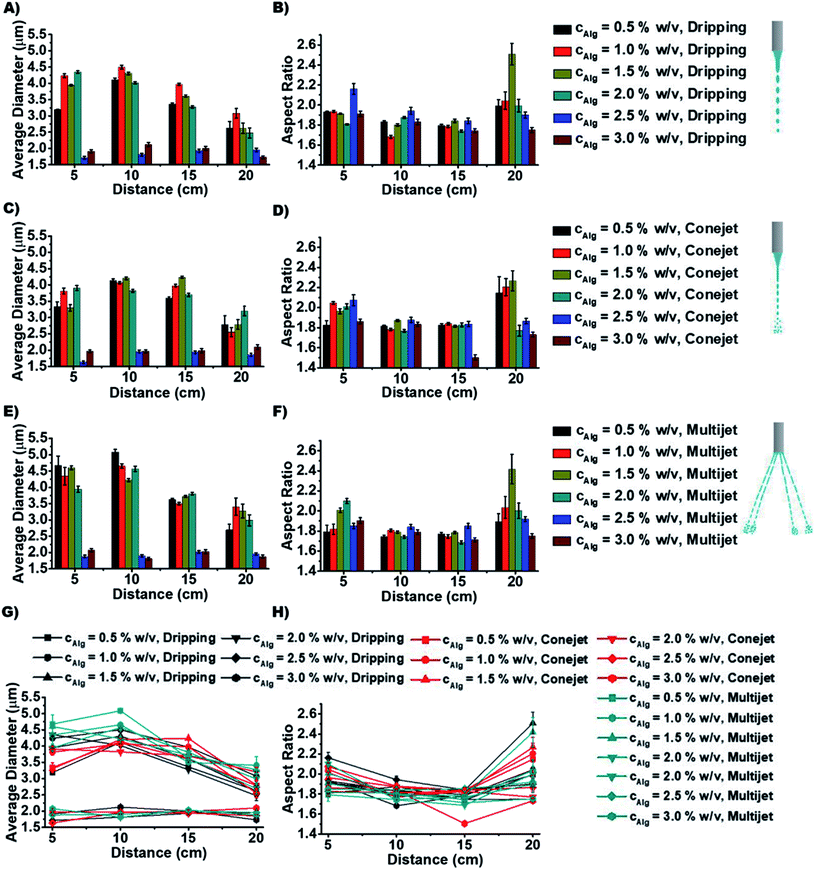
In order to distinguish the produced particle types by different ES conditions, the average diameter (AD) and aspect ratios are measured to study how they depend on spraying distance d (Fig. 3) and concentration cNa-Alg (Fig. 4). The obtained diameters (of all utilized Alg concentrations and spraying distances) of produced particles ranges, (a) from 1.7 to 4.5 μm for dripping mode; (b) from 1.6 to 4.3 μm for conejet mode; (c) from 1.8 to 5.2 μm for multijet mode (Fig. 4). A large range of particle sizes within each spraying mode now is simply accessible by adjusting concentration and spraying distance.
The particle diameter was found to be nearly constant for increasing Na-Alg concentrations from 0.5% w/v to 2.0% w/v in all three ES spraying modes (Fig. 3(A), (C) and (E), 4). Upon surpassing the threshold concentration of 2.0%, a significant decrease of particle sizes is observed. This decrease in size can be explained with the increased density of Alg in the sprayed particles, especially during drying (desolvation) on the way to the counter electrode bath. The fast crosslinking of the chains with calcium ions prevents swelling, resulting frequent occurrence of dense crystals. There is a higher probability to find these crystals in higher Alg concentrations than those in low concentrations (ESI, Fig. S5†). Therefore, we speculate that this process is concentration dependent. The chain density and probability how fast a Ca2+ ion can crosslink between two Alg chains also has a strong influence. Low Alg concentrations resulted frequently into swollen irregular particles (ESI, Fig. S5†). The particle diameter additionally displays a declining trend with increasing spraying distance d (Fig. 2G). This is due to the increased droplet fragmentation upon increasing charge, especially for larger spraying distances. The frequently found exception of the distance at 10 cm showing a larger particle diameter than 5 cm can be understood by a chain alignment effect, which occurs prior to the Coulomb explosion. This chain alignment is expected to cause reduced droplet splitting upon hitting the surface of the counter electrode solution in dripping mode and conejet mode. The spraying distance of 15 cm on the contrary is expected to allow for Coulomb explosions and is therefore causing again smaller particles. At sprayed Na-Alg concentrations ≥ 2.5% w/v, the spraying distance d is not significant for resultant Ca-Alg particle diameter, probably due to increasing viscosity and therefore decreasing droplet fragmentation.
The aspect ratio of micro-particles depends on spraying distance d (Fig. 3(B), (D) and (F)). The aspect ratio (of all utilized Alg concentrations and spraying distances) for different ES modes ranges, (a) from 1.65 to 2.55 for dripping mode, (b) from 1.5 to 2.3 for conejet mode, (c) from 1.7 to 2.45 for multijet mode. Aspect ratios for all three ES modes were found to be independent of d, for d < 20 cm. At 20 cm distance, a tendency towards increased aspect ratio was found (Fig. 3H). At a Na-Alg concentration of 1.5% w/v and d = 20 cm, the largest fractions of rod-like particles (and crystals) were found in all three ES modes (Fig. 3(B), (D), (F) and H)). The average particle diameters and aspect ratios against d with respect to Na-Alg concentrations are displayed in ESI, Fig. S5.† At this concentration, the CEM release mechanism is most likely to occur, causing the highest amount of extended alginate chains. These alginate chains are highly charged, according to CEM conditions. The Ca2+ crosslinking process is producing at these conditions with a high feasibility more rod-like particles. In addition, Ca-Alg particles are less rod-like at lower and higher of cNa-Alg, which is explainable by the competition of CRM and CEM for alginate anion production and release. Additionally, a particle rounding effect can occur due to surface tension of small particles.
The aspect ratio and average diameter of micro-particles also have strong dependence on Na-Alg concentration cNa-Alg (Fig. 4). At spraying distance d of 20 cm, the average particle diameter is in tendency less until cNa-Alg ≤ 2.0% w/v. This tendency is valid for all three spraying modes (Fig. 3 and ESI, Fig. S6A†). The trend for increasing aspect ratios upon increasing spraying distances and its spraying mode dependence is displayed in ESI, Fig. S6B†), which shows significant differences between 5 and 20 cm spraying distance. This dependency correlates with cNa-Alg. The correlation between spraying mode, concentration and spraying distance is shown in ESI, Fig. S7.†
Conclusions
We determined the dependence of the calcium alginate particle diameter on the electrospray modes, spraying distance and concentration of the spraying liquid. The particle diameters are in the range of 1.6 to 5.2 μm. Aspect ratio depends strongly on the spraying mode and spraying distance. In the conejet mode, we determined the smallest particle diameter, and lowest aspect ratio. At concentrations ≥ 2.5%, the particle diameter becomes independent of the spraying distance. At spraying concentrations ≤ 1.5%, an increasing aspect ratio is displayed at 20 cm spraying distance, due to the chain ejection effect. Other spray modes caused a higher variability of resultant particles regarding their diameter and aspect ratio. These results offer basic parameter references for producing and improving sprayed particles for industrial and medical applications. The produced alginate particles are similar to existing polyelectrolyte systems42 which are used for drug delivery. The particle production has been proven repeatable in the mentioned parameter range. We already utilize this approach to produce particles for drug delivery and antibiofouling purposes, which will be a matter of future publications.Conflicts of interest
There are no conflicts to declare.Acknowledgements
National Natural Science Foundation of China (NSFC) (grant No. 21503058 (J. F.)), Supported by Key Laboratory of Micro-systems and Micro-Structures Manufacturing of Ministry of Education, Harbin Institute of Technology (Grant No. 2016KM008 J. F. & 2017KM010 T. S.), as well as Chinese Scholarship Council (2016GXZ167 for S. R. and 201406120038 for M. G.). This research was supported by Tomsk Polytechnic University Competitiveness Enhancement Program project VIU-SEC B.P. Veinberg-210/2018 (J. F., M. G.).Notes and references
- J. F. Cooley, United States Patent and Trademark Office, 1903, 6.
- J. Zeleny, Phys. Rev., 1914, 3, 69–91 CrossRef.
- J. Zeleny, Phys. Rev., 1917, 10, 1–6 CrossRef.
- M. Dole, L. L. Mack, R. L. Hines, R. C. Mobley, L. D. Ferguson, M. B. Alice, L. L. M. Malcolm Dole, L. L. Marck, L. Hines, R. C. Mobley, L. D. Ferguson and M. B. Alice, J. Chem. Phys., 1968, 49, 2240–2249 CrossRef.
- M. Yamashita and B. J. Fenn, J. Phys. Chem., 1984, 88, 4671–4675 CrossRef.
- M. Yamashita and J. B. Fenn, J. Phys. Chem., 1984, 88, 4451–4459 CrossRef.
- J. B. Fenn, J. Biomol. Tech., 2002, 13, 101–118 Search PubMed.
- The Nobel Foundation, The Nobel Prize in Chemistry 2002.
- C. S. Ho, C. W. K. Lam, M. H. M. Chan, R. C. K. Cheung, L. K. Law, L. C. W. Lit, K. F. Ng, M. W. M. Suen and H. L. Tai, Clin. Biochem., 2003, 24, 3–12 Search PubMed.
- Y. Chen, H. Hill Jr and D. Wittmer, Int. J. Mass Spectrom. Ion Processes, 1996, 154, 1–13 CrossRef.
- J. Xie, J. Jiang, P. Davoodi, M. P. Srinivasan and C. H. Wang, Chem. Eng. Sci., 2015, 125, 32–57 CrossRef PubMed.
- J. Xie and C.-H. Wang, Biotechnol. Bioeng., 2007, 97, 1278–1290 CrossRef PubMed.
- H. Moghadam, M. Samimi, A. Samimi and M. Khorram, Particuology, 2008, 6, 271–275 CrossRef.
- A. Tabeei, A. Samimi, M. Khorram and H. Moghadam, J. Electrost., 2012, 70, 77–82 CrossRef.
- H. Park, P. H. Kim, T. Hwang, O. J. Kwon, T. J. Park, S. W. Choi, C. O. Yun and J. H. Kim, Int. J. Pharm., 2012, 427, 417–425 CrossRef PubMed.
- Y. A. Antonov and P. Moldenaers, Food Hydrocolloids, 2012, 28, 213–223 CrossRef.
- J. Frueh, M. Gai, Z. Yang and Q. He, J. Nanosci. Nanotechnol., 2014, 14, 4341–4350 CrossRef PubMed.
- M. N. Antipina and G. B. Sukhorukov, Adv. Drug Delivery Rev., 2011, 63, 716–729 CrossRef PubMed.
- X. Lin, Z. Wu, Y. Wu, M. Xuan and Q. He, Adv. Mater., 2016, 28, 1060–1072 CrossRef PubMed.
- P. H. Colberg, S. Y. Reigh, B. Robertson and R. Kapral, Acc. Chem. Res., 2014, 47, 3504–3511 CrossRef PubMed.
- Z. Wu, X. Lin, Y. Wu, T. Si, J. Sun and Q. He, ACS Nano, 2014, 8, 6097–6105 CrossRef PubMed.
- E. Donath, G. B. Sukhorukov, F. Caruso, S. A. Davis and H. Möhwald, Angew. Chem., 1998, 37, 2201–2205 CrossRef.
- J. Lahann, Small, 2011, 7, 1149–1156 CrossRef PubMed.
- S. Bhaskar, K. Roh, X. Jiang, G. L. Baker and J. Lahann, Macromol. Rapid Commun., 2008, 29, 1655–1660 CrossRef.
- S. Bhaskar, K. M. Pollock, M. Yoshida and J. Lahann, Small, 2010, 6(3), 404–411 CrossRef PubMed.
- M. Rasekh, C. Young, M. Roldo, F. Lancien, J. C. Le Mével, S. Hafizi, Z. Ahmad, E. Barbu and D. Gorecki, J. Mater. Sci.: Mater. Med., 2015, 26, 1–12 CrossRef PubMed.
- M. Rasekh, Z. Ahmad, R. Cross, J. Hernández-Gil, J. D. E. T. Wilton-Ely and P. W. Miller, Mol. Pharm., 2017, 14, 2010–2023 CrossRef PubMed.
- P. Kebarle and U. H. Verkcerk, Mass Spectrom. Rev., 2009, 28, 898–917 CrossRef PubMed.
- N. Kato and F. Caruso, J. Phys. Chem. B, 2005, 109, 19604–19612 CrossRef PubMed.
- M. D. Abràmofff, P. J. Magalhães and S. J. Ram, Biophotonics International, 2005, 11, 36–43 Search PubMed.
- C. A. Schneider, W. S. Rasband and K. W. Eliceiri, Nat. Methods, 2012, 9, 671–675 CrossRef PubMed.
- P. Singh, Master thesis, University of Toledo, 2013, p. 112 Search PubMed.
- G. I. Taylor and A. D. Mcewan, J. Fluid Mech., 1965, 22, 1–15 CrossRef.
- B. E. Winger, K. J. Light-Wahl, R. R. Ogorzalek Loo, H. R. Udseth and R. D. Smith, J. Am. Soc. Mass Spectrom., 1993, 4, 536–545 CrossRef PubMed.
- J. V. Iribarne, J. Chem. Phys., 1976, 64, 2287 CrossRef.
- B. A. Thomson and J. V. Iribarne, J. Chem. Phys., 1979, 71, 4451–4463 CrossRef.
- J. Fernandez De La Mora, Anal. Chim. Acta, 2000, 406, 93–104 CrossRef.
- C. J. Hogan, J. A. Carroll, H. W. Rohrs, P. Biswas and M. L. Gross, Anal. Chem., 2009, 81, 369–377 CrossRef PubMed.
- L. Konermann, E. Ahadi, A. D. Rodriguez and S. Vahidi, Anal. Chem., 2013, 85, 2–9 CrossRef PubMed.
- M. T. Donor, S. A. Ewing, M. A. Zenaidee, W. A. Donald and J. S. Prell, Anal. Chem., 2017, 89, 5107–5114 CrossRef PubMed.
- S. Fu, A. Thacker, D. M. Sperger, R. L. Boni, I. S. Buckner, S. Velankar, E. J. Munson and L. H. Block, AAPS PharmSciTech, 2011, 12, 453–460 CrossRef PubMed.
- D. V. Voronin, O. A. Sindeeva, M. A. Kurochkin, O. Mayorova, I. V. Fedosov, O. Semyachkina-Glushkovskaya, D. A. Gorin, V. V. Tuchin and G. B. Sukhorukov, ACS Appl. Mater. Interfaces, 2017, 9, 6885–6893 CrossRef PubMed.
Footnote |
| † Electronic supplementary information (ESI) available. See DOI: 10.1039/c8ra03490g |
| This journal is © The Royal Society of Chemistry 2018 |


