DOI:
10.1039/C8RA03534B
(Paper)
RSC Adv., 2018,
8, 24970-24981
Functional polyaspartic acid derivatives as eco-friendly corrosion inhibitors for mild steel in 0.5 M H2SO4 solution
Received
24th April 2018
, Accepted 3rd July 2018
First published on 11th July 2018
Abstract
To improve the corrosion inhibition efficiency of eco-friendly polyaspartic acid (PASP) for mild steel in acidic solutions, PASP/N-(3-aminopropyl)imidazole (PD-1) and PASP/N-(3-aminopropyl)-imidazole-co-n-dodecylamine (PD-2) were chemically synthesized by the facile ring-opening reaction of polysuccinimide. Inhibition efficiencies of PD-1 and PD-2 for mild steel in a 0.5 M H2SO4 solution were investigated by electrochemical measurements (electrochemical impedance and polarization) and the weight loss method. In comparison with PASP, PD-1 and PD-2 show improved inhibition efficiencies due to the functional groups. In particular, PD-2 shows superior corrosion inhibition capacity, and the efficiency is up to 94% at a relatively low concentration of 100 mg L−1 at 298 K, as determined by potentiodynamic polarization measurements. Surface analysis of mild steel with PD-2 as an inhibitor clearly indicates that the inhibitor molecules adsorb on the steel surface and efficiently inhibit the corrosion of mild steel. The present work provides very meaningful results in designing and preparing new polymer inhibitors with high inhibition efficiency.
1. Introduction
It is well-known that acidic solutions are widely used in chemical industries such as acid cleaning, de-scaling, pickling, etc., and corrosion inhibitors are indispensable for inhibiting metal corrosion during these industrial processes.1–5 Most well-known acid inhibitors are organic compounds containing heteroatoms (N, S and/or O) and these compounds are active against metal corrosion by adsorbing on the metal surface. Up to now, a variety of corrosion inhibitors containing Schiff base,6,7 pyrimidine,8,9 azoles10–14 and other heterocycles15,16 have been reported. Previous studies have also indicated that organic compounds containing unsaturated bonds17 or long alkyl chains10 showed good corrosion inhibition properties for steel.
With the enhancement of environmental consciousness, designing eco-friendly corrosion inhibitors has gained tremendous momentum.18–22 Due to the features of non-toxicity and high safety, green polymer inhibitors have attracted much attention. An overview on the use of carbohydrate polymers as corrosion inhibitors for metal materials in different media has been summarized by Umoren and Eduok.23 In that article, exudate gums, cellulose, starch, chitosan, etc., and their derivatives were enumerated. Polymeric structures used as corrosion inhibitors for the oil and gas industry have also attracted much attention.24 Recently, Mobin et al. reported on the inhibition performance of polysaccharide from Plantago for carbon steel corrosion in 1 M HCl and an efficiency of 92.53% at 1000 mg L−1 was obtained.25 Amino acid-modified konjac glucomannan was also evaluated as a corrosion inhibitor in 0.5 M HCl solution by Yang et al. and an efficiency of 92.4% was achieved at 2000 mg L−1.26 Notably, large dosages are often necessary to achieve high inhibition efficiencies for most polymers inhibitors.27–29 Therefore, developing new eco-friendly polymer inhibitors with high-efficiency at low concentrations is particularly meaningful.
Polyaspartic acid (PASP) is a well-known, eco-friendly, and biodegradable polymer that exists naturally in the shell of mollusks. Currently, tons of PASP can be obtained by chemical synthesis. PASP is generally considered as a new type of green water treatment agent, particularly as a scale inhibitor.30 In addition, the corrosion inhibition performances of PAPS or derivatives for mild steel,31 WE43 magnesium alloy,32 and A3 carbon steel33 in 3.5% NaCl solution have been studied. Meanwhile, the efficiency of PASP as a pickling corrosion inhibitor for carbon steel in 0.565 M H2SO4 solutions was investigated by Cui et al. and a moderate efficiency of 80.33% was obtained at an extremely high concentration of 6 g L−1 at 283 K.34 Investigations by Qian et al. also showed that the inhibition efficiency of PASP for mild steel in 0.5 M H2SO4 solution was limited when PASP was used independently.35 With addition of I− ion into the test solution, the inhibition efficiency was enhanced because of the synergistic effect. Nevertheless, chemical modification by the introduction of functional groups into the molecular structure may be a more effective pathway to improve the inhibition property of PASP for metals in acid solution.
Based on above analysis, N-(3-aminopropyl)imidazole was first adopted as a modifier to prepare the novel PASP derivative (PD-1) by considering that the group of the imidazole ring has a strong adsorption ability on metal surface.11 Furthermore, n-dodecylamine was adopted as a co-modifier to generate another PASP derivative (PD-2), since it is known that the inhibition efficiency could be enhanced by introducing alkyl chains into the molecular structure of the inhibitor.36 Then, the corrosion inhibition efficiencies of PD-1 and PD-2 for mild steel in 0.5 M H2SO4 were evaluated by electrochemical measurements and weight loss method with concentrations ranging from 5 to 100 mg L−1. To investigate the adsorption type of PD-1 and PD-2 on the steel surface, the thermodynamic parameters of the adsorption isotherms were analyzed. The relationship between the molecular structure and the inhibition mechanism was also discussed.
2. Experimental
2.1. Materials
All reagents were of analytical grade and used without further purification. N-(3-aminopropyl)-imidazole and n-dodecylamine were acquired from Energy Chemical (Shang Hai). Sulfuric acid was purchased from Kaifeng Dongda Chemical Industry Co., Ltd. The composition (wt%) of the selected 20# mild steel sample used in the present work was C (0.17%), Si (0.17%), Mn (0.35%), Cr (0.25%), (Ni 0.30%), Cu (0.25%) and Fe balance, which was purchased from Jiangsu Xinyou Instrument Factory.
2.2. Preparations of PD-1 and PD-2
First, polysuccinimide was synthesized referring a previous literature.30 PD-1 was prepared according to the following procedures. Briefly, polysuccinimide (1.9 g), N-(3-aminopropyl)imidazole (2.5 mL) and distilled water (5 mL) were introduced into a 100 mL three-necked flask. The reaction mixture was heated to 333 K and stirred for 24 h. Then, the mixture was cooled to room temperature and poured into 200 mL of acetone to generate a precipitate. The precipitate was dried under vacuum at 353 K for 24 h to obtain the target PASP derivative (PD-1).
Polysuccinimide (1.9 g), which was pre-dissolved in N, N-dimethylformamide (5 mL), was introduced into a 100 mL round-bottom flask, followed by the addition of N-(3-aminopropyl)-imidazole (1.25 mL) and n-dodecylamine (1.8 g). The resultant mixture was heated to 333 K and stirred for 24 h. Then, the mixture was cooled to room temperature and poured into 200 mL of acetone. The obtained precipitate was dried under vacuum at 353 K for 24 h to obtain another PASP derivative (PD-2). The synthetic routes of PD-1 and PD-2 are shown in Scheme 1.
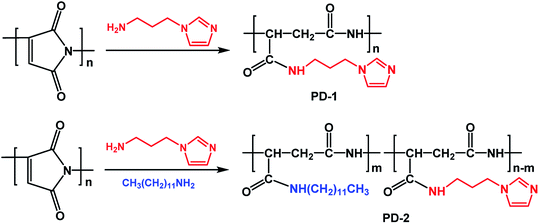 |
| | Scheme 1 Synthetic routes of PD-1 and PD-2. | |
2.3. Structural characterizations of PD-1 and PD-2
Structural characterizations of PD-1 and PD-2 were performed by 1H NMR spectrum (AVANCE 400 MHz NMR spectrometer, Bruker Instruments, Germany) and Fourier transform infrared spectroscopy (VERTEX 70 FTIR spectrometer, Bruker Instruments, Germany).
2.4. Electrochemical measurements
Electrochemical measurements were carried out in a 0.5 M H2SO4 solution without and with (5, 10, 20, 50, 100 mg L−1 of PD-1 and PD-2, respectively) at 298 K using a CHI 660E electrochemical system (Shanghai Chenhua Instrument Co., Ltd). All measurements were carried out in a conventional three-electrode cell assembly. A platinum sheet (2 cm2 area) and saturated calomel electrode (SCE) were utilized as the counter electrode and reference electrode, respectively. The disc-type working electrode (WE) with an exposed area of 1 cm2 was made of 20# mild steel mounted in epoxy resin. Prior to all tests, the surface of the working electrode was ground with polishing paper with abrasive paper (400 grit, 600 grit, 1200 grit, and 2000 grit, Dongguan Golden Sun abrasives CO., Ltd), rinsed with distilled water, degreased with acetone and dried. Then, the working electrode was immersed in the test solution for 1 h to obtain a stable open-circuit potential (OCP). A frequency range of 100 KHz to 0.1 Hz with the amplitude of 10 mV at a stable OCP was applied to the EIS measurements. The impedance data were analyzed using ZView 2 software. Potentiodynamic polarization curves were measured in the potential range of ±250 mV versus OCP at a potential sweep rate of 1 mV s−1. Inhibition efficiencies (IEP and IEE) from the polarization curves and EIS were calculated according to the corrosion current density (icorr) and charge transfer resistance (Rct) values, respectively.
2.5. Weight-loss test
Weight-loss tests were carried out in a 0.5 M H2SO4 solution at 298 K in the absence and presence of various concentrations (5, 10, 20, 50, 100 mg L−1) of PD-1 and PD-2. Prior to all tests, mild steel sheets of 5 × 2.5 × 0.2 cm were washed with water and acetone. After drying and accurate weighing, the mild steel sheets were immersed in 500 mL of a 0.5 M H2SO4 solution for 12 h at 298 K with and without inhibitors. Then, the specimens were taken out and washed with distilled water and acetone; and subsequently dried and weighed again. The experiments were carried out in triplicates to achieve good reproducibility, and the average weight loss was utilized to calculate the corrosion rate (νcorr) and inhibition efficiency (IEW).
2.6. Surface analysis
Scanning electron microscopy (SEM) and energy dispersive X-ray spectroscopy (EDX) measurements of the mild steel surface were performed using a Hitachi model SU 8020 field emission scanning electron microscope (Hitachi, Japan). X-ray photoelectron spectroscopy (XPS) measurements were carried out on an ESCALAB 250Xi XPS system (Thermo Fisher Scientific Corporation, America) employing Al Kα as the incident radiation source (1486.6 eV). The binding energy of C 1s (284.8 eV) was used as a reference.
3. Results and discussion
3.1. Characterizations of PD-1 and PD-2
3.1.1 FTIR spectral analysis. FTIR spectra of synthesized PD-1 and PD-2 are shown in Fig. 1. Compared to the IR spectrum of polysuccinimide shown in other literature,37 the stretching vibration of the carbonyl of imide at 1715 cm−1 disappears. Meanwhile, the strong characteristic peaks at 1655 cm−1 in the spectra of PD-1 and PD-2 are attributed to the carbonyl stretching vibration of amide. These results indicate that the ring-opening reaction of polysuccinimide was performed successfully. The peaks at 1109 and 1084 cm−1 in the spectrum of PD-1 are ascribed to the stretching vibration of the imidazole ring. Therefore, the imidazole group was bonded onto the polymer chain by a ring-opening reaction of N-(3-aminopropyl)imidazole with polysuccinimide. In the IR spectrum of PD-2, apart from the vibrations (1110 and 1086 cm−1) of the imidazole ring, the peaks at 2926 and 2854 cm−1 are ascribed to the asymmetric and symmetric stretching vibrations of the alkyl chain, respectively. As a result, both N-(3-aminopropyl)imidazole and n-hexylamine were involved in the preparation of PD-2.
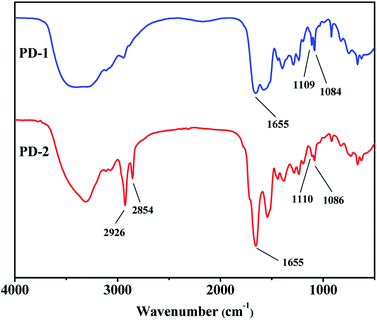 |
| | Fig. 1 FTIR spectra of PD-1 and PD-2. | |
3.1.2. 1H NMR spectral analysis. Fig. 2 shows the 1H NMR spectra of PD-1 and PD-2 in D2O. From the spectrum of PD-1, in addition to the signals of –CH– (δH = 4.2–4.7) and –CH2– (δH = 2.4–3.0) attributed to the PASP chains,38 signals at δH = 7.7, δH = 7.1 and δH = 6.9 are ascribed to various protons in the imidazole ring. Meanwhile, the peaks at δH = 3.9, δH = 3.0 and δH = 1.9 are ascribed to different methylene protons in the N-(3-aminopropyl)imidazole group. In addition to the similar peaks with PD-1, other peaks located at high field in 1H NMR spectrum of PD-2 are attributed to various protons in the n-dodecyl group. Therefore, the imidazole ring and n-dodecyl group are bonded onto the polymer chains in PD-2. Combined with previous analysis of FTIR spectra, it can be concluded that the PASP derivatives, PD-1 and PD-2, were successfully synthesized.
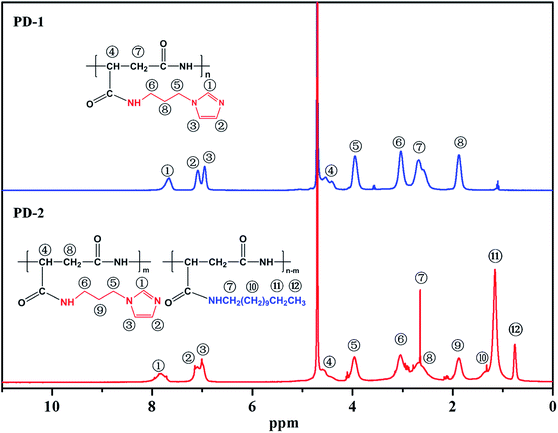 |
| | Fig. 2 1H NMR spectra of PD-1 and PD-2. | |
3.2. Electrochemical measurements
3.2.1. Open-circuit potential (OCP) – time curves. A stable potential without an external current applied on the mild steel working electrode surface is important for potentiodynamic polarization and EIS measurements. Fig. 3 reveals the plots of open circuit potential (versus SCE reference electrode) in 0.5 M H2SO4 solution as a function of immersion time without and with various concentrations of inhibitors at 298 K. For PD-1 and PD-2 at various concentrations, different exposure times were required to achieve a steady OCP value. However, it is clearly seen from Fig. 3 that 1 h was enough to get a steady potential and, therefore, was utilized as the immersion time before potentiodynamic polarization and EIS measurements.
 |
| | Fig. 3 Open circuit potential versus time curves in 0.5 M H2SO4 solution at 298 K without (■) and with different concentrations of PD-1 (a) and PD-2 (b): 5 mg L−1 (●), 10 mg L−1 (▲), 20 mg L−1 (▼), 50 mg L−1 (◆) and 100 mg L−1 (★). | |
3.2.2. Potentiodynamic polarization measurements. The potentiodynamic polarization curves of the mild steel working electrode in 0.5 M H2SO4 solution without and with inhibitors were recorded and are shown in Fig. 4. With PD-1 as an inhibitor, the cathodic curves move toward a lower current density region, while the variations of anodic curves are not obvious. This phenomenon suggests that an efficient adsorption layer on the mild steel surface is formed and the hydrogen ion reduction is retarded.39 It should be stressed that both a noticeable anodic and cathodic shift significantly to lower current densities with PD-2 as an inhibitor, which indicates that PD-2 shows superior efficiency for retarding the corrosion of mild steel in acidic solutions.
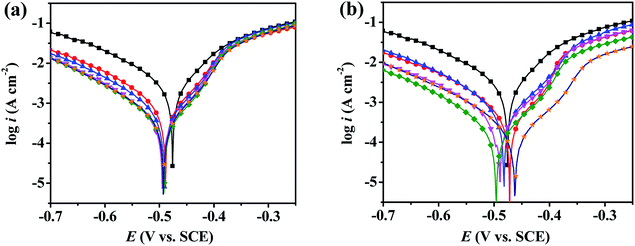 |
| | Fig. 4 Potentiodynamic polarization curves for mild steel in 0.5 M H2SO4 solution without (■) and with different concentrations of PD-1 (a) and PD-2 (b) at 298 K. Inhibitor concentration: 5 mg L−1 (●), 10 mg L−1 (▲), 20 mg L−1 (▼), 50 mg L−1 (◆) and 100 mg L−1 (★). | |
The related electrochemical parameters, such as the corrosion potential (Ecorr), anodic Tafel slope (βa), cathodic Tafel slope (βc), linear polarization resistance (Rp)and corrosion current density (icorr) calculated from the polarization curves, are listed in Table 1. The inhibition efficiency (IEP) and the surface coverage (θ) were calculated according to the following eqn (1) and (2):
| |
 | (1) |
| |
 | (2) |
where
i0corr and
icorr are the current densities of uninhibited and inhibited mild steel working electrodes, respectively. It is seen from
Table 1 that the shift of the
Ecorr (Δ
Ecorr) values is lower than 85 mV in each case, suggesting that PD-1 and PD-2 are mixed-type inhibitors.
40 The value of the current density decreases from 2.232 mA cm
−2 for the blank to 0.621 mA cm
−2 in the presence of 5 mg L
−1 PD-1, and it further decreased to 0.237 mA cm
−2 for 100 mg L
−1 PD-1. The inhibition efficiencies of PD-1 calculated by
eqn (1) are 72.2% and 89.4% at the concentrations of 5 mg L
−1 and 100 mg L
−1, respectively. By comparing the results in other literatures,
34,35 the inhibition efficiency of PD-1 is obviously higher than that of PASP. The enhanced inhibition ability may be ascribed to the bonded functional imidazole ring due to the additional donor–acceptor interaction between the π-electrons and the vacant d-orbitals of Fe atoms.
Table 1 Potentiodynamic polarization parameters extracted from the polarization curves and the corresponding inhibition efficiencies (IEP) of PD-1 and PD-2 at different concentrations in 0.5 M H2SO4 solution at 298 K
| Inhibitor |
C (mg L−1) |
−Ecorr (V vs. SCE) |
βa (mV dec−1) |
−βc (mV dec−1) |
RP (Ω cm2) |
icorr (mA cm−2) |
IEP (%) |
θ |
| Blank |
— |
0.475 |
104.4 |
136.7 |
11.5 |
2.232 |
— |
— |
| PD-1 |
5 |
0.480 |
62.5 |
128.2 |
29.4 |
0.621 |
72.2 |
0.722 |
| 10 |
0.482 |
59.7 |
125.6 |
38.1 |
0.461 |
79.3 |
0.793 |
| 20 |
0.481 |
51.7 |
126.1 |
57.3 |
0.278 |
87.5 |
0.875 |
| 50 |
0.481 |
49.7 |
118.6 |
57.8 |
0.262 |
88.3 |
0.883 |
| 100 |
0.485 |
47.3 |
116.7 |
61.9 |
0.237 |
89.4 |
0.894 |
| PD-2 |
5 |
0.474 |
53.1 |
123.9 |
50.2 |
0.353 |
84.1 |
0.841 |
| 10 |
0.489 |
51.0 |
128.8 |
63.7 |
0.249 |
88.8 |
0.888 |
| 20 |
0.489 |
46.5 |
123.7 |
72.9 |
0.224 |
90.0 |
0.900 |
| 50 |
0.496 |
52.5 |
123.2 |
82.5 |
0.180 |
91.9 |
0.919 |
| 100 |
0.464 |
45.4 |
121.8 |
119.3 |
0.134 |
94.0 |
0.940 |
To minimize the environmental impacts, it is important to develop high-efficiency inhibitors with low dosage. Singh et al. found that an acceptable efficiency (80.7%) of polyacrylamide grafted with okra mucilage for mild steel in 0.5 M H2SO4 solution can be achieved at an extremely low concentration of 5 mg L−1.41 Since it has been reported on that long-chain alkyl substituents greatly benefit the inhibition efficiency of inhibitors,10,42 n-dodecylamine was selected as a co-modifier and another PASP derivative (PD-2) were prepared. Notably, the inhibition efficiency of PD-2 for mild steel in 0.5 M H2SO4 solution was up to 84.1% at a low concentration of 5 mg L−1, and a high efficiency of 94.0% can be achieved at a concentration of 100 mg L−1. In contrast to other polymer inhibitors,25–29,43,44 the PASP derivative PD-2 demonstrates better inhibition efficiency at low concentrations. The limited inhibition efficiency of PASP in 0.5 M H2SO4 solution may be ascribed to the weak interaction of the PASP chains with the metal surface. By introducing functional groups into the PASP chains, the interaction of the polymer molecules with the mild steel surface increases, and thereby leads to the improved inhibition efficiencies.
3.2.3. Electrochemical impedance spectroscopy measurements. The Nyquist plots of the mild steel in 0.5 M H2SO4 solution without and with different inhibitor concentrations are shown in Fig. 5(a and b). The depressed semi-circular shape of the Nyquist plots indicates a non-ideal electrochemical behavior at the solid/liquid interface.45 In addition, the Nyquist plots obtained without and with inhibitors present a capacitive loop at high frequency and an inductive loop at low frequency. The capacitive loop is related to the double-layer capacitance of the solution and electrode interface. Meanwhile, the inductive loop results from the relaxation of the compounds adsorbed on the electrode surface. The diameter of the Nyquist plot increases with increasing inhibitor concentration, indicating that the impedance of the inhibited substrate increases with increasing inhibitor concentration. Meanwhile, the diameter of the semi-circles obeys the order of PD-1 < PD-2 at the same concentrations, which suggests that the most effective adsorption layer on the mild steel surface was formed in the presence of PD-2 in 0.5 M H2SO4 solution, and the aggressive attack by the acidic solution was efficiently blocked.
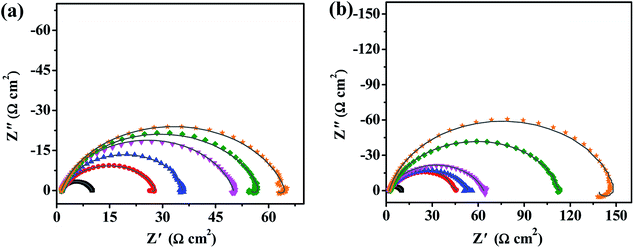 |
| | Fig. 5 Nyquist plots and fitted curves (—) for mild steel in 0.5 M H2SO4 solution without (■) and with different concentrations of PD-1 (a) and PD-2 (b) at 298 K. Inhibitor concentration: 5 mg L−1 (●), 10 mg L−1 (▲), 20 mg L−1 (▼), 50 mg L−1 (◆) and 100 mg L−1 (★). | |
Bode and phase angle curves for mild steel in 0.5 M H2SO4 solution in the absence and presence of inhibitors are displayed in Fig. 6. Only one time constant is observed in the Bode plots, meaning that the corrosion of mild steel in 0.5 M H2SO4 solution is mainly controlled by a charge transfer process. At the interface of the metal and solution, the charge distribution on the metal side is controlled by electrons, whereas it is controlled by the ions on the solution side. Since electrons are much smaller than ions, a differential capacitance is formed rather than an ideal capacitor at the metal/solution interface.46 Therefore, the impedance curves were modeled using an electrical equivalent circuit which is shown in Fig. 7. The fitted curves for the impedance data are shown in Fig. 5 and 6, respectively. The equivalent circuit model is applied to determine the solution resistance (Rs), constant phase element (CPE), charge transfer resistance (Rct), inductance (L) and the inductance resistor (RL). The impedance of the CPE can be described via the following eqn (3):40
where
Y0 is a proportionality factor and
j2 = −1 is an imaginary number.
ω is the angular frequency (in rad s
−1),
n is the CPE exponent (phase shift), and
ω is obtained at the frequency for which the imaginary range of the impedance is a maximum from the following
eqn (4):
13
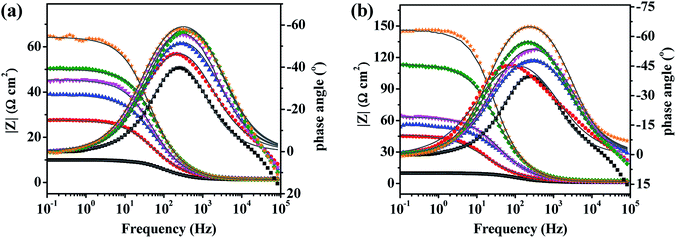 |
| | Fig. 6 Bode plots and fitted curves (—) for mild steel in 0.5 M H2SO4 solution without (■) and with different concentrations of PD-1 (a) and PD-2 (b) at 298 K. Inhibitor concentration: 5 mg L−1 (●), 10 mg L−1 (▲), 20 mg L−1 (▼), 50 mg L−1 (◆) and 100 mg L−1 (★). | |
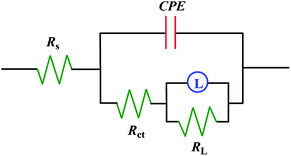 |
| | Fig. 7 Equivalent circuit used to fit the EIS data of mild steel. | |
The inhibition efficiencies (IEE) are calculated using the following eqn (5):
| |
 | (5) |
where
Rct and
R0ct are the charge transfer resistance in the presence and absence of inhibitor, respectively. The relevant electrochemical impedance data obtained from the equivalent circuit are summarized in
Table 2. It is apparent from
Table 2 that the value of
Rct increases with increasing inhibitor concentration, which indicates that more inhibitor molecules absorb on the mild steel surface and the surface coverage is enhanced.
24 In addition, the phase shift value (
n) is almost constant, which indicates that the dissolution mechanism of carbon steel in the solutions with and without corrosion inhibitors is affected by the charge transfer resistance.
13 Under a certain concentration, inhibition efficiencies of two PASP derivatives calculated by
eqn (5) obey the order of PD-2 > PD-1, which is in good agreement with the results of potentiodynamic polarization. The maximum corrosion inhibition efficiency is high as 93.7% in the presence of PD-2 at a low concentration of 100 mg L
−1.
Table 2 EIS parameters and inhibition efficiencies (IEE) of PD-1 and PD-2 at different concentrations in 0.5 M H2SO4 solution at 298 K
| Inhibitor |
C (mg L−1) |
Rs (Ω cm2) |
CPE Y0 ( × 106 Sn Ω−1 cm−2) |
n |
Rct (Ω cm2) |
RL (Ω cm2) |
IEE (%) |
| Blank |
— |
1.31 |
640.9 |
0.84 |
8.64 |
5.0 × 10⁻⁷ |
— |
| PD-1 |
5 |
1.61 |
557.5 |
0.77 |
25.38 |
1.25 |
66.0 |
| 10 |
1.49 |
352.3 |
0.82 |
34.24 |
1.48 |
74.8 |
| 20 |
1.34 |
191.1 |
0.83 |
48.67 |
0.17 |
82.2 |
| 50 |
1.39 |
282.1 |
0.82 |
53.87 |
2.23 |
84.0 |
| 100 |
1.34 |
191.5 |
0.84 |
63.09 |
2.18 |
86.3 |
| PD-2 |
5 |
1.95 |
340.0 |
0.72 |
44.75 |
15.81 |
80.7 |
| 10 |
1.83 |
350.0 |
0.75 |
51.74 |
0.02 |
84.2 |
| 20 |
1.69 |
305.4 |
0.77 |
61.96 |
6.9 × 10⁻⁴ |
86.1 |
| 50 |
2.71 |
164.9 |
0.81 |
110.5 |
2.49 |
92.2 |
| 100 |
1.96 |
112.8 |
0.86 |
136.4 |
11.21 |
93.7 |
3.3. Weight loss measurements
Weight-loss measurement is a classic and highly reliable method to determine the inhibition efficiency of inhibitor. The corrosion rate of mild steel (νcorr, g m−2 h−1) and inhibition efficiency (IEW) are calculated by the following eqn (6) and (7),47 respectively:| |
 | (6) |
| |
 | (7) |
where m0 and m are the weight of mild steel samples before and after immersion in 0.5 M H2SO4 solution, Ai is the exposed area, and Δt is the immersion time. ν0corr and νcorr are the corrosion rates of mild steel samples without and with the addition of inhibitors. The values of vcorr and IEW for PD-1 and PD-2 at different concentrations are summarized in Table 3. By increasing the concentration of the inhibitors from 5 to 100 mg L−1, the corrosion rate of mild steel decreased and inhibition efficiency was gradually enhanced. It is also seen clearly that the corrosion inhibition efficiencies of PD-2 are higher than those of PD-1 for the entire concentration range from 5 to 100 mg L−1, and this trend is consistent with the results of the electrochemical measurements discussed in the previous section.
Table 3 Corrosion parameters determined from weight-loss tests in 0.5 M H2SO4 solution in the absence and presence of various concentrations of inhibitor at 298 K
| Inhibitor |
C (mg L−1) |
vcorr (g m−2 h−1) |
IEW (%) |
| Blank |
— |
37.99 |
— |
| PD-1 |
5 |
12.23 |
67.8 |
| 10 |
10.75 |
71.7 |
| 20 |
9.42 |
75.2 |
| 50 |
8.28 |
78.2 |
| 100 |
6.04 |
84.1 |
| PD-2 |
5 |
7.10 |
81.3 |
| 10 |
6.57 |
82.7 |
| 20 |
6.42 |
83.1 |
| 50 |
5.01 |
86.8 |
| 100 |
3.42 |
91.0 |
3.4. Adsorption isotherm
It is well known that organic molecules reduce the corrosion of metal in acidic solutions by adsorbing on the metal surface. The adsorption behavior between the inhibitor molecules and metal surface can be investigated from the adsorption isotherms.48 In this section, adsorption isotherms, including Frumkin, Temkin and Langmuir isotherms, are applied to fit the surface coverage (θ) values at different concentrations. According to these isotherms, the values of θ as a function of concentrations (C) are represented via the following eqn (8)–(10).49| |
 | (8) |
| | |
exp(−2aθ) = KadsC (Temkin isotherm)
| (9) |
| |
 | (10) |
where θ is the surface coverage, which is obtained from inhibition efficiency values and is listed in Table 1; C is the concentration of the inhibitor; Kads is the adsorption equilibrium constant; and “a” is the molecular interaction parameter.
The functional relationships between θ and C are plotted and shown in Fig. 8 (a–c). The correlation coefficient (R2) is adopted to explore the isotherm that best matches the experimental data. The best fitted straight line is obtained from the plot of C/θ against C, as shown in Fig. 8(c). The value of R2 is over 0.999 for PD-1 and PD-2, respectively. Therefore, the Langmuir adsorption isotherm is confirmed as the best adsorption model. Then, the adsorption–desorption equilibrium constants (Kads) are obtained from the intercepts of the straight lines, and the results are listed in Table 4. The higher value of Kads suggests the higher coverage rate and thus a better protective layer of the inhibitors on the mild steel surface.40,48 As shown in Table 4, the value of Kads of PD-2 is higher than that of PD-1, which is in accordance with the trend of the corrosion inhibition efficiency calculated by electrochemical and weight-loss measurements.
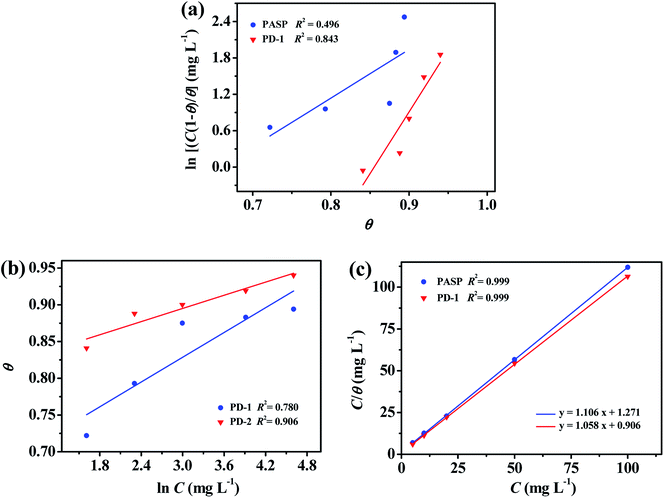 |
| | Fig. 8 Frumkin (a), Temkin (b) and Langmuir (c) isotherm plots for mild steel in 0.5 M H2SO4 solutions at 298 K containing different concentrations of PD-1 and PD-2. | |
Table 4 Thermodynamic parameters for the adsorption of PD-1 and PD-2 on mild steel surfaces in 0.5 M H2SO4 solution
| Inhibitor |
R2 |
Slope |
Kads (L mg−1) |
−ΔG0 (KJ mol−1) |
| PD-1 |
0.999 |
1.106 |
0.787 |
33.635 |
| PD-2 |
0.999 |
1.058 |
1.103 |
34.472 |
In addition, the value of Kads is related to the standard free energy (ΔG0ads) of adsorption process by the following eqn (11):16
| |
ΔG0ads = −RT![[thin space (1/6-em)]](https://www.rsc.org/images/entities/char_2009.gif) ln(1 × 10⁶ Kads) ln(1 × 10⁶ Kads)
| (11) |
where
R is the universal gas constant (8.314 J K
−1 mol
−1) and
T is the absolute temperature (K). The value of 1 × 10
6 is the concentration of water molecules expressed in mg L
−1. Generally, the value of Δ
G0ads around −20 kJ mol
−1 is consistent with the electrostatic interaction between the charged metal surface and the charged inhibitor molecules (physisorption), while a negative value of Δ
G0ads less than −40 kJ mol
−1 usually represents chemisorptions due to the coordinate interactions between lone pair electrons (or π-electrons) in the inhibitor molecule and the charged metal surface.
50 According to
Table 4, the values of Δ
G0ads for PD-1 and PD-2 are −33.64 and −34.47 kJ mol
−1, respectively. Therefore, the adsorption behaviors of PD-1 and PD-2 are mixed-type involving physisorption and chemisorption. In addition, a more negative Δ
G0ads value with PD-2 as an inhibitor represents a more stable adsorption layer of PD-2 molecules on the steel surface in comparison with that of PD-1.
40
3.5. Adsorption and inhibition mechanism
Based on the above results and discussion, the adsorption and inhibition mechanisms of PD-1 and PD-2 for mild steel in 0.5 M H2SO4 solution were described. First, the mild steel surface becomes electronegative by adsorbing sulfate ions on the surface.51 With PD-1 as the inhibitor, polyamino acid chains will be protonated in the acidic solution and physically adsorbs on the cathodic sites of the mild steel surface by an electrostatic interaction.52 Meanwhile, chemisorption of the polymer chains on the mild steel surface may occur via donor–acceptor interactions between the p-electrons of N (and/or O) atoms and the vacant d-orbitals of Fe atoms. Besides these interactions relative with PASP chains. PD-1 has additional electrostatic interactions with the negatively charged metal surface due to the protonated imidazole ring, as well as the chemisorption due to the donor–acceptor interaction between the π-electrons and the vacant d-orbitals of Fe. Therefore, PD-1 exhibits better corrosion inhibition efficiency than pure PASP. However, the positive hydrogen ions in the solution can also move to the negatively charged metal surface and result in a certain degree of corrosion of the mild steel. Different from PD-1, a hydrophobic long alkyl chain is also bonded onto the molecular chains of PD-2. In addition to the interactions of the polyamino acid chain and imidazole ring with the mild steel surface, long alkyl chains also play an important role in the adsorption and inhibition behaviors.10 Due to the intrinsic nature of hydrophobic, the long n-dodecyl chains in PD-2 will reside on the mild steel surface and cover the metal surface more effectively,17,53 which can exclude the corrosive ions approaching the mild steel surface. The influence of long alkyl group is the key reason that PD-2 shows superior inhibition efficiency. The schematic illustration of the adsorption behavior of PD-2 on mild steel in 0.5 M H2SO4 solution is shown in Fig. 9, from which we can see that there are three types of interactions between PD-2 molecules and the mild steel surface.
 |
| | Fig. 9 Schematic illustration of the adsorption behavior of PD-2 on a mild steel surface in 0.5 M H2SO4 solution. | |
3.6. Surface analysis by SEM and EDX
The above discussions clearly show that the inhibition efficiency of the PASP derivative PD-2 for mild steel in 0.5 M H2SO4 solution is much better than that of PD-1. To further reveal the corrosion inhibition performance of PD-2, SEM images and EDX spectra of the corroded mild steel surfaces without and with 100 mg L−1 of PD-2 immersed in 0.5 M H2SO4 solution for 12 h were detected and are shown in Fig. 10(a and b). From Fig. 10(a), the surface is relatively rough and has deep holes, indicating that the mild steel surface is corroded seriously in the blank sulfuric acid solution. The appearance of O and S signals in the EDX spectrum indicates that the corrosion products may be composed of iron oxides and a small amount of iron sulfate.53,54 In comparison, in the presence of 100 mg L−1 PD-2, the mild steel surface shows considerably less corrosion, and some original abrading scratches are also observed (Fig. 10(b)). This could be further confirmed by the decreased content of O and S in the EDX spectrum shown in Fig. 10(b).55 Meanwhile, it is also seen clearly from EDX spectrum in Fig. 10(b) that the content of N on the mild steel surface is enhanced significantly in the presence of PD-2. Therefore, it is evident that PD-2 molecules adsorb on the mild steel surface and the protective polymer layer effectively retards the corrosion of mild steel in 0.5 M H2SO4 solution.
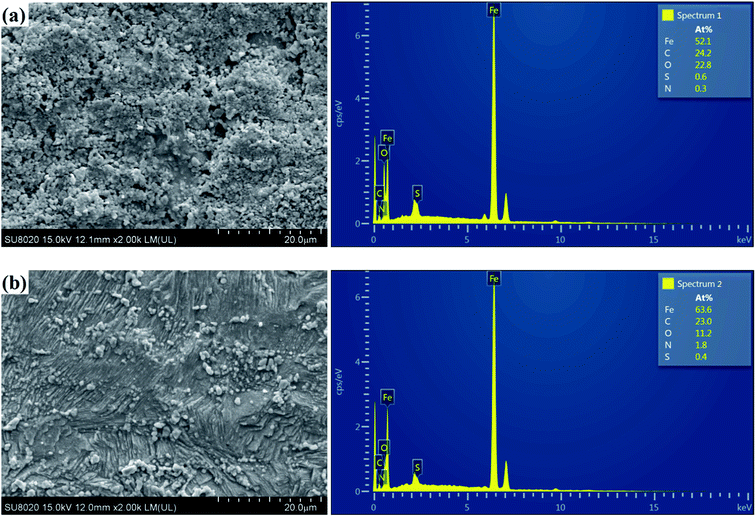 |
| | Fig. 10 SEM images and EDX spectra of the mild steel surfaces after 12 h immersion in 0.5 M H2SO4 solutions in the absence (a) and presence of 100 mg L−1 PD-2 (b). | |
3.7. Surface analysis by XPS
Finally, XPS was carried out to further investigate the composition of the adsorbed film on the steel surface with PD-2 as the inhibitor. Fig. 11 shows the full-range and high-resolution XPS spectra of the mild steel surface after immersion in 0.5 M H2SO4 for 12 h in the presence of 100 mg L−1 PD-2. The high-resolution C1s spectrum shows three main peaks. The first and most intense peak at 284.8 eV is attributed to the C–H, C–C and C![[double bond, length as m-dash]](https://www.rsc.org/images/entities/char_e001.gif) C bonds in PD-2 and to the presence of contaminant hydrocarbons.56 The second peak at 286.2 eV is attributed to the C
C bonds in PD-2 and to the presence of contaminant hydrocarbons.56 The second peak at 286.2 eV is attributed to the C![[double bond, length as m-dash]](https://www.rsc.org/images/entities/char_e001.gif) N and C–N bonds in the amide groups and imidazole rings. The last peak at a higher binding energy (288.4 eV) can be mainly attributed to the N–C
N and C–N bonds in the amide groups and imidazole rings. The last peak at a higher binding energy (288.4 eV) can be mainly attributed to the N–C![[double bond, length as m-dash]](https://www.rsc.org/images/entities/char_e001.gif) O (imide group) and carbon atom of –C+–OH which is related to the protonation of the carbonyl groups in acid medium.57
O (imide group) and carbon atom of –C+–OH which is related to the protonation of the carbonyl groups in acid medium.57
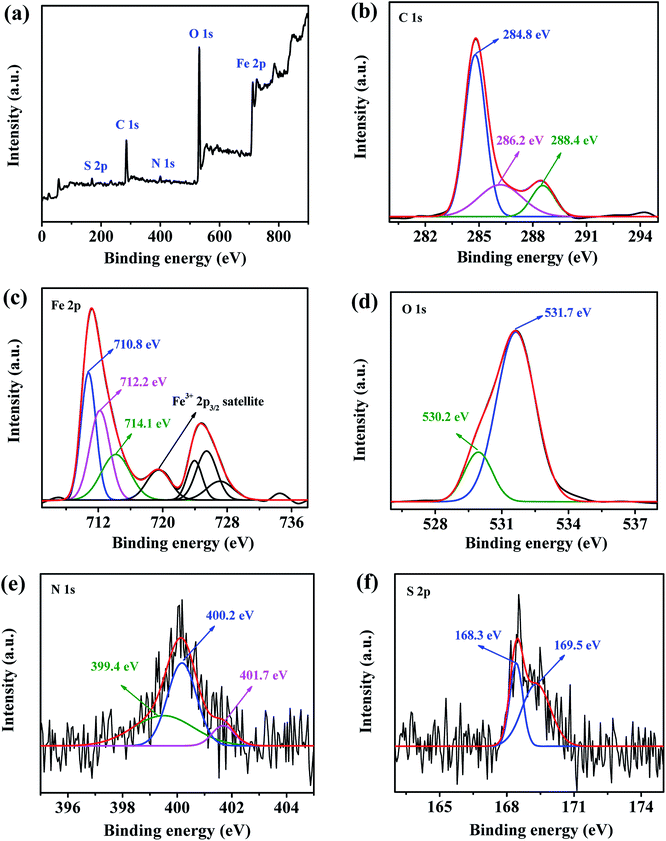 |
| | Fig. 11 Full-range spectrum (a) and XPS deconvoluted profiles of C 1s (b), Fe 2p (c), O 1s (d), N 1s (e) and S 2p (f) for mild steel immersed in 0.5 M H2SO4 solutions for 12 h at 298 K in the presence of 100 mg L−1 PD-2. | |
The spectrum of Fe 2p exhibits two peaks at 711.2 eV (Fe 2p3/2) and 724.8 eV (Fe 2p1/2) together with the associated ghost structure. The deconvolution of the Fe 2p3/2 spectrum consists of four main peaks. The first peak located at 710.8 eV is assigned to Fe2O3 and/or Fe–N,58 while that located at 712.2 eV is attributed to ferric hydroxide such as FeOOH.59 As discussed by Grosvenor et al.,60 the other two peaks at approximately 714.1 and 719.0 eV are ascribed to the surface peak and the satellite of Fe(III), respectively. The formation of the insoluble layer (Fe2O3 and FeOOH) may reduce the ionic diffusion and thus may be beneficial to improving the corrosion resistance of the mild steel surface in 0.5 M H2SO4 solution.58
The spectrum of O 1s can be fitted into two main peaks as shown in Fig. 11(d). The first peak, observed at 530.2 eV, could be related to the O atoms in the ferric oxides (Fe2O3), which is consistent with the presence of the Fe2O3/FeOOH layer as detected in the Fe 2p spectrum. The second and most intense peak observed at 531.7 eV is ascribed to the OH− of hydrous iron oxides (FeOOH) and to O–S in the adsorbed sulfate ion (SO42−). This peak may also be assigned to O atoms in carbonyl group (C![[double bond, length as m-dash]](https://www.rsc.org/images/entities/char_e001.gif) O).56
O).56
The deconvolution of N 1s signal could be fitted into three peaks as shown in Fig. 11(e). The first peak located at 399.4 eV is attributed to unprotonated C–N and C![[double bond, length as m-dash]](https://www.rsc.org/images/entities/char_e001.gif) N in the PASP chains and imidazole rings. The second peak located at approximately 400.2 eV is attributed to N atoms coordinated with the mild steel surface (N–Fe).58 The third peak at 401.7 eV is attributed to –N+H– resulting from the protonation of the N atoms in the amide groups and/or the imidazole rings, which lead to a positive polarization of N atoms and, thereby, an increase in the binding energy.49 The presence of nitrogen species indicates clearly that PD-2 molecules adsorb on the metal steel surface by chemisorption and physisorption in 0.5 M H2SO4 solution.
N in the PASP chains and imidazole rings. The second peak located at approximately 400.2 eV is attributed to N atoms coordinated with the mild steel surface (N–Fe).58 The third peak at 401.7 eV is attributed to –N+H– resulting from the protonation of the N atoms in the amide groups and/or the imidazole rings, which lead to a positive polarization of N atoms and, thereby, an increase in the binding energy.49 The presence of nitrogen species indicates clearly that PD-2 molecules adsorb on the metal steel surface by chemisorption and physisorption in 0.5 M H2SO4 solution.
The S 2p spectrum exhibits two peaks at 168.3 and 169.5 eV for S 2p3/2 and S 2p1/2, respectively which can be ascribed to S atoms in SO42−.39 This result reflects the presence of sulfur on the steel surface, and it coincides with the above EDX analysis.
The presence of nitrogen species of the protonated nitrogen atoms (–N+H–) and carbon cation structure (–C+–OH) on the steel surface confirms that the investigated PASP derivative PD-2 can physically adsorb on the mild steel surface by electrostatic interaction. In addition, the presence of coordinated N and Fe atoms confirms the chemisorption between the PD-2 molecules and the mild steel surface. The results drawn from the XPS analysis provide direct evidence of the adsorption mechanism of PD-2 on the carbon steel surface, as shown in Fig. 9. Because of multiple interactions with the mild steel surface, PD-2 exhibits good inhibition efficiency for mild steel in 0.5 M H2SO4 solution.
4. Conclusions
By introducing functional groups into the molecular chains of the eco-friendly polymer PASP, two PASP derivatives (PD-1 and PD-2) were prepared. Their chemical structures were confirmed by FTIR and 1H NMR. Electrochemical measurements and weight loss tests indicate that the inhibition efficiencies of PD-1 and PD-2 are significantly enhanced in comparison with that of PASP. Notably, PD-2 shows an outstanding inhibition performance at low concentrations compared to other polymer inhibitors. At an extremely low concentration of 5 mg L−1, the inhibition efficiency of PD-2 for mild steel in 0.5 M H2SO4 solution is up to 84.1%, and a high efficiency of 94.0% can be achieved at a concentration of 100 mg L−1 by potentiodynamic polarization measurements. SEM, EDX and XPS analysis clearly show that PD-2 molecules adsorb on the mild steel surface and effectively inhibit corrosion of mild steel in 0.5 M H2SO4 solution. Therefore, the new eco-friendly PASP derivative (PD-2) can be expected as a high efficiency polymer inhibitor with low dosage and has potential applications in the fields of acid cleaning, de-scaling and pickling industries.
Conflicts of interest
There are no conflicts to declare.
Acknowledgements
This work was financially supported by Key laboratory for Preparation and Application of Ordered Structural Materials of Guangdong Province (Grant No. KLPAOSM201704).
References
- M. Goyal, S. Kumar, I. Bahadur, C. Verma and E. E. Ebenso, J. Mol. Liq., 2018, 256, 565–573 CrossRef.
- M. A. Deyab, Desalination, 2018, 439, 73–79 CrossRef.
- M. A. Deyab, K. Eddahaoui, R. Essehli, T. Rhadfi, S. Benmokhtar and G. Mele, Desalination, 2016, 383, 38–45 CrossRef.
- F. Bentissa, C. Jama, B. Mernari, H. E. Attaria, L. E. Kadi, M. Lebrini, M. Traisnel and M. Lagrenéec, Corros. Sci., 2009, 51, 1628–1635 CrossRef.
- I. R. Glasgow, A. J. Rostron and G. Thomson, Corros. Sci., 1966, 6, 469–482 CrossRef.
- N. K. Gupta, M. A. Quraishi, C. Verma and A. K. Mukherjee, RSC Adv., 2016, 6, 102076–102087 RSC.
- A. Dutta, S. K. Saha, P. Banerjee, A. K. Patra and D. Sukul, RSC Adv., 2016, 6, 74833–74844 RSC.
- Y. Meng, W. Ning, B. Xu, W. Yang, K. Zhang, Y. Chen, L. Li, X. Liu, J. Zheng and Y. Zhang, RSC Adv., 2017, 7, 43014–43029 RSC.
- X. Li, S. Deng, T. Lin, X. Xie and G. Du, Corros. Sci., 2017, 118, 202–216 CrossRef.
- D. Zhang, Y. Tang, S. Qi, D. Dong, H. Cang and G. Lu, Corros. Sci., 2016, 102, 517–522 CrossRef.
- M. Ouakki, M. Rbaa, M. Galai, B. Lakhrissi, E. H. Rif and M. Cherkaoui, Journal of Bio- and Tribo-Corrosion, 2018, 4, 35 CrossRef.
- N. Phadke Swathi, V. D. P. Alva and S. Samshuddin, Journal of Bio- and Tribo-Corrosion, 2017, 3, 46 CrossRef.
- Z. Salarvand, M. Amirnasr, M. Talebian, K. Raeissi and S. Meghdadi, Corros. Sci., 2017, 114, 133–145 CrossRef.
- Z. Hu, Y. Meng, X. Ma, H. Zhu, J. Li, C. Li and D. Cao, Corros. Sci., 2016, 112, 563–575 CrossRef.
- A. Singh, K. R. Ansari, J. Haque, P. Dohare, H. Lgaz, R. Salghi and M. A. Quraishi, J. Taiwan Inst. Chem. Eng., 2018, 82, 233–251 CrossRef.
- M. T. Alhaffar, S. A. Umoren, I. B. Obot and S. A. Ali, RSC Adv., 2018, 8, 1764–1777 RSC.
- S.-H. Yoo, Y.-W. Kim, K. Chung, S.-Y. Baik and J.-S. Kim, Corros. Sci., 2012, 59, 42–54 CrossRef.
- S. Varvara, R. Bostan, O. Bobis, L. Găină, F. Popa, V. Mena and R. M. Souto, Appl. Surf. Sci., 2017, 426, 1100–1112 CrossRef.
- K. Xhanari, M. Finšgar, M. Knez Hrnčič, U. Maver, Ž. Knez and B. Seiti, RSC Adv., 2017, 7, 27299–27330 RSC.
- N. K. Gupta, P. G. Joshi, V. Srivastava and M. A. Quraishi, Int. J. Biol. Macromol., 2018, 106, 704–711 CrossRef PubMed.
- F. El-Hajjaji, M. Messali, A. Aljuhani, M. R. Aouad, B. Hammouti, M. E. Belghiti, D. S. Chauhan and M. A. Quraishi, J. Mol. Liq., 2018, 249, 997–1008 CrossRef.
- M. Yadav, T. K. Sarkar and I. B. Obot, RSC Adv., 2016, 6, 110053–110069 RSC.
- S. A. Umoren and U. M. Eduok, Carbohydr. Polym., 2016, 140, 314–341 CrossRef PubMed.
- B. D. B. Tiu and R. C. Advincula, React. Funct. Polym., 2015, 95, 25–45 CrossRef.
- M. Mobin and M. Rizvi, Carbohydr. Polym., 2017, 160, 172–183 CrossRef PubMed.
- K. Zhang, W. Yang, X. Yin, Y. Chen, Y. Liu, J. Le and B. Xu, Carbohydr. Polym., 2018, 181, 191–199 CrossRef PubMed.
- R. Karthikaiselvi and S. Subhashini, J. Mol. Liq., 2017, 10, S627–S635 Search PubMed.
- M. Mobin and M. Rizvi, Carbohydr. Polym., 2017, 156, 202–214 CrossRef PubMed.
- Y. Sangeetha, S. Meenakshi and C. Sairam Sundaram, Carbohydr. Polym., 2016, 150, 13–20 CrossRef PubMed.
- B. Zhang, D. Zhou, X. Lv, Y. Xu and Y. Cui, Desalination, 2013, 327, 32–38 CrossRef.
- A. Zeino, I. Abdulazeez, M. Khaled, M. Jawich and I. Obot, J. Mol. Liq., 2018, 250, 50–62 CrossRef.
- L. Yang, Y. Li, B. Qian, B. R. Hou and J. Magnes, Alloy, 2015, 3, 47–51 CrossRef.
- D. Zeng, T. Chen and S. Zhou, Int. J. Electrochem. Sci., 2015, 10, 9513–9527 Search PubMed.
- R. Cui, N. Gu and C. Li, Mater. Corros., 2011, 62, 362–369 CrossRef.
- B. Qian, J. Wang, M. Zheng and B. Hou, Corros. Sci., 2013, 75, 184–192 CrossRef.
- S. M. Tawfik, J. Mol. Liq., 2015, 207, 185–194 CrossRef.
- B. N. Tran, Q. T. Bui, Y. S. Jeon, H. S. Park and J.-H. Kim, Polym. Bull., 2015, 72, 2605–2620 CrossRef.
- J.-l. Huang, Y.-l. Zhang, Z.-h. Cheng and H.-c. Tao, J. Appl. Polym. Sci., 2007, 103, 358–364 CrossRef.
- P. Mourya, P. Singh, A. K. Tewari, R. B. Rastogi and M. M. Singh, Corros. Sci., 2015, 95, 71–87 CrossRef.
- L. L. Liao, S. Mo, H. Q. Luo, Y. J. Feng, H. Y. Yin and N. B. Li, Corros. Sci., 2017, 124, 167–177 CrossRef.
- S. Banerjee, V. Srivastava and M. M. Singh, Corros. Sci., 2012, 59, 35–41 CrossRef.
- H. M. Abd El-Lateef, M. A. Abo-Riya and A. H. Tantawy, Corros. Sci., 2016, 108, 94–110 CrossRef.
- M. Srimathi, R. Rajalakshmi and S. Subhashini, J. Mol. Liq., 2014, 7, 647–656 Search PubMed.
- S. A. Umoren, I. B. Obot, A. Madhankumar and Z. M. Gasem, Carbohydr. Polym., 2015, 124, 280–291 CrossRef PubMed.
- X. Luo, X. Pan, S. Yuan, S. Du, C. Zhang and Y. Liu, Corros. Sci., 2017, 125, 139–151 CrossRef.
- N. Yilmaz, A. Fitoz, ÿ. Ergun and K. C. Emregül, Corros. Sci., 2016, 111, 110–120 CrossRef.
- Y. Zhou, L. Guo, S. Zhang, S. Kaya, X. Luo and B. Xiang, RSC Adv., 2017, 7, 23961–23969 RSC.
- M. A. Bedair, M. M. B. El-Sabbah, A. S. Fouda and H. M. Elaryian, Corros. Sci., 2017, 128, 54–72 CrossRef.
- M. Bouanis, M. Tourabi, A. Nyassi, A. Zarrouk, C. Jama and F. Bentiss, Appl. Surf. Sci., 2016, 389, 952–966 CrossRef.
- M. Mobin, S. Zehra and R. Aslam, RSC Adv., 2016, 6, 5890–5902 RSC.
- K. R. Ansari, M. A. Quraishi and A. Singh, Corros. Sci., 2015, 95, 62–70 CrossRef.
- H. T. M. Abdel-Fatah, M. M. Kamel, A. A. M. Hassan, S. A. M. Rashwan, S. M. Abd El Wahaab and H. E. E. El-Sehiety, J. Mol. Liq., 2017, 10, S1164–S1171 Search PubMed.
- S. A. Ali, A. M. El-Shareef, R. F. Al-Ghamdi and M. T. Saeed, Corros. Sci., 2005, 47, 2659–2678 CrossRef.
- N. V. Likhanova, M. A. Domínguez-Aguilar, O. Olivares-Xometl, N. Nava-Entzana, E. Arce and H. Dorantes, Corros. Sci., 2010, 52, 2088–2097 CrossRef.
- A. Pourghasemi Hanza, R. Naderi, E. Kowsari and M. Sayebani, Corros. Sci., 2016, 107, 96–106 CrossRef.
- A. Zarrouk, B. Hammouti, T. Lakhlifi, M. Traisnel, H. Vezin and F. Bentiss, Corros. Sci., 2015, 90, 572–584 CrossRef.
- J. Morgan, A. Greenberg and J. F. Liebman, Struct. Chem., 2011, 23, 197–199 CrossRef.
- B. Zhang, C. He, C. Wang, P. Sun, F. Li and Y. Lin, Corros. Sci., 2015, 94, 6–20 CrossRef.
- H. Tian, W. Li, B. Hou and D. Wang, Corros. Sci., 2017, 117, 43–58 CrossRef.
- A. P. Grosvenor, B. A. Kobe, M. C. Biesinger and N. S. McIntyre, Surf. Interface Anal., 2004, 36, 1564–1574 CrossRef.
|
| This journal is © The Royal Society of Chemistry 2018 |
Click here to see how this site uses Cookies. View our privacy policy here.  Open Access Article
 ab and
Lei Zhang
 *ac
*ac


![[thin space (1/6-em)]](https://www.rsc.org/images/entities/char_2009.gif) ln(1 × 10⁶ Kads)
ln(1 × 10⁶ Kads)


![[double bond, length as m-dash]](https://www.rsc.org/images/entities/char_e001.gif) C bonds in PD-2 and to the presence of contaminant hydrocarbons.56 The second peak at 286.2 eV is attributed to the C
C bonds in PD-2 and to the presence of contaminant hydrocarbons.56 The second peak at 286.2 eV is attributed to the C![[double bond, length as m-dash]](https://www.rsc.org/images/entities/char_e001.gif) N and C–N bonds in the amide groups and imidazole rings. The last peak at a higher binding energy (288.4 eV) can be mainly attributed to the N–C
N and C–N bonds in the amide groups and imidazole rings. The last peak at a higher binding energy (288.4 eV) can be mainly attributed to the N–C![[double bond, length as m-dash]](https://www.rsc.org/images/entities/char_e001.gif) O (imide group) and carbon atom of –C+–OH which is related to the protonation of the carbonyl groups in acid medium.57
O (imide group) and carbon atom of –C+–OH which is related to the protonation of the carbonyl groups in acid medium.57
![[double bond, length as m-dash]](https://www.rsc.org/images/entities/char_e001.gif) O).56
O).56![[double bond, length as m-dash]](https://www.rsc.org/images/entities/char_e001.gif) N in the PASP chains and imidazole rings. The second peak located at approximately 400.2 eV is attributed to N atoms coordinated with the mild steel surface (N–Fe).58 The third peak at 401.7 eV is attributed to –N+H– resulting from the protonation of the N atoms in the amide groups and/or the imidazole rings, which lead to a positive polarization of N atoms and, thereby, an increase in the binding energy.49 The presence of nitrogen species indicates clearly that PD-2 molecules adsorb on the metal steel surface by chemisorption and physisorption in 0.5 M H2SO4 solution.
N in the PASP chains and imidazole rings. The second peak located at approximately 400.2 eV is attributed to N atoms coordinated with the mild steel surface (N–Fe).58 The third peak at 401.7 eV is attributed to –N+H– resulting from the protonation of the N atoms in the amide groups and/or the imidazole rings, which lead to a positive polarization of N atoms and, thereby, an increase in the binding energy.49 The presence of nitrogen species indicates clearly that PD-2 molecules adsorb on the metal steel surface by chemisorption and physisorption in 0.5 M H2SO4 solution.


