 Open Access Article
Rapid naked-eye detection of Gram-positive bacteria by vancomycin-based nano-aggregation†
Cheong Shin‡
a,
Ha Neul Lee‡a,
Jea Sung Ryua and
Hyun Jung Chung *ab
*ab
aGraduate School of Nanoscience and Technology, Korea Advanced Institute of Science and Technology, 291 University Rd., Daejeon, 34141, Korea. E-mail: hyunjc@kaist.ac.kr
bDepartment of Biological Sciences, Korea Advanced Institute of Science and Technology, 291 University Rd., Daejeon, 34141, Korea
First published on 12th July 2018
Abstract
Development of a rapid, point-of-care assay for diagnosing bacterial infections is crucial for subsequent treatment of the patient and preventing the overuse of antibiotics. Herein, we describe a rapid, one-step colorimetric assay based on the formation of nano-aggregates using nanobeads targeting Gram-positive bacteria. Vancomycin was immobilized onto blue-colored polymeric nanobeads to induce specific and multivalent binding with the Gram-positive bacterial cell wall and subsequent agglomeration. Without any pre-processing steps, the addition of various types of Gram-positive pathogens to the nanobeads resulted in the formation of blue precipitates, which could be observed with the naked eye in ∼30 min. We also utilized a porous filter system for the assay, which allowed discrimination of Gram-positive targets with higher selectivity, and demonstrated feasibility as a simple diagnostic assay with minimal technical components. We anticipate that the nanobead aggregation assay can be potentially applied as a rapid and simple sensing platform, which can be easily miniaturized and enable point-of-care diagnosis of Gram-positive infections.
Introduction
Infectious diseases caused by bacterial pathogens have been threatening communities worldwide, showing high incidence of morbidity as well as mortality.1,2 Among the various pathogens causing the infections, Gram-positive and Gram-negative bacteria show substantial differences in molecular structure and biological function, allowing them to be differentially targeted for treatment.3,4 For decades, antibiotics such as aminoglycosides, carbapenems, cephalosporins, and glycopeptides, have been used, which act on a broad spectrum of microbes by targeting bacterial functions or growth processes, including the binding and inhibition of cell wall components, modifying cell membrane structure, or interfering with essential bacterial enzymes involved with DNA replication or protein synthesis.5–8 Generally, the antibiotics have been prescribed in large dosages, separately or in combinations, which target a broad spectrum of Gram-positive and Gram-negative pathogens, without performing any experimental assay for classification of the pathogen prior to treatment.9,10 This has led to serious problems such as resulting in poor therapeutic efficacy and survival of the patient, subsequent spread of infection to the community, and the emergence of superbugs with multidrug resistance.9–13 The rapid discrimination of Gram-positive and Gram-negative pathogens can greatly reduce the overuse of antibiotics, allowing proper treatment and improvement in patient survival, preventing further transmission, and reducing the spread of antimicrobial resistance.14–17 However, a rapid and simple diagnostic test that can be easily applied in the clinic has been lacking.The current gold standard for diagnosing bacterial infections in the clinic is microbial culture.18,19 Not only is the method labor-intensive and time-consuming (∼2 days to several weeks) but also shows high incidence of false-positive results due to contamination. The utilization of molecular diagnostic techniques such as quantitative real-time polymerase chain reaction (qPCR), enzyme-linked immunosorbent assays (ELISA), and nucleic acid hybridization provides a great advantage in achieving high specificity, however show limitations due to the involvement of complex sample processing steps requiring trained personnel and experimental setup.19–23 The development of rapid diagnostic techniques, such as automated qPCR-based devices, DNA microarrays, and miniaturized immunoassay platforms, has greatly increased the speed of the assay while simplifying the complex processing procedures.24–26 However, problems still remain for applying these methods into the clinic, since automated devices involve large and expensive instruments, while small-scale microarray or immunoassay platforms still lack the sensitivity and specificity.27,28
Rapid sensing technologies utilizing fluorescence, magnetic, or colorimetric detection have been introduced as novel approaches as diagnostic assays for various disease targets.29–40 Among these, a colorimetric detection method allowing naked-eye detection would be advantageous and easily applicable as a bedside assay in point-of-care settings. Detection based on molecularly induced aggregation have been usefully applied since they can be designed as a simple assay involving a one-step, wash-free procedure.29,30 Aggregation-based assays using gold nanoparticles have been one of the most widely studied, and have been applied for diagnosing diseases such as cancer and infectious diseases.31–36 For bacteria, studies based on the aggregation of gold nanoparticles utilizing concanavalin A,34 cell wall peptide subunits,35 and boronic acid derivatives36 were reported, however could not distinguish various types of Gram-positive pathogens from Gram-negative bacteria. Another method using platinum-coated magnetic nanoparticle clusters for immunoseparation and colorimetric detection has been reported, however a washing step was required and also allowed the detection of a single type of pathogen.37 For ubiquitous detection of Gram-positive bacteria, a rapid labeling approach using magnetic nanoparticles with vancomycin as the targeting ligand was introduced, but required the use of a bioluminescence or magnetic detection device.38,39 Fluorescent light-up probes using the vancomycin ligand to target Gram-positive bacteria have also been developed, but still requires the use of a UV illumination device and remains to be validated in various other types of pathogenic bacteria that are clinically relevant in infections.40
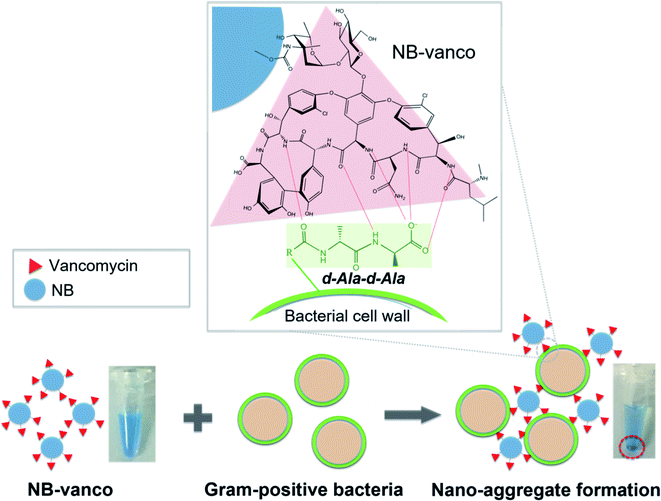
Herein, we report a rapid and simple colorimetric assay (NB-vanco assay) based on the use of nanobeads functionalized with the vancomycin ligand to target Gram-positive bacteria. Blue-colored polymer nanobeads (NBs) were surface-immobilized with vancomycin (NB-vanco), which then forms nano-aggregates when added with Gram-positive bacteria as the target due to the multivalent and specific interactions of vancomycin on the nanobead and the D-alanyl-D-alanine (D-Ala-D-Ala) subunits on the bacterial cell wall. Nano-aggregation would result in the formation of blue-colored precipitates, which can be visualized with the naked eye. We show that this one-step, wash-free method can be used to differentially detect various types of Gram-positive pathogens that are clinically relevant in hospital-acquired infections, without the involvement of any pre-processing or amplification procedures. Furthermore, we introduce a robust platform based on a porous filter system, which allows signal enhancement by minimizing background signals, and images of the results can be obtained using a smart mobile device for analysis. The current method can be usefully applied as a rapid and simple assay for diagnosing Gram-positive infections, which shows great advantages for applications at the bedside in the clinic or in point-of-care settings.
Experimental
Materials and reagents
Polybead® carboxylate blue dyed nanobeads were purchased from Polysciences, Inc. (USA). Dulbecco's phosphate buffered saline (PBS) was provided by GenDEPOT (USA). Bovine serum albumin, 1-ethyl-3-(3-dimethylaminopropyl)-carbodiimide (EDC), and N-hydroxysuccinimide (NHS) were purchased from Sigma-Aldrich. Fetal bovine serum (FBS) was provided by WELGENE. Vancomycin hydrochloride was provided by Bio Basic, Inc. (Canada). Ultrafree-MC SV centrifugal filters (pore size 5 μm) were purchased from Merck Millipore (Germany). Tryptic soy broth, Luria–Bertani broth, nutrient broth, and Todd–Hewitt Broth were provided by MB Cell (USA).Bacterial culture
Staphylococcus aureus 3881, Klebsiella pneumoniae 12![[thin space (1/6-em)]](https://www.rsc.org/images/entities/char_2009.gif) 385, and Bacillus subtilis 1021 were provided from the Korean Collection for Type Cultures (KCTC). Streptococcus pneumoniae 4059 was obtained from the Culture Collection of Antimicrobial Resistant Microbes (CCARM). Enterococcus faecalis 51
385, and Bacillus subtilis 1021 were provided from the Korean Collection for Type Cultures (KCTC). Streptococcus pneumoniae 4059 was obtained from the Culture Collection of Antimicrobial Resistant Microbes (CCARM). Enterococcus faecalis 51![[thin space (1/6-em)]](https://www.rsc.org/images/entities/char_2009.gif) 299 and Escherichia coli 22
299 and Escherichia coli 22![[thin space (1/6-em)]](https://www.rsc.org/images/entities/char_2009.gif) 366 was provided by American Type Culture Collection (ATCC) and Asan Medical Center, respectively. For culture, S. aureus, K. pneumoniae, and E. faecalis were inoculated in tryptic soy broth. E. coli and B. subtilis were inoculated in Luria–Bertani Broth. S. pneumoniae was cultured in Todd-Hewitt Broth. The bacteria were grown in a shaking incubator for 18–24 h, and washed in PBS including 2 v/v% FBS and 1 μg ml−1 BSA (PBS++).
366 was provided by American Type Culture Collection (ATCC) and Asan Medical Center, respectively. For culture, S. aureus, K. pneumoniae, and E. faecalis were inoculated in tryptic soy broth. E. coli and B. subtilis were inoculated in Luria–Bertani Broth. S. pneumoniae was cultured in Todd-Hewitt Broth. The bacteria were grown in a shaking incubator for 18–24 h, and washed in PBS including 2 v/v% FBS and 1 μg ml−1 BSA (PBS++).
Synthesis of NB-vanco
1.68 × 10¹² of carboxylate blue dyed nanobeads (300 nm diameter) dispersed in 1 ml of water were transferred to 2 ml of 100 mM 2-(N-morpholino)ethanesulfonic acid (MES, pH 5.3). After incubation at room temperature for 1 h with shaking (35 rpm) for hydration, 8 mg of EDC and 5.7 mg NHS were added. After 30 min, the unreacted reagents were removed by repeated centrifugation and washing with PBS. The activated beads were then dispersed in 2 ml PBS, and added with 4 mg of vancomycin. After reaction for 12 h at room temperature with gentle agitation (35 rpm), the beads were washed by repeated centrifugation and addition of PBS. The final product was reconstituted in 2 ml PBS and stored at 4 °C.Physicochemical characterization of NB-vanco
Zeta potential measurements of NB-vanco were performed using ELSZ-2000ZS zeta potential analyzer (Otsuka Electronics, Japan). For X-ray photoelectron spectroscopy (XPS), the NB-vanco solution was freeze-dried for 24 h, and then analyzed by Sigma Probe (Thermo VG Scientific) with an Al Kα X-ray source. Scanning electron microscopy was performed for NB and NB-vanco using SU-5000 (Hitachi, Japan).Validation of the NB-vanco assay
1.59 × 10⁹ of NB-vanco or unmodified NB were dispersed in 50 μl of PBS containing 2% FBS and 1 μg ml−1 BSA (PBS++). Concentration of the NB-vanco solution was adjusted so that the absorbance at 600 nm was 0.6. The cultured bacteria were washed 3 times with PBS++. For each assay, 1.59 × 10⁹ of NB-vanco or NB in 50 μl of PBS++ were added with 50 μl of the bacteria (3.1 × 10⁴ cells per μl ∼ 5.0 × 10⁵ cells per μl) and incubated for pre-determined time periods. For bulk absorbance measurements, 1.5 μl of the upper phase of the assay solution was used to measure the absorbance at 600 nm using Nanophotometer P330 (IMPLEN, Germany). Images of the assay solutions in sample tubes including the nano-aggregates were acquired with iPad Air2. For microscopic characterization, the nano-aggregates were applied onto a Petri dish and first observed by bright field (10×) using a fluorescence microscope (Ti-E, Nikon, Japan). For fluorescent microscopy, bacteria were fixed with 4 v/v% formaldehyde solution in PBS (4% FPBS) for 40 min, followed by staining with 4′,6-diamidino-2-phenylindole (DAPI), before the assay. After performing the NB-vanco assay, aggregates were applied onto a glass slide (Ground edge frosted, 76 × 26 × 1 mm, MARIENFELD) and observed under a fluorescence microscope (Ti-E, Nikon, Japan) at high magnification (60×). For scanning electron microscopy, the aggregates were fixed in 4% FPBS for 30 min, dehydrated with graded ethanol solutions (30%, 50%, 70%, 80%, 90%, 100%), and mounted on a Si-wafer. The aggregates on the Si-wafer were coated with Pt (5 mA, 60 s), and observed using a scanning electron microscope (SU-5000, Hitachi, Japan) with an electron beam of 5 kV at low damage mode.Integration of the porous filter system
The NB-vanco assay was integrated with a porous filter system using centrifugal filter membranes with pore sizes of 5 μm (Ultrafree-MC SV, Millipore). The assay was performed by adding 1.59 × 10⁹ of NB-vanco with the bacterial targets in 100 μl and incubating for 30 min. The assay solution was then transferred to the porous filter units, and applied with weak centrifugal force (2000g) for 10 seconds using Mini Microcentrifuge (GMC-260, Daihan Labtech Co., Ltd.). Images of the filter membranes were taken using iPad Air2 (Apple), with sizes adjusted to 660 × 660 pixels. For quantification, the images in RGB color format were transformed using MATLAB into CIEL*a*b* color space which reflected the intensity of the original blue colors. The number of pixels for each image was counted for the different b* values, and analyzed to determine threshold for the cut-off value.Image analysis and quantification
Image acquisition and analysis of the assay results in sample tubes or from the porous filter system was performed as follows: images were obtained so that the sample tubes from the side or whole area of the filter membrane from the top were captured using iPad Air2, after performing the assay. The obtained images were then adjusted to a size of 30 × 30 pixels for sample tubes or 660 × 660 pixels for porous filter system using the Image J software (NIH). The adjusted images were converted to CIEL*a*b* color space using MATLAB (2017a). Then, the b* coordinate values in the images were counted based on a determined cut-off value (b* ≤ −9). The cut-off was determined based on the b* coordinate value which was mean (sample) < mean (control w/o bacteria) − 3 × standard deviation (control w/o bacteria).49 Measurements of average sizes of the aggregates from the images were performed using the particle analyze function of Image J. Particles that were larger than 5 μm in size were counted.Statistical analyses
Statistical data were indicated as mean ± standard deviation (s.d.). Statistical significance was expressed as the p value calculated by the Student's t-test.Results and discussion
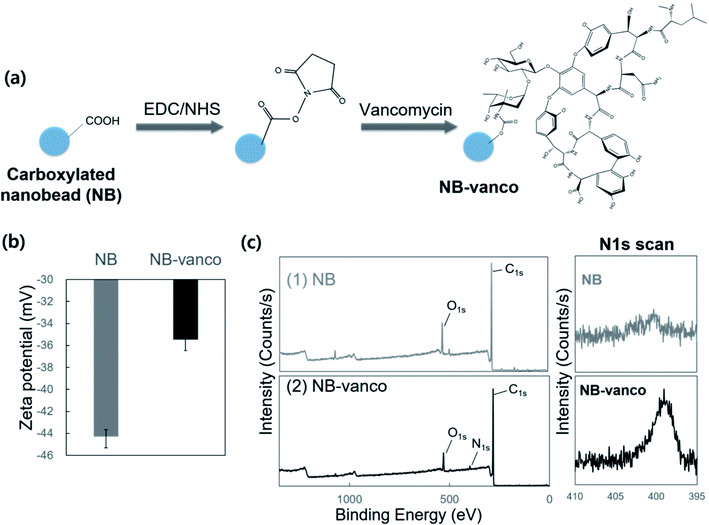
The NB-vanco assay was designed to induce the formation of nano-aggregates by specific and multivalent interactions of vancomycin on the surface of the NBs with Gram-positive bacteria. The overall scheme of the assay is shown in Fig. 1. Vancomycin binds to the cell wall of Gram-positive bacteria by specific interaction with the D-Ala-D-Ala subunits of the peptidoglycan.41 The multivalent interaction induces clustering of the bacteria and NB-vanco, resulting in the formation of blue-colored precipitates which can be visually detected with the naked eye. NB-vanco was prepared by reacting the amine groups of vancomycin to carboxylated polystyrene nanobeads (Fig. 2a). The modified NB-vanco was characterized by scanning electron microscopy, zeta-potential measurements and X-ray photoelectron spectroscopy (XPS). Fig. S1 (ESI†) shows that NB-vanco were observed as individual particles, similar to unmodified NBs. Zeta potential measurements showed that the surface charge of NB-vanco was −35 mV, which was higher than the unmodified NBs (−44 mV), due to the introduction of the cationic vancomycin molecules (pKa = 8.3) (Fig. 2b).42,43The functionalization of vancomycin on the surface of NBs was also characterized by XPS, showing a binding energy peak of N 1s at 399.6 eV for NB-vanco, as shown in Fig. 2c. This peak was absent for the unmodified NBs.
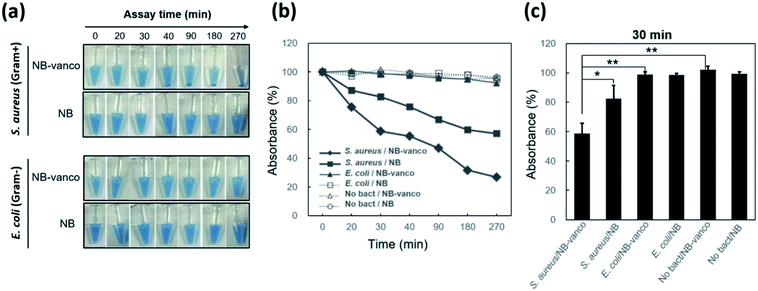
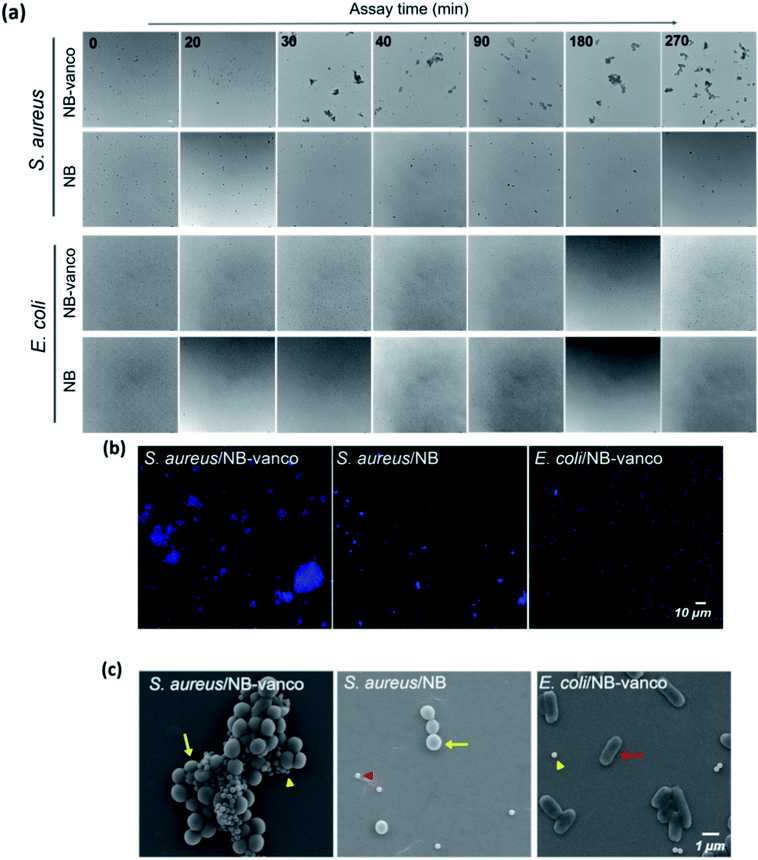
To examine whether nano-aggregation could be induced in the presence of Gram-positive targets for visualization, the assay was performed by adding NB-vanco with cultured S. aureus as the target. Fig. 3a shows that for S. aureus, the addition of NB-vanco resulted in the formation of precipitates that were visible after 30 min. Absorbance measurements at 600 nm allowed the quantification of the amount of precipitation. That is, a higher extent of precipitation would result in lower values due to the reduced density of NBs and bacteria dispersed in the assay media. Fig. 3b shows that for S. aureus, the absorbance value decreased to 75% at 20 min and 59% at 30 min, indicating that the amount of precipitation was 25% and 41%, respectively. Longer incubation times resulted in further decrease in absorbance (27% at 270 min). For E. coli, values were relatively consistent, and showed to be > 90% even after 270 min. Fig. 3c shows that the change in absorbance values at 30 min incubation for NB-vanco added with S. aureus is significant compared to the controls-unmodified NB added with S. aureus, NB-vanco with E. coli, and NB-vanco without bacteria. Therefore, we found that 30 min, which is considered to be short enough for a rapid assay, is also sufficient to induce agglomeration of NB-vanco with the bacteria. The nano-aggregation process was also microscopically observed. Bright field microscopic images in Fig. 4a shows that S. aureus added with NB-vanco formed nano-aggregates that could be clearly observed at 30 min, while E. coli did not form any aggregates even after 270 min. The average size of an aggregate formed with S. aureus was 13 μm at 30 min and did not show significant change even after 270 min of incubation. Staining and fluorescence microscopy showed the presence of bacteria within the nano-aggregates formed from NB-vanco and S. aureus at 30 min, while for NB without vancomycin with S. aureus or for NB-vanco with E. coli showed individual or very small clusters of bacteria (Fig. 4b). Scanning electron microscopy was also performed for structural observation of the NB-vanco/bacteria nano-aggregates in high-resolution (Fig. 4c). A single nano-aggregate could be clearly observed, which was formed from multiple bacterial cells and beads for NB-vanco added with S. aureus, while the control samples did not show any presence of aggregates with a significant size (<5 μm). These results demonstrate that nano-aggregation of NB-vanco in the presence of a Gram-positive target (S. aureus) occurs by specific, multivalent interaction between the bacterial cells and beads, resulting in their clustering. Since the assay does not require any pre-processing steps for the bacterial samples and can be added directly to the NB-vanco reagent, the assay can be performed within ∼30 min, which is the minimum time required for precipitation.
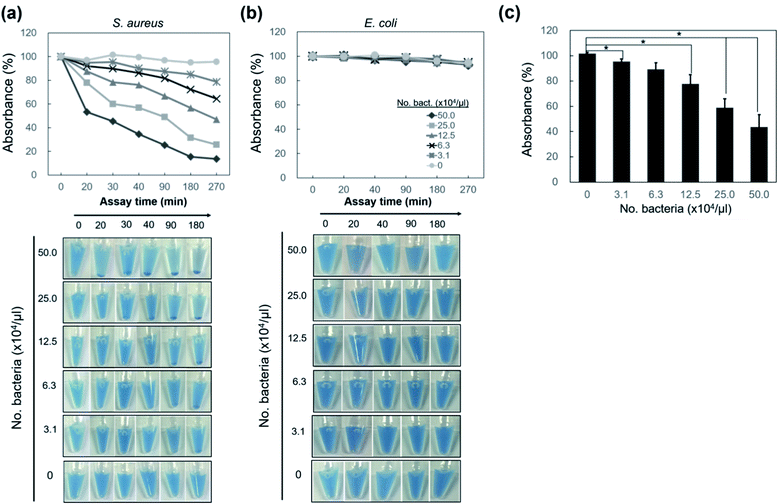
We next applied the NB-vanco assay with various bacterial cell numbers to determine the sensitivity of the method for naked eye detection. Fig. 5a shows the results for nano-aggregation of NB-vanco when added with various numbers of S. aureus. It appears that as incubation progresses, the larger the number of bacteria, the earlier the precipitates are observed, and can be visualized. When the incubation time was set at 30 min, the precipitates are visible with the naked eye when the concentration of bacteria is ≥ 2.5 × 10⁵ μl−1. Results from absorbance measurements show that the increase in number of S. aureus (from 3.1 × 10⁴ μl−1 to 5.0 × 10⁵ μl−1) resulted in a higher extent of precipitation of the NB-vanco. For S. aureus, a total of 2.5 × 10⁵ μl−1 bacteria or higher showed the highest significance in extent of precipitation at 30 min (p < 0.001; Fig. 5c), while concentrations as low as 3.1 × 10⁴ μl−1 showed visible precipitates at longer incubation times. For NB-vanco added with E. coli as the Gram-negative control or without the addition of any bacteria, no significant signal for precipitation was detected even after 270 min (Fig. 5b). Although the sensitivity must be improved for wide applicability, the NB-vanco assay presents a rapid, simple, and one-step method allowing device-free and naked eye detection, which does not require any sample processing, amplification, or washing procedures.
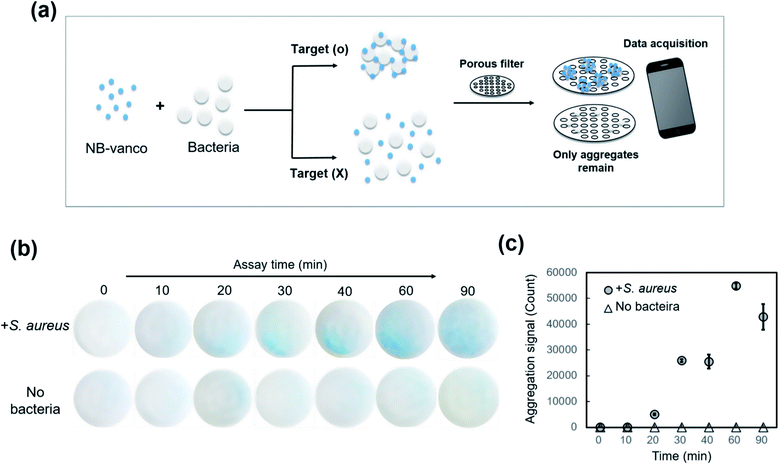
To apply the NB-vanco assay as a robust platform for rapid diagnosis, we utilized a porous filter system to allow more clear visualization of the nano-aggregates, by separating them from the unbound single bacteria and single beads. As shown in Fig. 6a, when the assay solution is applied to the NB-vanco-porous filter system, the nano-aggregates of NB-vanco formed by addition of Gram-positive targets would remain on the top of the filter membrane resulting in an intense blue signal, while the addition of Gram-negative or no bacteria would not show any presence of colored aggregates on the membrane. We selected 5 μm as the pore size of the filter, since the nano-aggregates for the positive samples were ∼10 μm, while the sizes of individual bacteria and NBs were ∼1 μm and ∼300 nm, respectively. Images of the nano-aggregates on the filter membranes could be easily acquired using a smart mobile camera system (iPad Air 2). The NB-vanco assay conditions were optimized for the porous filter system by using different amounts of beads and assay times. Fig. 6b shows the images of the filter for NB-vanco added with S. aureus, or without bacteria as the control, according to different pre-incubation times. Addition of S. aureus produces blue aggregates that show a very weak signal at 20 min, and becomes more noticeable at 30 min. It can be seen that longer incubation times resulted in enhanced signals. Without the addition of bacteria, no presence of blue aggregates was shown on the filter. The signals from the images were also quantified using MATLAB, with cut-off values determined by the point where the control sample (NB-vanco without bacteria) reached the background signal (Fig. S2 ESI†). We utilized the CIEL*a*b*(CIELAB) color space, which is designed to approximate human vision and is suitable system for quantifying blue color detected by the naked eye.44 A larger value of the b* coordinate represents yellow, and as the value becomes smaller, the coordinate represents blue. Results showed that the addition of S. aureus resulted in a positive signal beginning at 20 min, and subsequently increased at longer incubation times (Fig. 6c). Based on these results, and considering that the assay aims at naked eye detection, we selected 30 min as the assay time for this system.
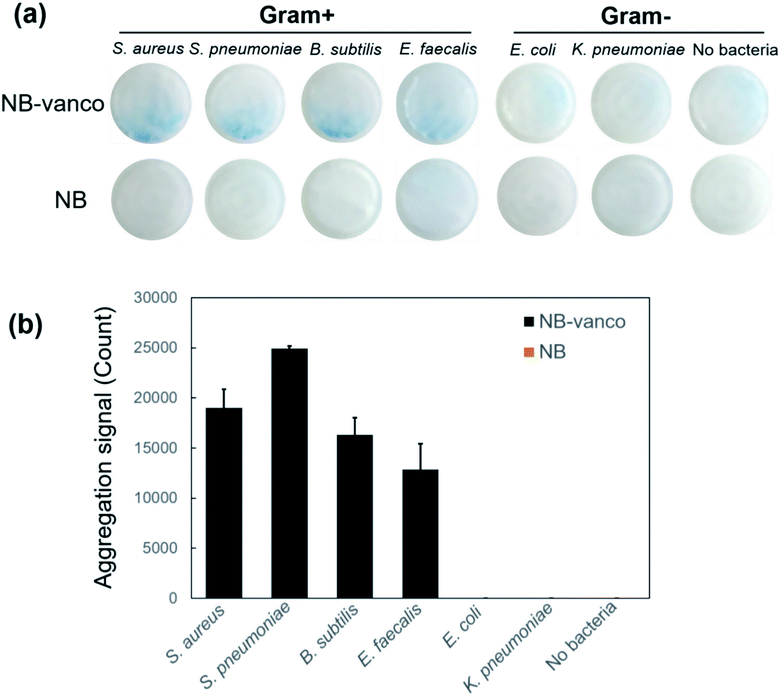
The NB-vanco-porous filter system was then validated as a platform for target selectivity in detecting Gram-positive bacteria. Various types of Gram-positive and Gram-negative species – S. aureus, S. pneumoniae, E. faecalis, B. subtilis, E. coli and K. pneumoniae, were examined. It has been previously shown that vancomycin is a useful targeting ligand for specific recognition of Gram-positive bacteria.45–48 Fig. 7a shows that when NB-vanco is added with Gram-positive bacteria (S. aureus, S. pneumoniae, B. subtilis, and E. faecalis), an intense blue color derived from nano-aggregation could be visually detected on the filter membrane, while the addition of Gram-negative bacteria (E. coli and K. pneumoniae) or without bacteria did not result in any significant signal. The unmodified NBs added with either Gram-positive or Gram-negative bacteria, or NB-vanco without adding any bacteria also did not show any presence of visible aggregates on the membrane. Quantification of the images in Fig. 7b also showed that the addition of NB-vanco with only the Gram-positive bacteria – S. aureus, S. pneumoniae, B. subtilis, and E. faecalis, resulted in significantly high signals (values from 12![[thin space (1/6-em)]](https://www.rsc.org/images/entities/char_2009.gif) 883 ± 2544 to 24
883 ± 2544 to 24![[thin space (1/6-em)]](https://www.rsc.org/images/entities/char_2009.gif) 954 ± 226), while the addition of NB-vanco with Gram-negative bacteria E. coli and K. pneumoniae or without addition of bacteria, did not show any significant signals (values ∼ 0). Fig. S3 (ESI†) shows the bulk absorbance measurements and visualization in sample tubes for the assay performed with different types of bacteria. For incubation times of 40 min or longer, the Gram-positive bacteria (S. aureus, S. pneumoniae, B. subtilis and E. faecalis) showed significant extents of precipitation, while Gram-negative bacteria did not show any detectable signal, similar to the results from applying the porous filter system. Among the different types of Gram-positive bacteria, S. aureus showed the highest degree of precipitation, which is presumably due to the higher targeting efficiency of vancomycin to S. aureus. Although bulk absorbance measurements and visualization in sample tubes lacked the sensitivity compared to the filter system at 30 min for Gram-positives other than S. aureus, longer incubation times (>40 min) can enable the applicability of the assay in sample tubes to other targets. To demonstrate the feasibility of the NB-vanco assay for biological samples, the assay was performed for bacteria spiked into serum. Assay results showed that S. aureus spiked into bovine serum showed a significant decrease in absorbance value (67%) after 30 min, while E. coli did not show any changes in values (Fig. S4a ESI†). Also, S. aureus spiked into human serum obtained by gradient centrifugation of human whole blood, and applying through the porous filter system showed dense blue signal on the filter membrane, while E. coli showed a much weaker signal (Fig. S4b ESI†). Since naked eye detection of the nano-aggregates in sample tubes can give vague results and be practically difficult for clinical decision making, the integration of the porous filter system with the NB-vanco assay introduces a robust platform that potentially shows wide applicability in point-of-care, bedside or home settings.
954 ± 226), while the addition of NB-vanco with Gram-negative bacteria E. coli and K. pneumoniae or without addition of bacteria, did not show any significant signals (values ∼ 0). Fig. S3 (ESI†) shows the bulk absorbance measurements and visualization in sample tubes for the assay performed with different types of bacteria. For incubation times of 40 min or longer, the Gram-positive bacteria (S. aureus, S. pneumoniae, B. subtilis and E. faecalis) showed significant extents of precipitation, while Gram-negative bacteria did not show any detectable signal, similar to the results from applying the porous filter system. Among the different types of Gram-positive bacteria, S. aureus showed the highest degree of precipitation, which is presumably due to the higher targeting efficiency of vancomycin to S. aureus. Although bulk absorbance measurements and visualization in sample tubes lacked the sensitivity compared to the filter system at 30 min for Gram-positives other than S. aureus, longer incubation times (>40 min) can enable the applicability of the assay in sample tubes to other targets. To demonstrate the feasibility of the NB-vanco assay for biological samples, the assay was performed for bacteria spiked into serum. Assay results showed that S. aureus spiked into bovine serum showed a significant decrease in absorbance value (67%) after 30 min, while E. coli did not show any changes in values (Fig. S4a ESI†). Also, S. aureus spiked into human serum obtained by gradient centrifugation of human whole blood, and applying through the porous filter system showed dense blue signal on the filter membrane, while E. coli showed a much weaker signal (Fig. S4b ESI†). Since naked eye detection of the nano-aggregates in sample tubes can give vague results and be practically difficult for clinical decision making, the integration of the porous filter system with the NB-vanco assay introduces a robust platform that potentially shows wide applicability in point-of-care, bedside or home settings.
The current study introduces a diagnostic platform with several advantages. Firstly, the integrated NB-vanco-porous filter system represents a one-step colorimetric assay platform, allowing detection with the naked eye. This enables the platform to be extremely simple, by excluding the need of any detection device, such as lasers, detectors, optical filters, and complex read-out components. Conventional methods using turbidity measurements requires a volume of ∼milliliter, while micro-volume spectrophotometers are quite expensive in cost. The NB-vanco assay allows the visualization of bacteria in small volume (as small as 20 μl) without any instruments for detection, which would greatly reduce manufacturing costs and enable easier miniaturization. Another advantage is that the platform can be used as a rapid diagnostic assay for ubiquitous detection of Gram-positive bacteria, which can replace the conventional staining and microscopic methods which is labor-intensive, and the immunoassays which are limited due to availability and specificity of antibodies. Finally, the current platform involves minimized sample processing steps, without the need of procedures such as lysis, nucleic acid extraction, or amplification. Technical improvements would have to be achieved in the future, by increasing sensitivity of detection, further miniaturization, and automation of the platform. Overall, the integrated NB-vanco-porous filter system has wide applicability as a simple, rapid, and affordable diagnostic platform at the bedside or point-of-care settings, which will greatly benefit the society by allowing proper antibiotic use and enhancing treatment efficacy.
Conclusions
We have developed a rapid and simple colorimetric assay based on nano-aggregate formation for ubiquitously detecting Gram-positive bacteria. Vancomycin was used as the ligand to specifically target Gram-positive bacteria. Addition of NB-vanco with Gram-positive targets induced the rapid clustering (<30 min) of the nanobeads with bacteria, which could be visualized with the naked eye as blue precipitates in the sample tubes. The NB-vanco assay was applied to a porous filter system, as an integrated diagnostic platform. Various types of Gram-positive bacteria could be clearly visualized as blue precipitates on the filter membrane, while Gram-negative bacteria resulted in neglectable signals. Assay results from the porous filter system could also be acquired as images using a smart mobile device and analyzed for quantitative determination. The current study demonstrates that the NB-vanco assay integrated with the porous filter system, due to its simplicity, can be useful as a rapid diagnostic platform for applications at the bedside in the clinic or point-of-care settings.Conflicts of interest
There are no conflicts to declare.Acknowledgements
The study was supported by grants from the Ministry of Health and Welfare of Korea (HI14C2270 and HI15C1946), the National Research Foundation of Korea (2015R1C1A1A02036647 and 2018R1A2B6004525), the Ministry of Trade, Industry and Energy of Korea (N0002463), and the Samsung Research Funding and Incubation Center for Future Technology (SRFC-IT1801-02).Notes and references
- K. E. Jones, N. G. Patel, M. A. Levy, A. Storeygard, D. Balk, J. L. Gittleman and P. Daszak, Nature, 2008, 451, 990–993 CrossRef PubMed.
- Centre for Evidence-Based Medicine, http://www.cebm.net/wp-content/uploads/2015/07/AMR-Diagnostic-technologies_10-June-2015.pdf, (accessed March 2017).
- T. J. Silhavy, D. Kahne and S. Walker, Cold Spring Harbor Perspect. Biol., 2010, 2, a000414 Search PubMed.
- J. H. Kim, J. Lee, J. Park and Y. S. Gho, Semin. Cell Dev. Biol., 2015, 40, 97–104 CrossRef PubMed.
- M. A. Farha and E. D. Brown, Ann. N. Y. Acad. Sci., 2015, 1354, 54–66 CrossRef PubMed.
- M. A. Kohanski, D. J. Dwyer and J. J. Collins, Nat. Rev. Microbiol., 2010, 8, 423–435 CrossRef PubMed.
- M. J. D. Esmatabadi, A. Bozorgmehr, S. N. Hajjari, A. S. Sombolestani, Z. V. Malekshahi and M. Sadeghizadeh, Microbiol. Mol. Biol. Rev., 2017, 63, 40–48 Search PubMed.
- K. Lewis, Nat. Rev. Drug Discovery, 2013, 12, 371–387 CrossRef PubMed.
- O. O. Komolafe, Malawi Med. J., 2003, 15, 63–67 Search PubMed.
- C. L. Ventola, Pharmacol. Ther., 2015, 40, 277–283 Search PubMed.
- J. Davies and D. Davies, Microbiol. Mol. Biol. Rev., 2010, 74, 417–433 CrossRef PubMed.
- N. Brusselaers, D. Vogelaers and S. Blot, Ann. Intensive Care, 2011, 1, 47 CrossRef PubMed.
- R. Laxminarayan, A. Duse, C. Wattal, A. K. M. Zaidi, H. F. L. Wertheim, N. Sumpradit, E. Vlieghe, G. L. Hara, I. M. Gould, H. Goossens, C. Greko, A. D. So, M. Bigdeli, G. Tomson, W. Woodhouse, E. Ombaka, A. Q. Peralta, F. N. Qamar, F. Mir, S. Kariuki, Z. A. Bhutta, A. Coates, R. Bergstrom, G. D. Wright, E. D. Brown and O. Cars, Lancet Infect. Dis., 2013, 13, 1057–1098 CrossRef PubMed.
- A. M. Caliendo, D. N. Gilbert, C. C. Ginocchio, K. E. Hanson, L. May, T. C. Quinn, F. C. Tenover, D. Alland, A. J. Blaschke, R. A. Bonomo, K. C. Carroll, M. J. Ferraro, L. R. Hirschhorn, W. P. Joseph, T. Karchmer, A. T. MacIntyre, L. B. Reller and A. F. Jackson, Clin. Infect. Dis., 2013, 57, S139–S170 CrossRef PubMed.
- K. Shigemura, T. Shirakawa, H. Okada, K. Tanaka, S. Kamidono, S. Arakawa and A. Gotoh, Clin. Exp. Med., 2005, 4, 196–201 CrossRef PubMed.
- N. Woodford and D. M. Livermore, J. Infect., 2009, 59, S4–S16 CrossRef PubMed.
- A. Klausegger, M. Hell, A. Berger, K. Zinober, S. Baier, N. Jones, W. Sperl and B. Kofler, J. Clin. Microbiol., 1999, 37, 464–466 Search PubMed.
- P. E. Fournier, M. Drancourt, P. Colson, J. M. Rolain, B. L. Scola and D. Raoult, Nat. Rev. Microbiol., 2013, 11, 574–585 CrossRef PubMed.
- P. E. Fournier, G. Dubourg and D. Raoult, Genome Med., 2014, 6, 114 CrossRef PubMed.
- K. B. Barken, J. A. J. Haagensen and T. Tolker-Nielsen, Clin. Chim. Acta, 2007, 384, 1–11 CrossRef PubMed.
- S. Yang and R. E. Rothman, Lancet Infect. Dis., 2004, 4, 337–348 CrossRef PubMed.
- S. Park, Y. Zhang, S. Lin, T. H. Wang and S. Yang, Biotechnol. Adv., 2011, 29, 830–839 CrossRef PubMed.
- S. Sauer and M. Kliem, Nat. Rev. Microbiol., 2010, 8, 74–82 CrossRef PubMed.
- X. Jiang, N. Shao, W. Jing, S. Tao, S. Liu and G. Sui, Talanta, 2014, 122, 246–250 CrossRef PubMed.
- S. C. B. Gopinath, T. H. Tang, Y. Chen, M. Citartan and T. Lakshmipriya, Biosens. Bioelectron., 2014, 60, 332–342 CrossRef PubMed.
- A. Niemz, T. M. Ferguson and D. S. Boyle, Trends Biotechnol., 2011, 29, 240–250 CrossRef PubMed.
- L. Bissonnette and M. G. Bergeron, Clin. Microbiol. Infect., 2010, 16, 1044–1053 CrossRef PubMed.
- A. Ahmed, J. V. Rushworth, N. A. Hirst and P. A. Millner, Clin. Microbiol. Rev., 2014, 27, 631–646 CrossRef PubMed.
- M. S. Verma, J. L. Rogowski, L. Jones and F. X. Gu, Biotechnol. Adv., 2015, 33, 666–680 CrossRef PubMed.
- W. Zhou, X. Gao, D. Liu and X. Chen, Chem. Rev., 2015, 115, 10575–10636 CrossRef PubMed.
- J. H. Kang, Y. Asami, M. Murata, H. Kitazaki, N. Sadanaga, E. Tokunaga, S. Shiotani, S. Okada, Y. Maehara, T. Niidome, M. Hashizume, T. Mori and Y. Katayama, Biosens. Bioelectron., 2010, 25, 1869–1874 CrossRef PubMed.
- X. Liu and Q. Huo, J. Immunol. Methods, 2009, 349, 38–44 CrossRef PubMed.
- X. Xu, Y. Ying and Y. Li, Sens. Actuators, B, 2012, 175, 194–200 CrossRef.
- X. Xu, Y. Yuan, G. Hu, X. Wang, P. Qi, Z. Wang, Q. Wang, X. Wang, Y. Fu, Y. Li and H. Yang, Sci. Rep., 2017, 7, 1452 CrossRef PubMed.
- X. Yang, Y. Dang, J. Lou, H. Shao and X. Jiang, Theranostics, 2018, 8, 1449–1457 CrossRef PubMed.
- L. Zheng, P. Qi and D. Zhang, Sens. Actuators, B, 2018, 260, 983–989 CrossRef.
- D. Kwon, S. Lee, M. M. Ahn, I. S. Kang, K. H. Park and S. Jeon, Anal. Chim. Acta, 2015, 883, 61–66 CrossRef PubMed.
- H. J. Chung, T. Reiner, G. Budin, C. Min, M. Liong, D. Issadore, H. Lee and R. Weissleder, ACS Nano, 2011, 5, 8834–8841 CrossRef PubMed.
- X. Su, M. Wang, H. Ouyang, S. Yang, W. Wang, Y. He and Z. Fu, Sens. Actuators, B, 2017, 241, 255–261 CrossRef.
- G. Feng, Y. Yuan, H. Fang, R. Zhang, B. Xing, G. Zhang, D. Zhang and B. Liu, Chem. Commun., 2015, 51, 12490–12493 RSC.
- Z. G. Jia, M. L. O'mara, J. Zuegg, M. A. Cooper and A. E. Mark, FEBS J., 2013, 280, 1294–1307 CrossRef PubMed.
- K. Takács-Novák, B. Noszál, M. Tókés-Kövesdi and G. Szász, Int. J. Pharm., 1993, 89, 261–263 CrossRef.
- J. L. H. Johnson and S. H. Yalkowsky, AAPS PharmSciTech, 2006, 7, E33–E37 CrossRef PubMed.
- P. J. Baldevbhai and R. S. Anand, IOSR Journal of Electronics and Communication Engineering, 2012, 1, 24–45 CrossRef.
- A. J. Kell, G. Stewart, S. Ryan, R. Peytavi, M. Boissinot, A. Huletsky, M. G. Bergeron and B. Simard, ACS Nano, 2008, 2, 1777–1788 CrossRef PubMed.
- J. Eirich, R. Orth and S. A. Sieber, J. Am. Chem. Soc., 2011, 133, 12144–12153 CrossRef PubMed.
- Y. Gilbert, M. Deghorain, L. Wang, B. Xu, P. D. Pollheimer, H. J. Gruber, J. Errington, B. Hallet, X. Haulot, C. Verbelen, P. Hols and Y. F. Dufrêne, Nano Lett., 2007, 7, 769–801 CrossRef PubMed.
- B. K. Hubbard and C. T. Walsh, Angew. Chem., Int. Ed., 2003, 42, 730–765 CrossRef PubMed.
- W. Rastawicki, I. Paradowska-Stankiewicz, P. Stefanoff and A. A. Zasada, Med. Dosw. Mikrobiol., 2011, 63, 73–80 Search PubMed.
Footnotes |
| † Electronic supplementary information (ESI) available. See DOI: 10.1039/c8ra03540g |
| ‡ Equal contribution. |
| This journal is © The Royal Society of Chemistry 2018 |

