DOI:
10.1039/C8RA03573C
(Paper)
RSC Adv., 2018,
8, 25856-25865
Synthesis of self-assembled mesoporous 3D In2O3 hierarchical micro flowers composed of nanosheets and their electrochemical properties†
Received
25th April 2018
, Accepted 2nd July 2018
First published on 18th July 2018
Abstract
This report describes the methodology for the fabrication of mesoporous In2O3 microflowers by hydrothermal and calcination procedures in which In(OH)3/In2S3 acts as an intermediate. Both In2O3 and its precursor were analyzed with scanning electron microscopy, energy dispersive X-ray spectrophotometry, transmission electron microscopy and powder X-ray diffraction. BET surface area, pore size and pore volume analyses were also carried out. Electron microscopy images clearly evidence the self-assembly of 2D nanosheets into the micro flower structure. The mechanism of self-assembly and calcination is reported. Electrochemical properties of the synthesized In2O3 micro flowers were studied.
1. Introduction
The synthesis of semiconductor nanomaterials with extraordinary shapes and structures are of great interest since these properties can significantly influence the semiconducting properties of such materials. Therefore, the development of synthetic pathways that give rise to certain nanoscopic features is important. Decomposition of simple precursor components in benign hydrothermal conditions presents an interesting strategy to yield novel nanosized 3D structures with a large surface area. One semiconducting material, which represents a suitable candidate for such an approach, is indium(III) oxide, In2O3, which has a wide band gap of 3.55–3.75 eV (analogous to GaN). In2O3 has been shown to have many promising utilization areas such as gas sensors, solar cells and flat-panel displays.1–6 Versatile morphological properties of In2O3 are demonstrated in several studies, wherein various shapes, such as nanocubes, nanorods and microspheres, have been reported.7–23 Generally, In(OH)3 and InOOH are used as precursors for the synthesis of In2O3.7–20 Synthesis of In2O3 via In(OH)3/In2S3 as an intermediate mesostructure, followed by calcination, presents an interesting option which allows variation of morphology and porosity due to the intermediate structure which is eventually oxidized to In2O3.21–33 There are some latest reports on the fabrication and characterization of morphologically interesting nano materials.34–37 Variation of the nanostructure using this synthetic pathway arises largely from the selection of the precursor components. Although many organic compounds can be used as a sulfur source, careful selection is obligatory as the organic compounds (if the process is free from calcination) can be incorporated with the positively charged metal ions on the surface of nanoparticles and thereby limit the mobility of the charge carrier in electronic devices. Dithiobiuret is an interesting candidate in this regard as the decomposition products are volatile and hence the formed nanoparticles will be free from organic impurities.
One of our particular areas of interest is morphosynthesis of porous hierarchical structures such as 3D microflowers.38 Within this scope, we herein demonstrate the self-assembly of 3D structural template consisting of indium sulfide and hydroxide synthesized in hydrothermal conditions using dithiobiuret as the sulfur source and its subsequent calcination to a In2O3 nanostructure. The 3D In2O3 microflowers are formed by the aggregation of 2D nanoflakes with a high degree of compositional control. The structural and physical properties of these complex hierarchical structures are analyzed with SEM, EDX and TEM as well as by nitrogen adsorption analysis. Furthermore, the phase identification of samples was confirmed by powder X-ray diffraction (PXRD). An electrochemical study of the synthesized In2O3 micro flowers with an aim to understand the charge storage property has been carried out in detail.
2. Experimental details
2.1. Synthesis of indium oxide
Milli Q-Plus water (resistance = 18.2 M Ω) was used for all the experimental work. In2S3/In(OH)3 micro flowers were prepared using indium nitrate (1.5 g, 5 mmol) and dithiobiuret (1.0 g, 7.5 mmol). Indium nitrate and dithiobiuret were separately dissolved in about 50 mL of water and heated till boiling. Hot solutions were mixed under stirring (200 rpm) and after 30 min the mixture was transferred into a 250 mL Teflon cup, which was further filled with 50 mL of water. Sealed Teflon vessel was put into a stainless steel shell and was autoclaved at 150 °C for 15 h. After the hydrothermal reaction, the flask was allowed to cool down to room temperature and the precipitate formed was filtered, washed with water and ethanol in order to eliminate possible impurities. It was then dried in an air oven at 120 °C for 2 h. In2O3 microflowers were prepared in hot air oven by calcinating the precursors (In2S3/In(OH)3) at 600 °C for 6 h, followed by cooling down to room temperature before collecting the product. In this work, we aimed at the synthesis of structures with intriguing morphology, thus only the optimized reaction conditions are reported and the reaction conditions which resulted in inhomogeneous or broken morphologies are deliberately left out from the discussion.
2.2. SEM, TEM and powder PXRD measurements
The morphology of prepared bulk was examined using Hitachi S-4100 scanning electron microscope (SEM). Prior to SEM measurements, the samples were mounted on a carbon platform that was then coated with platinum using a magnetron sputter for 10 minutes. The ratio between In, S and O within the samples were analyzed using an energy-dispersive X-ray spectrophotometer installed in the scanning electron microscope. For transmission electron microscope (TEM) study, the sample was dispersed onto a Cu grid with holey carbon supporting films and studied at room temperature in a Tecnai F20 microscope operated at 200 kV. Powder X-ray diffraction (PXRD) was carried out using PANalytical X'Pert PRO diffractometer with Cu Kα1 radiation (1.5406 Å; 45 kV, 40 mA). A sample was placed on a silicon-made (producing zero-background signal) sample holder using petrolatum jelly as an adhesive. Data was recorded with X'Celerator detector in 2θ-range of 8–80° using step size of 0.02° and counting time of 140 s per step.
Average crystal sizes of the substances were determined using Scherrer equation (eqn (1)) and values were corrected by the instrumental broadening.
| |
 | (1) |
where in
D stands for average size of the crystals,
K as shape-dependent Scherrer's constant (0.9),
λ as radiation wavelength (1.5406 Å), and
β as integral breath given in radians subtracted by instrumental broadening (determined with a silicon standard measured using the above said experimental settings).
2.3. Electrochemical studies
Cyclic voltammetry studies were performed using SP-150, Bio-Logic Science Instruments. A three electrode cell configuration comprising active material coated glassy carbon electrode (area 0.071 cm2), Pt wire and Ag/AgCl were used as the working, counter and reference electrodes respectively. For the fabrication of electrode, a mixture of 1 mg of active material (In2O3) and 1 ml of water was sonicated for 15 minutes and from the resultant suspension 5 microlitre was casted on GCE (working electrode).
3. Results and discussion
3.1. SEM analysis
The surface morphologies of the hydrothermal and calcinated products were further analyzed by SEM. From the SEM images of the hydrothermal product (Fig. 1) it was observed that the microstructures with flower-like morphology are formed with the size distribution of around 0.8 to 1.2 μm. Microflowers are built from small 2D nanosheets with thickness of 20–30 nm (Fig. 1e and f). These thin nanosheets, that are analogous to petals of flowers, are aligned to the spherical surface by pointing toward a common center. The microflower structures are highly dispersed and assembled by many interleaving and bending nanosheets with the thickness of less than 30 nm. From SEM or EDX we were unable to differentiate In(OH)3 from In2S3 structures as the micro flowers exhibit peaks due to both oxygen and sulfur in EDX (Fig. S1†).
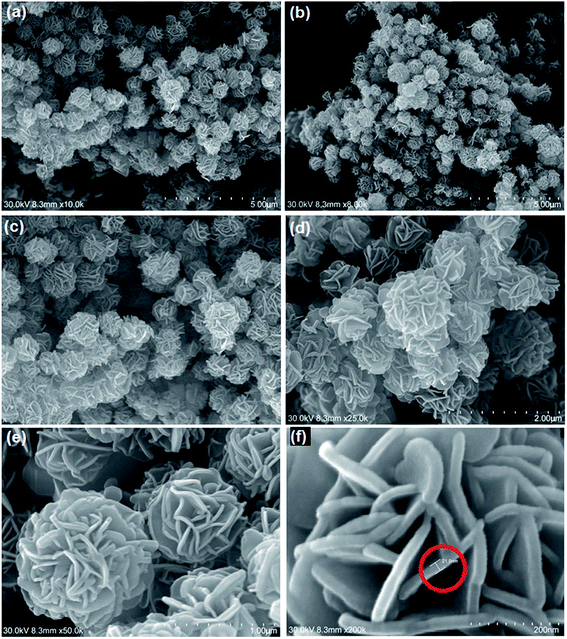 |
| | Fig. 1 SEM images of hydrothermal products; (a–d) mono-dispersed micro flower structures of hydrothermal products; (e) micro flowers composed of nano sheet (petals); (f) nano sheet with the breadth of 21.5 nm. | |
SEM images of the calcinated product (Fig. 2) showed that the morphology was conserved after calcination. However, thinning of nanosheet with curly structures, which are porous in nature, was observed. SEM image of In2O3 microflowers (Fig. 2) suggests that the petals with the sharp edges in the precursors are transformed into nanochain-like structures composed of small beads with the size of <10 nm (Fig. 2h). This is easily visualized by comparing the Fig. 1f and Fig. 2f–h. It is important to note that the overall dimensions of the microflowers stay intact during the calcination process; however, the formation of bead-like structures with the thinning of petals is evidenced. The petal thinning in microflowers as well as the deformation of sharp edges to bead-like structures are due to the removal of SO2 from In2S3/In3S4 and H2O from In(OH)3 during calcination. Hence, the resulting In2O3 seems to exhibit porosity (Fig. 2f–h).
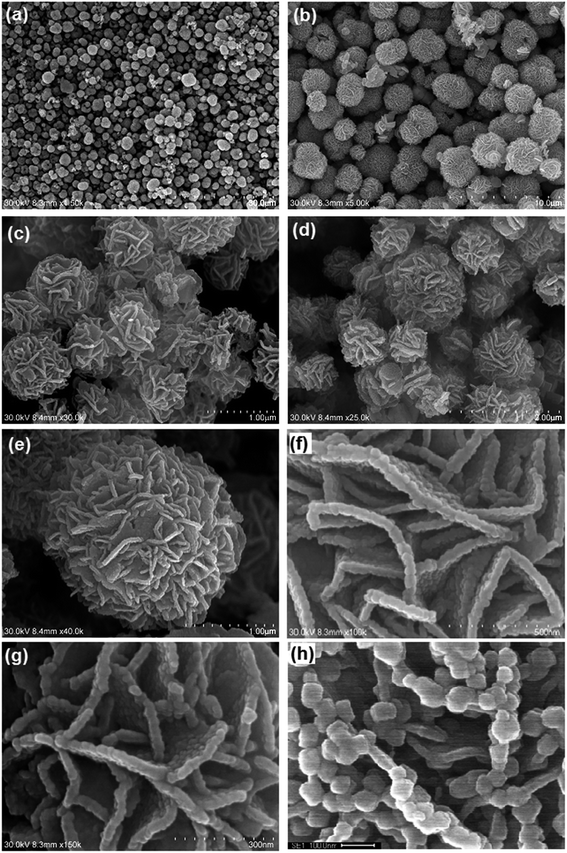 |
| | Fig. 2 SEM images of In2O3 microflowers; (a and b) homogeneous structure of microflowers; (c–e) microflowers with different dimensions (f and g) basic building units of microflowers (nanosheet) (h) bead-like structure in nanosheets. | |
3.2. EDX analysis
EDX spectrum of the hydrothermal product (Fig. S1†) showed peaks arising from the presence of indium, sulfur and oxygen. The In, S and O atomic ratio was not in line with the general formula In(OH)3/In2S3 as the hydrothermal product was a mixture of indium sulfides and indium oxide which is evident from the EDX analysis and was further confirmed from powder PXRD analysis (vide infra). The remaining peak observed at 1.5 keV is due to Al holder over which the sample was placed. EDX spectrum of calcinated product (Fig. S2†) is devoid of peak due to sulfur at 2.33 keV (KR1), which was intensely present in the EDX of hydrothermal product. This shows the complete conversion of indium sulfides to indium oxide during calcination. The stoichiometry of indium and oxygen in the calcinated product was found to be closer to 2![[thin space (1/6-em)]](https://www.rsc.org/images/entities/char_2009.gif) :
:![[thin space (1/6-em)]](https://www.rsc.org/images/entities/char_2009.gif) 3 indicating the formation of In2O3. This was further confirmed by PXRD analysis.
3 indicating the formation of In2O3. This was further confirmed by PXRD analysis.
3.3. TEM analysis
TEM images of the hydrothermal products were shown in Fig. 3. The dark and light contrast (Fig. 3b, d, e and f) of the petals of the microflowers in TEM images are due to the difference in orientations of petals with respect to the electron beam. When the edges of the petals are parallel to electron beam it appears dark in contrast (Fig. 3d and e) whereas, when the surface of the petals is parallel to the electron beam they appear light in contrast (Fig. 3f). Similarly, the folded areas are also dark in contrast. TEM images of hydrothermal product clearly evidence the self-assembly of 2D nanosheets into microflower structure. The annular electron diffraction pattern indicates that the hydrothermal product is polycrystalline.
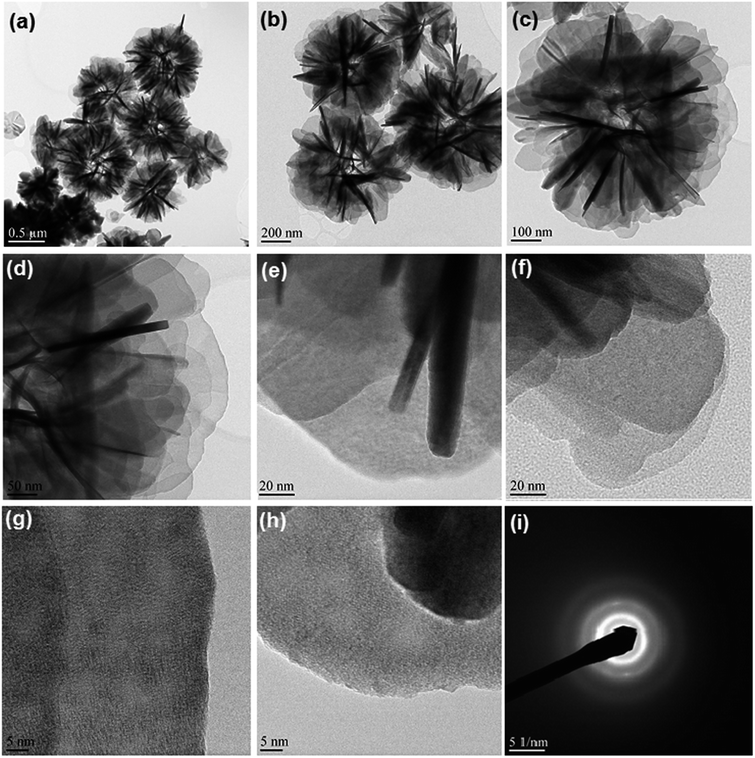 |
| | Fig. 3 TEM images of hydrothermal product; (a–c) overall images of microflowers; (d–f) images of thin petals of microflowers; (g and h) images showing sharp edges of petals (i) SAED pattern of hydrothermal product. | |
After calcination, retention of morphology (Fig. 4) and the thinning of petals or nanoflakes into wafer like structure were observed. In the calcinated product, the flakes are curved with wavy margins and the magnified view is shown in Fig. 4e and f, which reveals that the structure is highly porous as discussed above. It has been reported earlier23 that the formation of porous structures in In2O3 is due to the distortion of crystal lattice by internal tensile stress as a result of change in bond parameters during the conversion of In2S3 to In2O3. The loss of H2O and SO2 molecules from the precursors (In(OH)3 or In2S3 respectively) results in the formation of In2O3 nanoparticles with the size of 20 to 25 nm which are the basic building units of mesoporous hierarchical microflower structure. The TEM images Fig. 4e and f showed that the material is composed of particles.
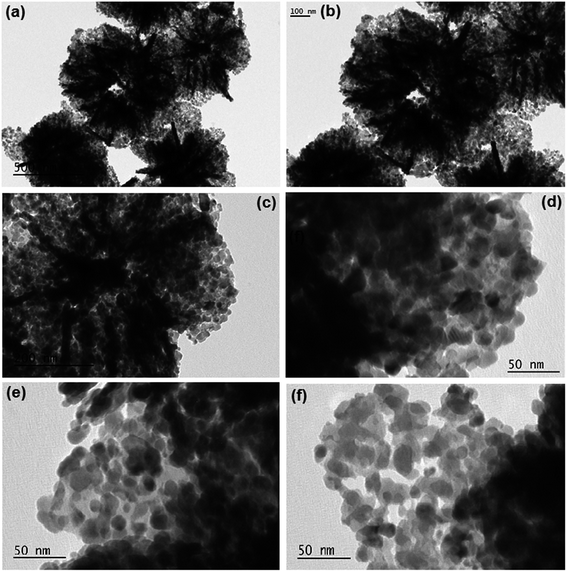 |
| | Fig. 4 TEM images of In2O3 microflowers; (a–c) low magnification TEM images; (d–f) high magnification TEM images. | |
3.4. X-ray diffraction analysis
The phase identification of samples was made by powder X-ray diffraction (PXRD). In the PXRD pattern of the hydrothermal product (Fig. S3†), characteristic diffraction peaks of In2S3, In3S4 and In2O3 phases can be identified indicating phase mixture of all three. Similarly, after calcination at 400 °C for 2 h the PXRD pattern shows a mixture of In3S4 and In2O3 (Fig. S4†) indicating the conversion from In2S3 or In3S4 to In2O3 has occurred only partially. However, based on further calcination tests during which hydrothermal products were calcined at 600 °C for 6 h, In2O3 is the sole component as identified in the acquired PXRD pattern (Fig. 5).21,22 It was reported24 that for the formation of 3D porous structures from 2D nanosheets, surfactants are indispensable as they can cap the crystal surface selectively and the face with high density of surface atoms is blocked by the adsorption of surfactants during crystal growth. However, in our present study surfactants or other reagents are not used and the 3D microflowers were observed with superior control over shape and size. Scherrer analysis for the average crystal size of the final calcination product at 600 °C, gave size range of 20–23 nm.
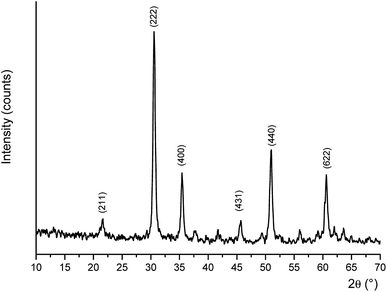 |
| | Fig. 5 X-ray powder diffraction pattern of the product calcinated at 600 °C for 2 h. Characteristic peak positions of In2O3 are indicated by their Miller indices. | |
3.5. Surface area analysis
Fig. 6 shows the typical sorption isotherms of In2O3 microflowers. The prepared In2O3 microflowers exhibited a hysteresis loop in a high relative pressure range of 0.77 to 0.98, which is characteristic of type IV isotherm according to IUPAC classification and evidences the presence of mesopores. The observed BET surface area is 70.28 m2 g−1 for In2O3 microflowers which is higher compared to the reported In2O3 porous materials.7,9 The total pore volume is 0.154 cm3 g−1 and the average pore diameter is 1.518 nm. The observed results exemplify the mesoporous nature of In2O3 microflowers. Since the surface area is very high it may have potential application as a catalyst or in gas storage.
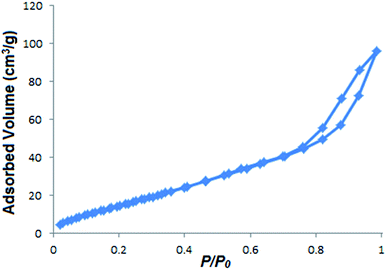 |
| | Fig. 6 Nitrogen adsorption–desorption isotherm of In2O3 micro flowers. | |
3.6. Hydrothermal reactions, growth mechanism and calcination reactions
In the described synthetic process we have used dithiobiuret as a sulfur source which, together with indium salt (In(NO3)3), was expected to give indium sulfide during hydrothermal process. To our surprise we observed the formation of In(OH)3 as a major hydrothermal product along with the formation of In2S3 and In3S4 as minor products. The whole hydrothermal and calcination process can be explained by the following eqn (2)–(6).| | |
NH2CSNHCSNH2 + 5H2O → 3NH4+ + OH− + S2− + 2CO2 + H2S
| (2) |
| | |
In3+ + 3OH− → In(OH)3
| (3) |
| | |
2In3+ + 3S2− → In2S3/In3S4
| (4) |
| | |
2In(OH)3 → In2O3 + 3H2O
| (5) |
| | |
2In2S3 + 6O2 → 2In2O3 + 3SO2
| (6) |
In this process dithiobiuret decomposes slowly leading to a low degree of supersaturation in solution and resulting in the nucleation between S2− and In3+ ions at the initial period of the hydrothermal treatment as shown in eqn (2) and (4). Although the dithiobiuret releases S2− ions thus generating In2S3/In3S4, the formation of In(OH)3 under hydrothermal conditions (eqn (3)) is prevalent over indium sulfide(s) formation due to the presence of excess OH−. The formation of In(OH)3 has not been previously reported in the synthesis of In2S3 under hydrothermal conditions with various other sulfur sources such as thioacetamide, L-cysteine, thiourea, sodium thiosulfate, elemental sulfur and dithiocarbamate.21–33 On the other hand, the formation of In(OH)3 has been shown to occur in the absence of sulfur sources via direct hydrolysis of simple indium salts, such as In(NO3)3, under hydrothermal conditions.13 Hence, in our system, the degradation of dithiobiuret into OH− and S2− ions results into a competition between the formation of In(OH)3 and In2S3/In3S4 from which the predominant species is probably In(OH)3 since its formation is favored under hydrothermal conditions. In addition to acting as a sulfide and hydroxide source, dithiobiuret is as a shape controlling agent and an organic base and has a clear impact on the formation of the observed uniform and visually appealing morphology of microflowers with sharp edges. Microflowers are formed during the hydrothermal process from nanoscopic petals (nanoflakes) in the absence of surfactants or templates. The process could be explained in terms of Ostwald ripening mechanism according to which the nanoflakes are formed at the expense of the smaller nuclei that are formed initially (Fig. S5†). In nano particles different crystal planes have different surface energies, and of those the planes having the higher surface energies are preferred by crystal growth mechanism defined as Oswald ripening (wherein larger particles tend to grow further by expense of smaller particles).39 For the minimization of surface energy, flakes aggregate to form a spherical structure during the surface kinetics process, finally resulting in the formation of hierarchical microflowers. The lateral growth through the spherical diffusion model was proposed already23 for the formation of flake-like morphologies from smaller nuclei.36 Subsequently, the flakes act as building blocks and point towards the common center thereby creating the obtained flower-like morphology. The lateral growth through the mass transfer process at the hydrothermal conditions has been discussed already.39
During the calcination process, the precursors were converted into In2O3 as shown in eqn (5) and (6). The exhaustion of sulfur atoms, which has been shown to occur in oxidation of In2S3 to In2O3,21 was ruled out in our case as we have not observed any formation of elemental sulfur during the calcination process. In such case, SO2 would have been liberated and the evaporation of SO2 molecules would then result in the destruction of flake-like structure and to the formation of small indium oxide nanoparticles. However, the absence of such particles was unequivocally proved by SEM and TEM measurements. The conversion of the hydrothermal product to In2O3 was partial after 2 h at 400 °C (Fig. S4†). The precursors are completely converted into In2O3 after 6 h at 600 °C which was evidenced by PXRD wherein the obtained pattern lacks diffraction peaks originating from other crystalline phases (Fig. 5). It is noteworthy that In(OH)3 → In2O3 conversion is straightforward and other products like oxyhydroxides (InOOH) are not formed during the calcination.
3.7. Effect of reaction parameters and additives
It was clear that the increase in reaction time resulted in slight increase in the dimensions of microflowers and also thickening of petals.28 This could be due to the deposition of smaller nuclei to the larger crystals formed already. Similarly, changing the reactants ratio does not have a meaningful influence on the morphology of microflowers. Whereas, extending the calcination to 10 h results in the breaking of microflower structure by creating holes with the size range of 100 to 200 nm [Fig. 7a–c]. Interestingly, the addition of ethylenediamine seems to have a spectacular effect on the nanoparticle morphology as spherical and oval shapes are formed [Fig. 7d] whereas the microflower morphology was not anymore observed. We are currently exploring the effects of different additives on morphology and report these results at a later time.
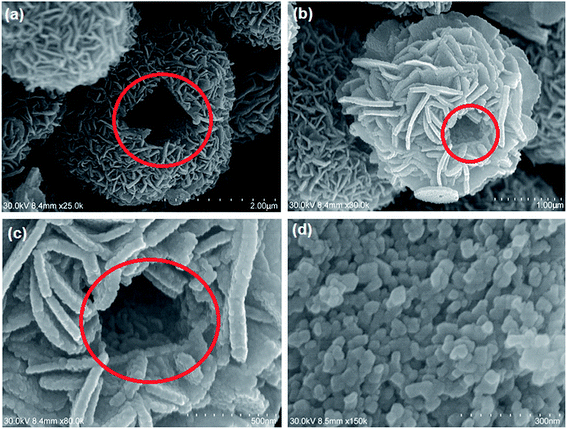 |
| | Fig. 7 SEM images of (a–c) broken In2O3 microstructures; (d) In2O3 nanoparticles formed with the addition of EDA during hydrothermal process. | |
3.8. Electrochemical studies
Fig. 8 shows the typical cyclic voltammogram (at various scan rates) of In2O3 on glassy carbon electrode (GCE) in 1 M Na2SO4 between −0.6 to 0.6 V vs. Ag/AgCl. In general, the area under the CV curve represents the amount of charge stored in the electrode material. In the CV curve, two quasi reversible redox peaks are observed which illustrate the sequential transitions of In3+ to In+. The main pseudocapacitance behaviour of the sample can be attributed to the quasi-reversible redox transition of In3+ to In+ and vice versa.40 The capacitive behaviour of In2O3 is clearly seen from the figure with near rectangular shaped voltammograms and larger CV currents. Nevertheless, In2O3 has various reduction potential ranges from −0.14 to −1.034 (SHE), the one observed at −0.52 V against Ag/AgCl indicates that the synthesized In2O3 is in In3+ which is reduced to In+ under the given potential. The possible redox reaction can be written as
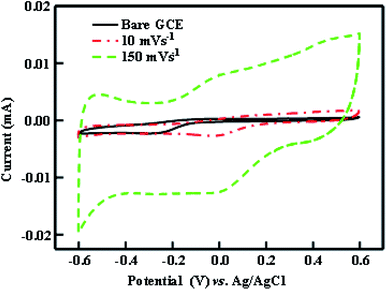 |
| | Fig. 8 Cyclic voltammograms (CVs) of bare GCE and In2O3/GCE electrodes in 1 M Na2SO4 electrolyte. | |
The specific capacitance values as a function of scan rate of CV are shown in Fig. 9. The SC value of 75 F g−1 and 37 F g−1 has been obtained at the scan rate of 10 mV s−1 and 100 mV s−1 respectively. The specific capacitance of the electrode is decreased with increase of scan rate. The reason for the variation of specific capacitance with scan rate can be explained with the following points; (i) at high scan rate, the ions from electrolyte have less accessible time to diffuse into the electrode material resulting in lower specific capacitance. Hence, only limited amount of charge is stored (surface) which leads to decrease of specific capacitance, (ii) at low scan rate, the ions from electrolyte have the ability to access both inner and outer surface of the electrode material which leads to higher specific capacitance. Comparison of specific capacitance values for In2O3 materials reported in literature and from this work is shown in Table 1.
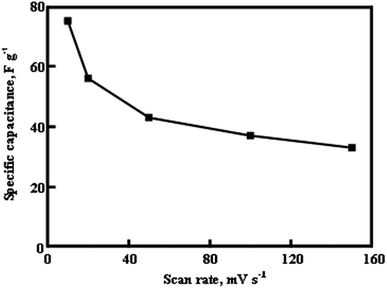 |
| | Fig. 9 Specific capacitance of In2O3/GCE electrodes against the scan rate. | |
Table 1 Comparison of specific capacitance values of In2O3 materials
| In2O3 materials |
Specific capacitance |
| Porous indium oxide hollow spheres (PIOHS)41 |
320 F g−1 and 185 F g−1 @ 1 A g−1 |
| In2O3 nanoparticles/CNT42 |
64 F g−1 |
| In2O3-impregnated mesoporous carbon42 |
275 F g−1 |
| Nano rod In2O3 (ref. 43) |
104.9 F g−1 @ 8 A g−1 |
| Nanostructured indium oxide44 |
190 F g−1 @ 10 mV s−1 |
| 80 F g−1 @ 1000 mV s−1 |
| In2O3 nanostructures45 |
|
| (a) Nanotowers |
10.1 mF cm−2 |
| (b) Nanobouquets |
12.5 mF cm−2 |
| (c) Nanocones |
4.9 mF cm−2 |
| (d) Nanowires |
16.6 mF cm−2 |
| In this work |
75 F g−1 @ 10 mV s−1 |
| 37 F g−1 @ 100 mV s−1 |
The reduced specific capacitance for the synthesized In2O3 micro flower (in this work) may be due to the mesoporous nature of 3D sheets of In2O3. The mesoporous material may hold the ions for a longer time and hence the amount of charge on the surface gets decreased and also the specific capacitance.
Fig. 10 clearly indicates that the CV currents increase linearly with an increase in scan rate which shows the high power property of In2O3. At a high scan rate, a large value of specific capacitance indicates that In2O3 can be a promising material for redox supercapacitors.
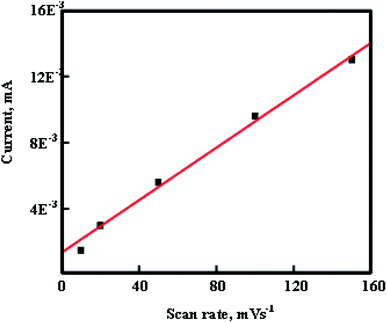 |
| | Fig. 10 CV current of In2O3/GCE electrodes against the scan rate. | |
4. Conclusions
Porous In2O3 microstructures were prepared from indium nitrate and dithiobiuret by hydrothermal and subsequent calcination method. The hydrothermal reaction products (which is a mixture of In2S3/In(OH)3) show 3D hierarchical architectures and were obtained by the self-assembly process with the involvement of Ostwald ripening mechanism. The microflowers are made of small 2D nanosheets with thickness of 20–30 nm. These thin nanosheets, analogous to petals of flowers, and are aligned to the spherical surface of the microflowers, pointing toward a common center. Calcination resulted in porous In2O3 microflowers which retained their morphology. The mechanism of hydrothermal and calcination reactions were discussed in detail. Effect of reaction parameters and additives were explored. Average crystal size of In2O3 nanoparticles was estimated to be about 23 nm. Cyclic voltammetric studies reveal the quasi-reversible redox transition of In3+ to In+ and vice versa. Specific capacitance values as a function of scan rate of CV were calculated. Surface area analysis reveals the mesoporous nature of the synthesized material (In2O3). With the decent surface area the synthesized In2O3 hierarchical microarchitechtures composed of nanosheets may have potential application as a catalyst or in gas storage.
Conflicts of interest
There are no conflicts to declare.
References
- W. Y. Chung, G. Sakai, K. Shimanoe, N. Miura, D. D. Lee and N. Yamazoe, Sens. Actuators, B, 1998, 46, 139–145 CrossRef.
- H. Cao, X. Qiu, Y. Liang, Q. Zhu and M. Zhao, Appl. Phys. Lett., 2003, 83, 761–763 CrossRef.
- M. Liess, Thin Solid Films, 2002, 410, 183–187 CrossRef.
- J. Tamaki, C. Naruo, Y. Yamamoto and M. Matsuoka, Sens. Actuators, B, 2002, 83, 190–194 CrossRef.
- E. Gagaoudakis, M. Bender, E. Douloufakis, N. Kataarakis, N. Natsakou, V. Cimalla and G. Kiriakids, Sens. Actuators, B, 2001, 80, 155–161 CrossRef.
- S. Parthiban, K. Ramamurthi, E. Elangovan, R. Martins and E. Fortunato, Appl. Phys. Lett., 2009, 94, 212101–212103 CrossRef.
- Z. He, Z. Chen, Y. Li, Q. Zhang and H. Wang, CrystEngComm, 2011, 13, 2557–2565 RSC.
- H. Y. Lai, T. H. Chen and C. H. Chen, CrystEngComm, 2012, 14, 5589–5595 RSC.
- J. Zai, J. Zhu, R. Qi and X. Qian, J. Mater. Chem. A, 2013, 1, 735–745 RSC.
- Z. Li, Y. Li, Y. Luan, J. Li and A. Song, CrystEngComm, 2013, 15, 1706–1714 RSC.
- D. Han, P. Song, H. Zhang, H. Yan, Q. Xu, Z. Yang and Q. Wang, RSC Adv., 2014, 4, 50241–50248 RSC.
- S. Guo, X. Zhang, Z. Hao, Z. Gao, G. Li and L. Liu, RSC Adv., 2014, 4, 31353–31361 RSC.
- J. Yang, C. Lin, Z. Wang and J. Lin, Inorg. Chem., 2006, 45, 8973–8979 CrossRef PubMed.
- Z. Zhuang, Q. Peng, J. Liu, X. Wang and Y. Li, Inorg. Chem., 2007, 46, 5179–5187 CrossRef PubMed.
- X. Liu, L. Zhou, R. Yi, N. Zhang, R. Shi, G. Gao and G. Qiu, J. Phys. Chem. C, 2008, 112, 18426–18430 CrossRef.
- D. V. Shinde, D. Y. Ahn, V. V. Jadhav, D. Y. Lee, N. K. Shrestha, J. K. Lee, H. Y. Lee, R. S. Mane and S. H. Han, J. Mater. Chem. A, 2014, 2, 5490–5498 RSC.
- Q. Wu, J. Chen, F. Zhang, P. Xiao, Y. Lu, X. Wang and Z. Hu, CrystEngComm, 2012, 14, 3397–3403 RSC.
- C. Wang, D. Chen and X. Jiao, J. Phys. Chem. C, 2009, 113, 7714–7718 CrossRef.
- H. Yang, L. Liu, H. Liang, J. Wei and Y. Yang, CrystEngComm, 2011, 13, 5011–5016 RSC.
- S. Wang, P. Wang, Z. Li, C. Xiao, B. Xiao, R. Zhao, T. Yang and M. Zhang, New J. Chem., 2014, 38, 4879–4884 RSC.
- A. Datta, S. K. Panda, D. Ganguli, P. Mishra and S. Chaudhuri, Cryst. Growth Des., 2007, 7, 163–169 CrossRef.
- P. Zhao, T. Huang and K. Huang, J. Phys. Chem. C, 2007, 111, 12890–12897 CrossRef.
- J. Liu, T. Luo, F. Meng, K. Qian, Y. Wan and J. Liu, J. Phys. Chem. C, 2010, 114, 4887–4894 CrossRef.
- L. Liu, H. Liu, H. Kou, Y. Wang, Z. Zhou, M. Ren, M. Ge and X. He, Cryst. Growth Des., 2009, 9, 113–117 CrossRef.
- S. Avivi, O. Palchik, V. Palchik, M. A. Slifkin, A. M. Weiss and A. Gedanken, Chem. Mater., 2001, 13, 2195–2200 CrossRef.
- K. Xue, D. Chen and X. Jiao, Inorg. Chem., 2010, 49, 1191–1197 CrossRef PubMed.
- L. Y. Chen, Z. D. Zhang and W. Z. Wang, J. Phys. Chem. C, 2008, 112, 4117–4123 CrossRef.
- Y. Xiong, Y. Xie, G. Du and X. Tian, J. Mater. Chem., 2002, 12, 98–102 RSC.
- M. Afzaal, M. A. Malik and P. O'Brien, Chem. Commun., 2004, 334–335 RSC.
- J. Tabernor, P. Christian and P. O'Brien, J. Mater. Chem., 2006, 16, 2082–2087 RSC.
- B. G. Kumar and K. Muralidharan, J. Mater. Chem., 2011, 21, 11271–11275 RSC.
- G. Liu, X. Jiao, Z. Qin and D. Chen, CrystEngComm, 2011, 13, 182–187 RSC.
- A. K. Nayak, S. Lee, Y. Sohn and D. Pradhan, CrystEngComm, 2014, 16, 8064–8072 RSC.
- X. Ren, H. Fan, J. Ma, C. Wang, M. Zhang and N. Zhao, Appl. Surf. Sci., 2018, 441, 194–203 CrossRef.
- M. Zhang, H. Fan, N. Zhao, H. Peng, X. Ren, W. Wang, H. Li, G. Chen, Y. Zhu, X. Jiang and P. Wu, Chem. Eng. J., 2018, 347, 291–300 CrossRef.
- J. Ma, H. Fan, H. Tian, X. Ren, C. Wang, S. Gao and W. Wang, Sens. Actuators, B, 2018, 262, 17–25 CrossRef.
- P. Li, H. Fan, Y. Cai, M. Xu, C. Long, M. Li, S. Lei and X. Zou, RSC Adv., 2014, 4, 15161–15170 RSC.
- B. Arul Prakasam, M. Lahtinen, M. Muruganandham and M. Sillanpää, Mater. Lett., 2015, 158, 370–372 CrossRef.
- W. Shi, S. Song and H. Zhang, Chem. Soc. Rev., 2013, 42, 5714–5743 RSC.
- N. R. Armstrong, A. W. C. Lin, M. Fujihira and T. Kuwana, Anal. Chem., 1976, 48, 741–750 CrossRef.
- R. Kumar, A. Agrawal, T. Bhuvana and A. Sharma, Electrochim. Acta, 2018, 270, 87–95 CrossRef.
- B. P. Bastakoti, H. Oveisi, C. Hu, C. Kevin, W. Wu, N. Suzuki, K. Takai, Y. Kamachi, M. Imura and Y. Yamauchi, Eur. J. Inorg. Chem., 2013, 1109–1112 CrossRef.
- J. Chang, W. Lee, S. Rajaram, S. Mane, B. Won Cho and S.-H. Han, Electrochem. Solid-State Lett., 2008, 11(1), A9–A11 CrossRef.
- K. R. Prasad, K. Koga and N. Miura, Chem. Mater., 2004, 16, 1845–1847 CrossRef.
- F. N. Tuzluca, Y. O. Yesilbag and M. Ertugrul, Appl. Surf. Sci., 2018, 427, 956–964 CrossRef.
Footnote |
| † Electronic supplementary information (ESI) available. See DOI: 10.1039/c8ra03573c |
|
| This journal is © The Royal Society of Chemistry 2018 |
Click here to see how this site uses Cookies. View our privacy policy here.  Open Access Article
 *ab,
Manu Lahtinen
 c,
Anssi Peuronen
 c,
Govindhasamy Manikandanb,
Manickavachagam Muruganandhama and
Mika Sillanpääad

![[thin space (1/6-em)]](https://www.rsc.org/images/entities/char_2009.gif) :
:![[thin space (1/6-em)]](https://www.rsc.org/images/entities/char_2009.gif) 3 indicating the formation of In2O3. This was further confirmed by PXRD analysis.
3 indicating the formation of In2O3. This was further confirmed by PXRD analysis.


