 Open Access Article
A highly selective TPE-based AIE fluorescent probe is developed for the detection of Ag+ †
Zhixiang Lu,
Yunming Liu,
Shuhan Lu,
Yuan Li,
Xiaolan Liu,
Yu Qin and
Liyan Zheng *
*
Key Laboratory of Medicinal Chemistry for Natural Resource, Ministry of Education, Functional Molecules Analysis and Biotransformation Key Laboratory of Universities in Yunnan Province, School of Chemical Science and Technology, Yunnan University, Kunming, Yunnan 650091, China. E-mail: zhengliyan@ynu.edu.cn
First published on 30th May 2018
Abstract
The detection of Ag+ in the environment is very important to determine the level of pollution from silver complexes, which have caused various human health problems. Herein, an aggregation-induced emission (AIE) chromophore (tetraphenylethane, TPE) attached to a benzimidazole group (tetra-benzimidazole, TBI–TPE) is synthesized and utilized to detect Ag+ in the environment. The strong chelating effect between the benzimidazole group and Ag+ leads to the formation of aggregates, and strong yellow fluorescence signals were observed after adding Ag+ into a TBI–TPE solution. The stoichiometry of the complex of TBI–TPE and Ag+ was established to be 1![[thin space (1/6-em)]](https://www.rsc.org/images/entities/char_2009.gif) :
:![[thin space (1/6-em)]](https://www.rsc.org/images/entities/char_2009.gif) 2 using photochemical and mass spectra measurements. The detection limit of the Ag+ assay is 90 nM with a linear range from 100 nM to 6 μM. This study provides a facile method to determine Ag+ in real environmental samples with satisfactory results.
2 using photochemical and mass spectra measurements. The detection limit of the Ag+ assay is 90 nM with a linear range from 100 nM to 6 μM. This study provides a facile method to determine Ag+ in real environmental samples with satisfactory results.
1. Introduction
Silver is an important basic metal and has many applications, including pharmaceuticals, the chemical industry, accessories, electronics, photography and so on.1–4 Metal pollution resulting from industrial processes including leather tanning, cement production, and metal plating is a serious environmental problem.5–8 In the pharmaceutical industry low concentrations of silver complexes are used for their strong antibacterial effect. However, at high concentrations silver is harmful to human health and can cause brain damage, skin oxidation and have negative impacts on the immune system.9–13 So it is imperative to establish a highly selective and sensitive method for detecting Ag+ in the environment.Conventional methods for the detection of Ag+ include atomic absorption spectrometry, atomic emission spectrometry, potentiometric titration, inductively coupled plasma-mass spectrometry (ICP-MS), electrochemistry, molecular imprinting biosensors and colorimetry etc.14–20 Although these methods can be used to detect lower concentrations of Ag+, they require complex instrumentation, tedious operations and time-consuming sample pretreatment. Compared to these methods, fluorescence spectroscopy has many advantages, such as low cost, high sensitivity, easy operation and simple sample preparation.20–24 Nevertheless, it is well known that Ag+ is commonly used as a fluorescent quencher, and most reports on Ag+ detection are based on quenching effects due to a charge transfer process between Ag+ and a probe. Fluorescent probes for Ag+ with “turn on” type signals are rarely reported.25–30
The emergence of aggregation-induced emission (AIE) fluorophores have provided many chances to build “signal on” probes, where fluorescence is weak when dissolved, but becomes significantly more emissive in the aggregate state. Restriction of intramolecular rotation is the main AIE mechanism, in which the intramolecular rotations are greatly hampered due to limited space when aggregated. The non-radiation decay channels are inhibited, and the excited states can only go back to the ground state by radiation decay, thus enhancing the fluorescence significantly.31–36 In recent years, fluorescent materials with AIE properties have drawn extensive attention because they have a wide range of applications in many fields, including fluorescent cell imaging, organic light-emitting diodes, sensor materials, protein conformation studies, chiral recognition and so on.37–46 Among these AIE molecules, TPE is one of the most widely studied and used materials owing to its excellent optical properties, high quantum yield and photostability.47–51
It has been reported that Ag(I) possesses high affinity for benzimidazole leading to stable coordination complexes.51–57 With these considerations in mind, we designed and synthesized a novel fluorophore containing TPE and a benzimidazole group for the first time. The TBI–TPE is rich in N atoms, which offers good coupling ability with Ag+. Based on the strong coordination, Ag+ and TBI–TPE formed an AIE aggregate inducing significant fluorescence enhancement, hence a new fluorescence “turn on” sensor for the detection of Ag+ is developed. This AIE probe exhibits high chemical selectivity and a fast response time and has been successfully utilized in the determination of Ag+ in real environmental samples.
2. Experimental section
2.1 Materials
4,4′-Dimethylbenzophenone, titanium tetrachloride (TiCl4), pyridine, N-bromobutanimide (NBS), dibenzoyl peroxide (BPO), and 1,2-diaminobenzene were purchased from Aladdin. Anhydrous tetrahydrofuran, silver nitrate, sodium acetate trihydrate, and chloroform-d, 99.8 atom% D were purchased from Energy Chemical. Dimethyl sulfoxide-d6 was purchased from Sigma-Aldrich. All other reagents were of analytical grade and used as received. Ultrapure water was prepared using a Milli-Q water purification system.2.2 Apparatus
Fluorescence spectra were recorded on a Hitachi High-Technologies Corporation Tokyo Japan 5J2-0004 model F-7000 FL spectrofluorometer. UV-vis absorption was characterized by a UV-vis/NIR spectrophotometer (Shimadzu, Japan). The NMR spectra were recorded with a AVANCEDRX400 NMR spectrometer (Bruker, Germany) operated at 400/600 MHz. Electrospray ionization mass spectra were obtained with a High Performance 1100 Liquid Chromatography-Mass Spectrometer (Agilent Technologies, USA). The morphology and size of aggregates were characterized with Scanning Electron Microscopy (SEM) (Quanta, FEI) and a JEM 2100 high resolution transmission electron microscope (HRTEM, JEOL, Japan).2.3 Synthesis
The synthetic strategies adopted are outlined in Scheme 1.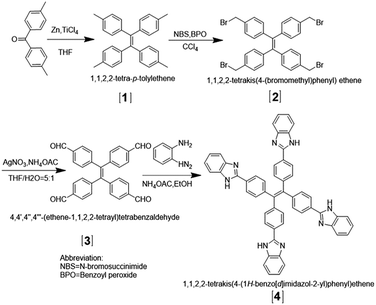 | ||
| Scheme 1 Synthetic route to new 1,1,2,2-tetrakis(4-(1H-benzo[d]imidazole-2-yl)phenyl)ethene molecules, TBI–TPE. | ||
![[thin space (1/6-em)]](https://www.rsc.org/images/entities/char_2009.gif) :
:![[thin space (1/6-em)]](https://www.rsc.org/images/entities/char_2009.gif) 1) to result in a yellow-green product 3 (yield: 25%).59–61 1H NMR and 13C NMR spectra of product 3 (400 MHz, CDCl3, 25 °C), δ (TMS, ppm) are shown in Fig. S4 and S5,† respectively. As shown in Fig. S6,† high resolution MS (m/z) of product 3: calculated for C30H20O4 [M + H]+ 445.1434, found 445.1433, [M + Na]+ 467.1253, found 467.1259 (high resolution).
1) to result in a yellow-green product 3 (yield: 25%).59–61 1H NMR and 13C NMR spectra of product 3 (400 MHz, CDCl3, 25 °C), δ (TMS, ppm) are shown in Fig. S4 and S5,† respectively. As shown in Fig. S6,† high resolution MS (m/z) of product 3: calculated for C30H20O4 [M + H]+ 445.1434, found 445.1433, [M + Na]+ 467.1253, found 467.1259 (high resolution).2.4 Analysis of real sample
A waste liquor sample was taken from a factory in Kunming city. The sample was filtered through a 0.22 μm membrane (Millipore) prior to detection. One hundred microliters of the above waste sample was added to 900 μL of methyl alcohol solution containing TBI–TPE (2 μM) and then analyzed using the developed detection method.3. Results and discussion
3.1 Design and synthesis of (1,1,2,2-tetrakis(4-(1H-benzo[d]imidazol-2-yl)phenyl)ethene) TBI–TPE
The four-step synthesis adopted for preparing TBI–TPE is shown in Scheme 1. Compound 1 (1,1,2,2-tetra-p-tolylethene) was prepared from 4,4′-dimethylbenzophenone by McMurry coupling. Compound 2 was obtained by NBS under the induction of a free radical initiator (BPO) in CCl4 at 80 °C. Compound 2 is oxidized to compound 3 using silver as the catalyst. TBI–TPE is produced by refluxing 3 at 75 °C.To verify the results of our synthesis, these compounds were checked by NMR and MS (Fig. S1–S9†).
3.2 AIE properties
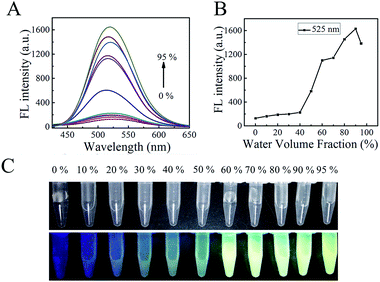
After structure confirmation, the AIE properties of TBI–TPE were investigated. To further illustrate the AIE feature, the study of the emission characteristics of TBI–TPE in mixtures of CH3OH and water with different water fractions was conducted. As shown in Fig. 1 and S10,† the fluorescence of TBI–TPE is a yellowish green emission at 525 nm and is strongest at fw = 90%, which is 13 times stronger than the one at fw = 0%. The compound is almost non-emissive when it is dissolved in pure organic solution (fw = 0%) and it gradually becomes emissive as water is added, proving its prominent AIE activity. The increase in fluorescence intensity indicated TBI–TPE tended to aggregate when the fw value increased. Upon aggregation, the free intramolecular rotations of the excited molecules are restricted. This blocks the non-radiative relaxation pathway and favors the radiative decay.3.3 Silver ion sensing studies
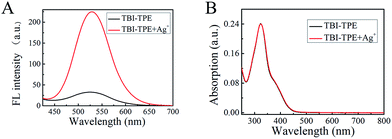 | ||
| Fig. 2 (A) Fluorescence spectra. (B) UV absorption spectra of TBI–TPE (4 μM) in CH3OH in the presence of Ag+ (4 μM), Ex = 370 nm. | ||
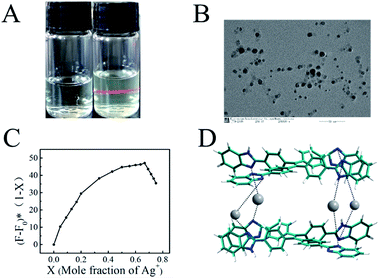
In Fig. 3A the Tyndall effect can be observed in a Ag–TBI–TPE solution by laser irradiation, indicating the formation of aggregates. The formation of Ag–TBI–TPE aggregates was further confirmed by HRTEM and SEM measurements (Fig. 3B, S12†). Nanoparticles with diameter of 20 nm were observed in these images. The above results reveal that aggregates of Ag–TBI–TPE were formed in CH3OH solution, resulting in enhanced fluorescence, which is similar to the AIE mechanism of assay.
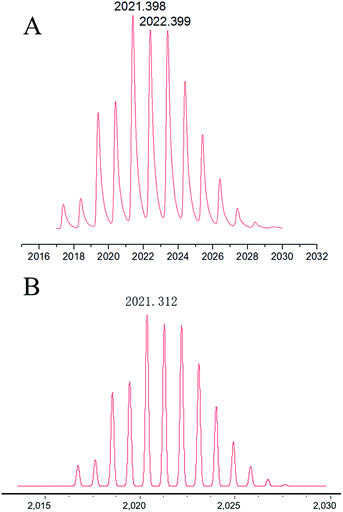
Next, we studied the stoichiometric coordination of TBI–TPE with Ag+. As shown in Fig. 3C, Job’s plot established that the stoichiometry ratio of the TBI–TPE and Ag+ strongly fluorescent complex is 1![[thin space (1/6-em)]](https://www.rsc.org/images/entities/char_2009.gif) :
:![[thin space (1/6-em)]](https://www.rsc.org/images/entities/char_2009.gif) 2. Furthermore, the mass of Ag–TBI–TPE complex was determined using MALDI-TOF MS. A peak at 2021.398 was obtained (Fig. 4A), suggesting the Ag–TBI–TPE complex formed is (TBI–TPE)2Ag4, which corresponds to the theoretical calculation (2021.312, Fig. 4B). These results are consistent with the Job’s plot. According to these results, we speculate that the N atoms of imidazole are good electron donors, which display good ability to coordinate positive Ag+, forming a stable and strong fluorescent complex. The schematic diagram of this phenomenon is shown in Fig. 3D.
2. Furthermore, the mass of Ag–TBI–TPE complex was determined using MALDI-TOF MS. A peak at 2021.398 was obtained (Fig. 4A), suggesting the Ag–TBI–TPE complex formed is (TBI–TPE)2Ag4, which corresponds to the theoretical calculation (2021.312, Fig. 4B). These results are consistent with the Job’s plot. According to these results, we speculate that the N atoms of imidazole are good electron donors, which display good ability to coordinate positive Ag+, forming a stable and strong fluorescent complex. The schematic diagram of this phenomenon is shown in Fig. 3D.
Furthermore, it is well known that pH changes according to the concentration of Ag+, which will greatly effect the interaction between Ag+ and the probe. The effect of pH on the interaction between Ag+ and the probe were investigated by fluorescence measurement. As shown in Fig. S13,† the fluorescence intensity at 525 nm increased with increasing pH from 4.0 to 7.0, and the fluorescence signal decreased with increasing pH value. This tendency revealed that the interaction between the probe and Ag+ would be effected by the deprotonation process. The best fluorescent performance of Ag–TBI–TPE at neutral pH is beneficial for the detection of Ag+ in environmental samples.
![[thin space (1/6-em)]](https://www.rsc.org/images/entities/char_2009.gif) :
:![[thin space (1/6-em)]](https://www.rsc.org/images/entities/char_2009.gif) 1.
1.3.4 Sample application
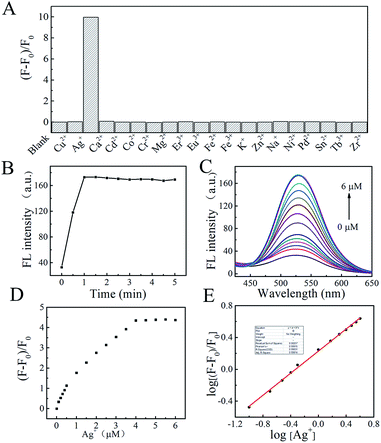
The practicability of TBI–TPE fluorescent probe was assessed by applying it to the analysis of Ag+ in waste liquor samples, provided by a factory in Kunming city. An average value of 0.112 ± 0.003 μM Ag+ was found for n = 3 determinations using our developed approach with good recovery (99 ± 2%), after subtraction of the intercept from the standard calibration curve (Fig. 5E), which is consistent with the ICP-MS measurement, 0.113 ± 0.008 μM. These results suggest that our fluorescence probe can be used for Ag+ determination in environmental samples.4. Conclusions
In conclusion, we have designed and synthesized an AIE fluorescence probe containing benzimidazole group, which exhibited highly sensitive and selective “turn-on” fluorescence for the determination of Ag+ with a detection limit of 0.090 μM. The stoichiometry of TBI–TPE and Ag+ in the complex was established to be 1![[thin space (1/6-em)]](https://www.rsc.org/images/entities/char_2009.gif) :
:![[thin space (1/6-em)]](https://www.rsc.org/images/entities/char_2009.gif) 2 using Job’s plot and MS studies. Thanks to the unique AIE property of TPE, a facile strategy for the construction of high performance “signal on” fluorescent probes has been presented and could be developed for other potential applications.
2 using Job’s plot and MS studies. Thanks to the unique AIE property of TPE, a facile strategy for the construction of high performance “signal on” fluorescent probes has been presented and could be developed for other potential applications.
Conflicts of interest
There are no conflicts to declare.Acknowledgements
This work was financially supported by the National Natural Science Foundation of China (NSFC, 21765024).Notes and references
- T. W. Purcell and J. J. Peters, Environ. Toxicol. Chem., 1998, 17(4), 539–546 CrossRef.
- M. Alvarez-Corral, M. Munoz-Dorado and I. Rodriguez-Garcia, Chem. Rev., 2008, 108(8), 3174–3198 CrossRef PubMed.
- J. L. Barriada, A. D. Tappin, E. H. Evans and E. P. Achterberg, TrAC, Trends Anal. Chem., 2007, 26(8), 809–817 CrossRef.
- P. L. Drake and K. J. Hazelwood, Ann. Occup. Hyg., 2005, 49(7), 575–585 Search PubMed.
- X. B. Zhang, Z. X. Han, Z. H. Fang, G. L. Shen and R. Q. Yu, Anal. Chim. Acta, 2006, 562(2), 210–215 CrossRef.
- H. H. Harris, I. J. Pickering and G. N. George, Science, 2003, 301(5637), 1203 CrossRef PubMed.
- D. Maity and T. Govindaraju, Chem. Commun., 2012, 48(7), 1039–1041 RSC.
- S. Goswami, A. K. Das and S. Maity, Dalton Trans., 2013, 42(46), 16259–16263 RSC.
- S. Pal, Y. K. Tak and J. M. Song, Appl. Environ. Microbiol., 2007, 73(6), 1712–1720 CrossRef PubMed.
- C. Marambio-Jones and E. M. V. Hoek, J. Nanopart. Res., 2010, 12(5), 1531–1551 CrossRef.
- P. C. Lee and D. Meisel, J. Phys. Chem., 1982, 86, 3391–3395 CrossRef.
- I. Sondi and B. Salopek-Sondi, J. Colloid Interface Sci., 2004, 275(1), 177–182 CrossRef PubMed.
- H. Blum, H. Beier and H. J. Gross, Electrophoresis, 1987, 8(2), 93–99 CrossRef.
- S. C. K. Shum, H. M. Pang and R. S. Houk, Anal. Chem., 1992, 64(20), 2444–2450 CrossRef PubMed.
- L. G. Martin, L. T. Jongwana and A. M. Crouch, Electrochim. Acta, 2010, 55(14), 4303–4308 CrossRef.
- C. P. Hanna, J. F. Tyson and S. McIntosh, Anal. Chem., 1993, 65(5), 653–656 CrossRef PubMed.
- Y. Yu, Q. Zhang, C. C. Chang, Y. Liu, Z. Yang, Y. Guo and M. Rafailovich, Analyst, 2016, 141(19), 5607–5617 RSC.
- Y. Yu, Q. Zhang, J. Buscaglia, C. C. Chang, Y. Liu, Z. Yang and M. Rafailovich, Analyst, 2016, 141(14), 4424–4431 RSC.
- Y. Chang, Z. Zhang, J. Hao, W. Yang and J. Tang, Sens. Actuators, B, 2016, 232, 692–697 CrossRef.
- Z. Yan, Q. Zhao, M. Wen, L. Hu, X. Zhang and J. You, Spectrochim. Acta, Part A, 2017, 186, 17–22 CrossRef PubMed.
- W. Shi, Y. Chen, X. Chen, Z. Xie and Y. Hui, J. Lumin., 2016, 174, 56–62 CrossRef.
- W. Shen, L. Wang and M. Wu, et al., Inorg. Chem. Commun., 2016, 70, 107–110 CrossRef.
- S. Y. Lee, K. H. Bok and C. Kim, RSC Adv., 2017, 7(1), 290–299 RSC.
- L. Tang and M. Cai, Sens. Actuators, B, 2012, 173, 862–867 CrossRef.
- R. C. Duckworth, J. M. Pfotenhauer and J. W. Lue, et al., AIP Conf. Proc., 2002, 613(1), 449–456 CrossRef.
- J. R. Lakowicz, J. Malicka, S. D’Auria and I. Gryczynski, Anal. Biochem., 2003, 320(1), 13–20 CrossRef PubMed.
- Z. Xu, S. J. Han, C. Lee, J. Yoon and D. R. Spring, Chem. Commun., 2010, 46(10), 1679–1681 RSC.
- H. C. Hung, C. W. Cheng and Y. Y. Wang, et al., Eur. J. Org. Chem., 2009, 2009(36), 6360–6366 CrossRef.
- L. Prodi, F. Bolletta and M. Montalti, et al., Coord. Chem. Rev., 2000, 205(1), 59–83 CrossRef.
- J. Fan, C. Chen and Q. Lin, et al., Sens. Actuators, B, 2012, 173, 874–881 CrossRef.
- Y. Hong, J. W. Y. Lam and B. Z. Tang, Chem. Soc. Rev., 2011, 40(11), 5361–5388 RSC.
- Y. Hong, J. W. Y. Lam and B. Z. Tang, Chem. Commun., 2009, 29, 4332–4353 RSC.
- J. Luo, Z. Xie and J. W. Y. Lam, et al., Chem. Commun., 2001, 18, 1740–1741 RSC.
- M. Wang, G. Zhang and D. Zhang, et al., J. Mater. Chem., 2010, 20(10), 1858–1867 RSC.
- Y. Hong, M. Häußler and J. W. Y. Lam, et al., Chem.–Eur. J., 2008, 14(21), 6428–6437 CrossRef PubMed.
- H. Shi, R. T. K. Kwok and J. Liu, et al., J. Am. Chem. Soc., 2012, 134(43), 17972–17981 CrossRef PubMed.
- Y. Liu, Y. Tang and N. N. Barashkov, et al., J. Am. Chem. Soc., 2010, 132(40), 13951–13953 CrossRef PubMed.
- Y. Liu, C. Deng, L. Tang, A. Qin, R. Hu, J. Z. Sun and B. Z. Tang, J. Am. Chem. Soc., 2011, 133(4), 660–663 CrossRef PubMed.
- H. Shi, J. Liu and J. Geng, et al., J. Am. Chem. Soc., 2012, 134(23), 9569–9572 CrossRef PubMed.
- K. Hatano, H. Saeki and H. Yokota, et al., Tetrahedron Lett., 2009, 50(42), 5816–5819 CrossRef.
- W. Qin, D. Ding and J. Liu, et al., Adv. Funct. Mater., 2012, 22(4), 771–779 CrossRef.
- Q. Zhao, K. Li and S. Chen, et al., J. Mater. Chem., 2012, 22(30), 15128–15135 RSC.
- Y. Liu, S. Chen and J. W. Y. Lam, et al., Chem. Mater., 2011, 23(10), 2536–2544 CrossRef.
- J. P. Xu, Y. Fang and Z. G. Song, et al., Analyst, 2011, 136(11), 2315–2321 RSC.
- M. Zhao, M. Wang and H. Liu, et al., Langmuir, 2008, 25(2), 676–678 CrossRef PubMed.
- M. Wang, X. Gu and G. Zhang, et al., Anal. Chem., 2009, 81(11), 4444–4449 CrossRef PubMed.
- R. Misra, T. Jadhav and B. Dhokale, et al., Chem. Commun., 2014, 50(65), 9076–9078 RSC.
- Z. Zhao, S. Chen and X. Shen, et al., Chem. Commun., 2010, 46(5), 686–688 RSC.
- Z. Zhao, P. Lu and J. W. Y. Lam, et al., Chem. Sci., 2011, 2(4), 672–675 RSC.
- Y. Dong, J. W. Y. Lam and A. Qin, et al., Appl. Phys. Lett., 2007, 91(1), 011111 CrossRef.
- H. Lu, Y. Zheng and X. Zhao, et al., Angew. Chem., Int. Ed., 2016, 55(1), 155–159 CrossRef PubMed.
- U. Kalinowska-Lis, A. Felczak and L. Chęcińska, et al., J. Organomet. Chem., 2014, 749, 394–399 CrossRef.
- J. C. Geng, L. Qin and X. Du, et al., Z. Anorg. Allg. Chem., 2012, 638(7–8), 1233–1238 CrossRef.
- J. H. M. Hill, J. Organomet. Chem., 1963, 28(7), 1931–1932 Search PubMed.
- C. K. Xia, C. Z. Lu and Q. Z. Zhang, et al., Cryst. Growth Des., 2005, 5(4), 1569–1574 Search PubMed.
- H. Wu, J. Yuan and Y. Bai, et al., Dalton Trans., 2012, 41(29), 8829–8838 RSC.
- M. Liu, A. Kira and H. Nakahara, Langmuir, 1997, 13(18), 4807–4809 CrossRef.
- J. Dessingou, A. Mitra and K. Tabbasum, et al., J. Org. Chem., 2011, 77(1), 371–378 CrossRef PubMed.
- T. S. Navale, K. Thakur and R. Rathore, Org. Lett., 2011, 13(7), 1634–1637 CrossRef PubMed.
- O. Dann, G. Bergen and E. Demant, et al., Eur. J. Inorg. Chem., 1971, 749(1), 68–89 Search PubMed.
- G. J. Liu, Z. Long, H. J. Lv, C. Y. Li and G. W. Xing, Chem. Commun., 2016, 52(67), 10233–10236 RSC.
- Y. X. Zhu, Z. W. Wei, M. Pan, H. P. Wang, J. Y. Zhang and C. Y. Su, Dalton Trans., 2016, 45(3), 943–950 RSC.
- Y. R. Girish, K. S. Sharath Kumar, K. N. Thimmaiah, K. S. Rangappa and S. Shashikanth, RSC Adv., 2015, 5(92), 75533–75546 RSC.
- H. Sharghi, O. Asemani and R. Khalifeh, Synth. Commun., 2008, 38(7), 1128–1136 CrossRef.
Footnote |
| † Electronic supplementary information (ESI) available. See DOI: 10.1039/c8ra03591a |
| This journal is © The Royal Society of Chemistry 2018 |

