DOI:
10.1039/C8RA03719A
(Paper)
RSC Adv., 2018,
8, 20190-20201
Defining Pt-compressed CO2 synergy for selectivity control of furfural hydrogenation†
Received
1st May 2018
, Accepted 24th May 2018
First published on 4th June 2018
Abstract
The development of a sustainable methodology for catalytic transformation of biomass-derived compounds to value-added chemicals is highly challenging. Most of the transitions are dominated by the use of additives, complicated reaction steps and large volumes of organic solvents. Compared to traditional organic solvents, alternative reaction media, which could be an ideal candidate for a viable extension of biomass-related reactions are rarely explored. Here, we elucidate a selective and efficient transformation of a biomass-derived aldehyde (furfural) to the corresponding alcohol, promoted in compressed CO2 using a Pt/Al2O3 catalyst. Furfural contains a furan ring with C![[double bond, length as m-dash]](https://www.rsc.org/images/entities/char_e001.gif) C and an aldehyde group, and is extremely reactive in a hydrogen atmosphere, resulting in several by-products and a threat to alcohol selectivity as well as catalyst life. The process described has a very high reaction rate (6000 h−1) with an excellent selectivity/yield (99%) of alcohol, without any organic solvents or metal additives. This strategy has several key features over existing methodologies, such as reduced waste, and facile product separation and purification (reduced energy consumption). Combining the throughput of experimental observation and molecular dynamics simulation, indeed the high diffusivity of compressed CO2 controls the mobility of the compound, and eventually maintains the activity of the catalyst. Results are also compared for different solvents and solvent-less conditions. In particular, combination of an effective Pt catalyst with compressed CO2 provides an encouraging alternative solution for upgradation of biomass related platform molecules.
C and an aldehyde group, and is extremely reactive in a hydrogen atmosphere, resulting in several by-products and a threat to alcohol selectivity as well as catalyst life. The process described has a very high reaction rate (6000 h−1) with an excellent selectivity/yield (99%) of alcohol, without any organic solvents or metal additives. This strategy has several key features over existing methodologies, such as reduced waste, and facile product separation and purification (reduced energy consumption). Combining the throughput of experimental observation and molecular dynamics simulation, indeed the high diffusivity of compressed CO2 controls the mobility of the compound, and eventually maintains the activity of the catalyst. Results are also compared for different solvents and solvent-less conditions. In particular, combination of an effective Pt catalyst with compressed CO2 provides an encouraging alternative solution for upgradation of biomass related platform molecules.
Introduction
In recent years, the development of sustainable technologies for the transformation of biomass into useful and industrially relevant products has received considerable attention.1 Among the different biomass-derived “platform molecules”, furfural is a versatile compound that can be upgraded to bio-fuel and non-fuel related compounds via a variety of reaction pathways.2 The selective hydrogenation of the aldehyde group of furfural results in furfuryl alcohol, which is considered as one of the promising compounds with a broad range of applications including the production of resin used in the manufacturing of polyurethane foams, fragrances, solvents and plasticizers, and as a building block in the synthesis of ranitidine and vitamin C (non-fuel), as well as biofuel additives such as levulinic acid and γ-valerolactone.3,4 In the presence of hydrogen, furfural can undergo different types of reaction, which includes hydrogenation, hydrogenolysis, decarbonylation, ring opening etc. Thus, careful selection of the catalyst and control of the reaction conditions are necessary to achieve the highest catalytic performance in the hydrogenation of aldehyde group after blocking the other transformation paths.
Although, the gas phase synthesis of furfuryl alcohol via hydrogenation of furfural provides excellent catalytic performance, it involves harsh reaction conditions, higher energy consumption, deactivation of the catalyst and the generation of large amount of by-products.5,6 To circumvent these drawbacks, the reaction was investigated in the liquid phase using noble and non-noble metal catalysts.7,8 Reduced Cu-chromite catalyst modified with alkaline earth metal oxide shows comparable activity with the gas phase reaction (furfuryl alcohol yield = 98%), but involves high temperature and hydrogen pressure of 200 °C and 3 MPa, respectively. An additional disadvantage is the disposal problem of the Cr-based spent catalyst because of its toxicity, which causes environmental concern.9 Although, there have been a number of improvements with non-noble metal catalysts, appropriate catalysts are limited, and even usable catalysts still require additives or comparatively high temperature and hydrogen pressure to improve the selectivity.10–14 Thus, current focus is on noble metals, which has the ability to adsorb hydrogen, because from the surface chemistry viewpoint, surface coverage of furfural as well as co-adsorption of hydrogen is critical to control the reaction selectivity.15 Supported Pt catalysts gained considerable attention for furfural hydrogenation and investigated under different reaction conditions to achieve maximum selectivity of furfuryl alcohol.16–21 In this context, majority of the developed protocols are based on the diluted solution (0.02 wt% to 12 wt%) of the reactant in a large volume of organic solvents, which leads to impure final product, requires high energy for the separation and purification steps, also generates large amount of wastes. Similar to organic solvents, the reaction in aqueous medium, also focused on the diluted solution; 35 ml of water was used to hydrogenate 0.35 g of furfural.17 On the other hand, in a recent report, 2 wt% furfural solution was tested on Pt/heteroatom doped carbon catalyst to achieve high selectivity.18 Even if aqueous phase reactions are considered, which avoids potentially toxic and difficult to treat organic liquid waste, faces the problem of product separation, recovery and waste water treatment processes. Other options are electro-catalytic hydrogenation using different metals as electrode or electro-catalytic membrane.22 Thus, to overcome the solvent related shortcomings, the reaction was investigated without any solvents using non-noble metal catalysts. Despite the successful formation of furfuryl alcohol, there are several factors troubled the catalytic activity such as deactivation, hence, require tedious work for catalyst regeneration and the necessity of severe reaction conditions (high hydrogen pressure = 11.8 MPa and temperature = 160 °C).23,24
Compressed CO2 is considered as an environmentally benign alternative reaction medium with many advantages including health safety (non-toxic, non-flammable) and process benefits connected to the rare occurrence of by-products owing to side reactions, the absence of solvent residue and facile product separation (cost-effective; related to the separation and purification steps). It can alleviate several problems associated with the traditional organic solvents (mass-transfer limitations due to the high miscibility of reactant gases H2, O2 etc. and high diffusivity), thus, leading to faster reaction rates and excellent product selectivity. Furthermore, reaction yield and selectivity can be enhanced easily by tuning of the pressure and temperature,25 however, application of compressed CO2 is extremely rare in the upgradation of biomass-derived compounds.26
In this work, we present Pt-compressed CO2 as an extremely efficient combination for the selective hydrogenation of the aldehyde group of furfural with maximum selectivity without any diluent or severe reaction conditions. Comparing the results with different solvents (polar and non-polar) and solvent-less conditions we proposed a potential route to improve the catalyst life in compressed CO2, validated through the experimental analysis and the molecular dynamics simulation.
Results and discussion
Scheme 1 represents the possible reaction path of furfural hydrogenation under the present reaction conditions. Furfural can be hydrogenated to furfuryl alcohol followed by the further hydrogenation to tetrahydrofurfuryl alcohol (THFA), which again converted to diol (1,2-pentanediol and 1,5-pentanediol) through the ring opening reaction. Alternatively, polymerization of furfuryl alcohol results in the formation of 2-furfurylfuran depending on the reaction conditions applied.
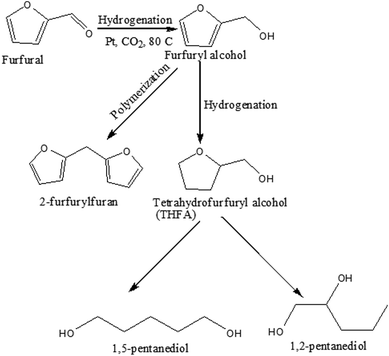 |
| | Scheme 1 Possible reaction pathway of furfural transformation in compressed CO2. | |
Catalyst screening
A series of Pt catalysts (∼5 wt% of metal) supported on activated carbon (C), graphene oxide (GO), alumina (Al2O3) and mesoporous MCM-41 were evaluated (Table 1). Under the same reaction conditions, the conversion of furfural varies from 13% to ∼99% depending on support materials; moderate activities of 52.5% and 67.4% were observed on Pt/C and Pt/GO, respectively (Table 1; Entry 1 and 2). On the other hand, Pt/Al2O3 exhibited an excellent performance with ∼99% conversion (Table 1; Entry 3). Only 13.0% of furfural was converted on MCM-41 (Si) (Table 1; Entry 4), however, substitution of Si with Al and Ti significantly improved the activity (Table 1; Entry 5 and 6) to 45.6% and 59.0%, respectively. For a better comparison, the reaction rate in terms of turnover frequency (TOF) was calculated on the basis of ∼10% conversion (Table 1). Among the Pt catalysts studied, very high TOF (6000 h−1) confirmed Pt/Al2O3 as a most active catalyst under the present reaction conditions. Compared to GO (TOF = 1136 h−1), slightly improved activity was observed on C (TOF = 1229 h−1), whereas, the substitution of Si by Al and Ti in MCM-41, significantly changed the TOF: Ti/MCM-41 (2339 h−1) > Al/MCM-41 (1463 h−1) > MCM-41 (235 h−1), which might be attributed to the generation of active sites enhanced the catalytic activity.27,28
Table 1 Screening of Pt catalyst for furfural hydrogenation in compressed CO2
| Entry |
Catalyst |
Conv. (%) |
TOFa (h−1) |
Selectivity (%) |
| Furfuryl alcohol |
THFA |
Other |
| Reaction conditions: catalyst : substrate=1 : 40; temperature = 80 °C; time = 4 h; PH2 = 1 MPa; PCO2 = 8 MPa. In each case metal content ~5 wt%; Turnover frequency (TOF) calculated at ~10 % conversion = number of moles reacted/moles of metal x time; PH2= 0.5 MPa; reaction time= 1h Temp. = 35 °C; PCO2= 6.4 MPa; Temp. = 100 °C; PCO2= 8.7 MPa; PH2= 0.12 MPa, substrate= 0.05 g; PH2= 2.5 MPa, substrate= 1.0 g. |
| 1 |
Pt/C |
52.5 |
1229 |
95.3 |
4.3 |
0.4 |
| 2 |
Pt/GO |
67.4 |
1136 |
90.2 |
8.2 |
0.6 |
| 3 |
Pt/Al2O3 |
98.8 |
6000 |
98.6 |
1.4 |
— |
| 4 |
Pt/MCM-41 |
13.0 |
235 |
89.0 |
— |
11.0 |
| 5 |
Pt/Al-MCM-41 |
45.6 |
1463 |
100.0 |
— |
— |
| 6 |
Pt/Ti-MCM-41 |
59.0 |
2339 |
100 |
— |
— |
| 7 |
Pd/Al2O3 |
88.0 |
6400 |
64.0 |
21.6 |
14.4 |
| b8 |
Pd/Al2O3 |
40.0 |
— |
81.6 |
18.4 |
— |
| 9 |
Rh/Al2O3 |
12.0 |
95 |
97.9 |
2.1 |
— |
| 10 |
Ru/Al2O3 |
24.4 |
293 |
96.4 |
— |
3.6 |
| c11 |
Pt/Al2O3 |
65.7 |
|
99.2 |
0.8 |
— |
| d12 |
Pt/Al2O3 |
99.3 |
|
91.7 |
3.9 |
4.4 |
| e13 |
Pt/Al2O3 |
95.8 |
|
97.6 |
2.4 |
— |
| f14 |
Pt/Al2O3 |
98.2 |
|
90.8 |
2.0 |
7.2 |
Interestingly, in the applied conditions, all the Pt catalysts selectively produced furfuryl alcohol as a major product with the excellent selectivity of 90% to >99% (Table 1; Entry 1 to 6) independent of the support. For instance, in the C series, 90–95% furfuryl alcohol was formed (Table 1; Entry 1 and 2). On the other hand, Pt/Al2O3 ensures ∼99% selectivity (Table 1; Entry 3). Despite the low conversion, Pt/Al-MCM-41 and Pt/Ti-MCM-41 generates furfuryl alcohol with quantitative selectivity (Table 1; Entry 5 and 6). Additionally, some minor products were also detected; 4% to 8% THFA was formed over Pt/C and Pt/GO, respectively, (Table 1; Entry 1 and 2), whereas, Pt/MCM-41, results 11% of 2-furfurylfuran; a condensation product of furfuryl alcohol (Table 1; Entry 4).
The efficiency of Pt/Al2O3 on the selective hydrogenation of aldehyde group can be assessed after comparing the performance with other group VIII metals (Pd, Rh and Ru) supported on Al2O3 (Table 1; Entry 7–10). The calculated TOF at the same conversion level (∼10%) follows the order of Pd (6400 h−1) > Pt (6000 h−1) > Ru (293 h−1) > Rh (95 h−1). It can be seen that Pd catalyst clearly demonstrates the highest reaction rate, however, selectivity of furfuryl alcohol was comparatively lower (64%) (Table 1; Entry 7) than Pt. Due to the strong hydrogen dissociation ability and preference towards the hydrogenation of C![[double bond, length as m-dash]](https://www.rsc.org/images/entities/char_e001.gif) C bond,29 Pd results in the formation of THFA (21.6%) as well as the ring opening products (1,2-pentanediol = 8.6%, 1,5-pentanediol = 5.8%) within the reaction time of 4 h (Table 1; Entry 7). An improved alcohol selectivity (81.6%) was accomplished in a controlled experiment with reduced hydrogen pressure (0.5 MPa) and the reaction time (1 h) (Table 1; Entry 8), however, it was difficult to prevent the hydrogenation of –C
C bond,29 Pd results in the formation of THFA (21.6%) as well as the ring opening products (1,2-pentanediol = 8.6%, 1,5-pentanediol = 5.8%) within the reaction time of 4 h (Table 1; Entry 7). An improved alcohol selectivity (81.6%) was accomplished in a controlled experiment with reduced hydrogen pressure (0.5 MPa) and the reaction time (1 h) (Table 1; Entry 8), however, it was difficult to prevent the hydrogenation of –C![[double bond, length as m-dash]](https://www.rsc.org/images/entities/char_e001.gif) C of the furan ring over Pd. On the other hand, despite the low reaction rate, Rh and Ru exhibited very high furfuryl alcohol selectivity of 97.9% and 96.4%, respectively (Table 1; Entry 9 and 10). Based on the observed catalytic activity (the highest conversion and selectivity), Pt/Al2O3, emerged as a most suitable candidate for further studies. No reaction was observed in the absence of catalyst or with the only support materials.
C of the furan ring over Pd. On the other hand, despite the low reaction rate, Rh and Ru exhibited very high furfuryl alcohol selectivity of 97.9% and 96.4%, respectively (Table 1; Entry 9 and 10). Based on the observed catalytic activity (the highest conversion and selectivity), Pt/Al2O3, emerged as a most suitable candidate for further studies. No reaction was observed in the absence of catalyst or with the only support materials.
Phase behaviour of furfural in compressed CO2
As CO2 is a compressed gas, it is necessary to understand the reaction environment in the presence of substrate. Hence, phase observation was performed between furfural and CO2–H2. Fig. 1(a–e) show the images of possible phase change phenomenon occurred between the substrate and CO2–H2 during the reaction, replicated separately in a view cell. Fig. 1a and b are snapshots of the empty cell and after the incorporation of furfural (liquid), respectively. As 8 MPa of CO2 was introduced along with the furfural, a biphasic system consisted of gaseous CO2–H2 and liquid substrate phases were evident (Fig. 1c; yellow line representing the meniscus). When the pressure was increased to 10 MPa, furfural just started to dissolve in CO2 (Fig. 1d) and transformed into a single phase at 14 MPa as the meniscus between two phases (CO2–H2 and substrate) disappeared (Fig. 1e), which suggested a pressure dependent solubility of furfural.
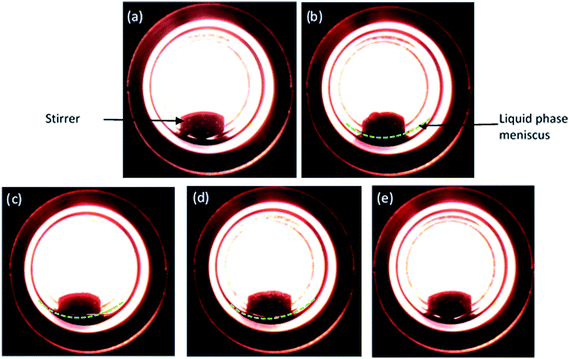 |
| | Fig. 1 Images of various phases of furfural (liquid) and CO2/H2 (gas) observed during the reaction depending on CO2 pressure at 80 °C and hydrogen pressure of 1 MPa. (a) Empty cell, (b) furfural (c) 8 MPa, (d) 10 MPa and (e) 14 MPa. | |
Optimisation of different reaction parameters
The effects of different reaction parameters (CO2 and hydrogen pressure, temperature, substrate concentration and reaction time) on the activity and selectivity of furfural hydrogenation has been investigated to optimize the reaction conditions.
CO2 pressure
To optimise CO2 pressure, the reaction was conducted at 4 MPa to 14 MPa, while keeping the temperature and hydrogen pressure fixed at 80 °C and 1 MPa, respectively (Fig. 2). There is a change in the conversion of furfural from 81% to ∼99% with an increase in pressure from 4 MPa to 8 MPa. Surprisingly, the conversion started to decrease at higher pressures (>10 MPa) and finally dropped to 50.9% at 14 MPa. Independent of the CO2 pressure, furfuryl alcohol was detected as a main product. A negligible amount of THFA (∼1%) was also present in the product mixture within the pressure range of 6 to 8 MPa and then increased to 8% at higher pressure, with the subsequent reduction of furfuryl alcohol selectivity. As mentioned before, a change in CO2 pressure at the fixed temperature influence the solubility of the substrate (Fig. 1), hence, pressure dependent catalytic activity can be rationalised by considering the phase behaviour between furfural and CO2–H2 (Phase observation section). Correlating with the catalytic activity, the present system demonstrates that the highest conversion was achieved in the biphasic state (8 MPa; Fig. 1c), whereas, the reaction rate decreased after reaching a single phase (>10 MPa; Fig. 1e). These results could be attributed to the generation of “CO2-expanded liquid” through the dissolution of CO2 in organic liquid phase,30 exists in the vicinity of the catalyst, which can dissolve a large amount of hydrogen and significantly enhanced the reaction rate even in the biphasic conditions.31 On the contrary, at higher pressure (single phase), dissolution of furfural in CO2–H2 causes dilution of the liquid phase near the catalyst, and explain the decreased conversion. Therefore, the substrate concentration near the catalyst surface is one of the prime factors, which controlled the reaction. Furthermore, the enhanced selectivity of THFA at higher pressure can be justified by the presence of hydrogen and furfuryl alcohol in the same phase, which causes further hydrogenation (ESI: Fig. S1a and b†). Based on the results, an optimum CO2 pressure of 8 MPa was used to investigate the other parameters.
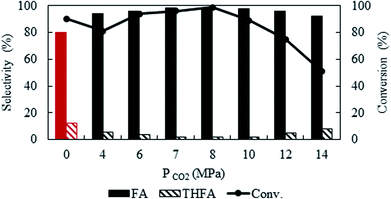 |
| | Fig. 2 Effect of CO2 pressure on the conversion and selectivity of furfural hydrogenation using Pt/Al2O3. Reaction conditions: catalyst![[thin space (1/6-em)]](https://www.rsc.org/images/entities/char_2009.gif) : :![[thin space (1/6-em)]](https://www.rsc.org/images/entities/char_2009.gif) substrate = 1 substrate = 1![[thin space (1/6-em)]](https://www.rsc.org/images/entities/char_2009.gif) : :![[thin space (1/6-em)]](https://www.rsc.org/images/entities/char_2009.gif) 40, temperature = 80 °C, PH2 = 1 MPa, reaction time = 4 h. 40, temperature = 80 °C, PH2 = 1 MPa, reaction time = 4 h. | |
Hydrogen pressure
Due to the high miscibility of hydrogen in compressed CO2, a careful control of hydrogen pressure is necessary to avoid unwanted transformation of furfural. Fig. 3 represents the change in catalytic activity with a variation in hydrogen pressure from 0.2 MPa to 4 MPa at 80 °C and the fixed CO2 pressure of 8 MPa. At 0.2 MPa, the conversion was low (28.6%), which then increased significantly to a maximum of ∼99%, at 1 MPa within the reaction time of 4 h. Notably, furfuryl alcohol was the only product produced at lower pressures of 0.2 MPa to 0.5 MPa, however, THFA appeared with a very low selectivity (∼1%) at 0.8 MPa to 1.0 MPa. On the other hand, at the higher pressure (4 MPa), a complete conversion can be obtained, but the selectivity of furfuryl alcohol was reduced (83.4%) because of the formation of THFA (11%) and ring opening products (1,2-pentanediol; 5.6%). These results confirmed that the large availability of hydrogen in the system causes over hydrogenation of furfural. Therefore, primary challenge was the critical control of hydrogen pressure to achieve the highest conversion and selectivity with the suppression of over hydrogenation. A hydrogen pressure of 1 MPa was chosen as an optimum pressure for the present system.
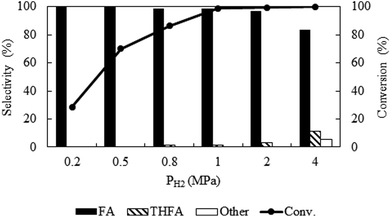 |
| | Fig. 3 Optimization of hydrogen pressure of furfural hydrogenation in compressed CO2. Reaction conditions: catalyst![[thin space (1/6-em)]](https://www.rsc.org/images/entities/char_2009.gif) : :![[thin space (1/6-em)]](https://www.rsc.org/images/entities/char_2009.gif) substrate = 1 substrate = 1![[thin space (1/6-em)]](https://www.rsc.org/images/entities/char_2009.gif) : :![[thin space (1/6-em)]](https://www.rsc.org/images/entities/char_2009.gif) 40, temperature = 80 °C, PCO2 = 8 MPa, reaction time = 4 h. 40, temperature = 80 °C, PCO2 = 8 MPa, reaction time = 4 h. | |
Variation of temperature
Temperature is one of the important parameters that possesses significant influence on the catalytic activity and also control the physicochemical (density, viscosity, diffusivity etc.) properties of CO2. For kinetic reason, with the change in temperature from 35 °C to 100 °C, the conversion of furfural enhanced from 25.3% to 99.5% (Fig. 4a). However, as a compressed gas, the density of CO2 varies widely with temperature; at a fixed pressure of CO2 (8 MPa) and H2 (1 MPa) the density of the medium varies from 0.132 g ml−1 to 0.096 g ml−1 (obtained by VLE calculation in the studied temperature range) with the change in temperature from 35 °C to 100 °C, leading to a change in solubility of the substrate. Hence, it is difficult to explain the enhanced activity along with temperature. Thus, considering the maximum activity and selectivity obtained at 80 °C (8 MPa, density = 0.102 g ml−1), another set of experiments were conducted under the same density (∼0.102 g ml−1) conditions at 35 °C (6.4 MPa) and 100 °C (8.7 MPa) (Table 1; Entry 11 and 12). Surprisingly, the conversion of furfural increased significantly from 10% to 65.7% at 35 °C as the density changed from 0.132 g ml−1 (8 MPa) to ∼0.102 g ml−1 (6.4 MPa), while at 100 °C the conversion of furfural was almost same as the density altered slightly from 0.096 g ml−1 (8 MPa) to ∼0.102 g ml−1 (8.7 MPa) (Table 1; Entry 12). These results can be explained by comparing the phase behaviour at a fixed pressure (8 MPa) and at a fixed density conditions (ESI: Fig. S2a–d†). At 35 °C, a change in CO2 pressure from 8 MPa to 6.4 MPa, changed the system from single to biphasic one and explains the enhanced catalytic activity (ESI: Fig. S2a and b†), whereas, no significant change was observed at 100 °C due to the nominal change in the density (ESI: Fig. S2c and d†). Although, the conversion was enhanced at 35 °C and 6.4 MPa of CO2 (65%), it is still low compared to the biphasic state generated at higher temperatures (∼99%). Thus, in our opinion, although, there was a density driven catalytic performance, it is better to suggest that the temperature has straightforward effect on the conversion and selectivity at a fixed pressure. An optimum temperature of 80 °C was used throughout the process. In addition, the activation energy (Ea) of the reaction was determined to be 10.6 kcal mol−1 under the applied reaction conditions (Fig. 4b), which agrees well with the computationally determined value (11.1 kcal mol−1) (ESI; Fig. S3† model for calculation). There was no significant impact of temperature on the product distribution.
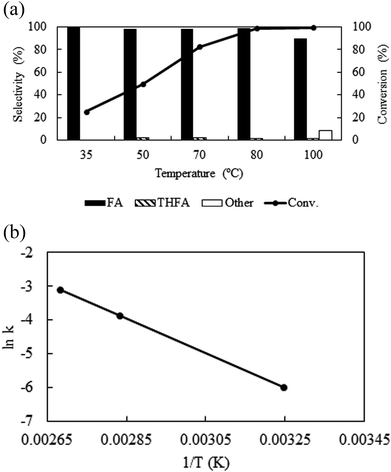 |
| | Fig. 4 (a) Temperature dependent activity and selectivity and (b) Arrhenius plot: reaction conditions: catalyst![[thin space (1/6-em)]](https://www.rsc.org/images/entities/char_2009.gif) : :![[thin space (1/6-em)]](https://www.rsc.org/images/entities/char_2009.gif) substrate = 1 substrate = 1![[thin space (1/6-em)]](https://www.rsc.org/images/entities/char_2009.gif) : :![[thin space (1/6-em)]](https://www.rsc.org/images/entities/char_2009.gif) 40, PCO2 = 8 MPa, PH2 = 1 MPa, reaction time = 4 h. 40, PCO2 = 8 MPa, PH2 = 1 MPa, reaction time = 4 h. | |
Amount of substrate
Fig. 5a shows the influence of substrate amount (0.05 g to 1.0 g) on the catalytic activity at 80 °C keeping other parameters constant (catalyst = 0.01 g, PCO2 = 8 MPa, PH2 = 1 MPa and reaction time = 4 h). Exploration of the experimental results revealed that increasing the amount of substrate, reduced the conversion from >99% to 42.7%. However, after we compare the TOF at the same conversion level (∼10%), it shows an enhancement from 3300 h−1 from 6000 h−1 with change in the substrate amount from 0.05 g to 0.4 g and then dropped for 1.0 g of furfural (2700 h−1) (Fig. 5b). Furthermore, the product distribution was also influenced by the substrate amount. Using 0.05 g of furfural, the selectivity of furfuryl alcohol dropped to 86.7%, due to the generation of THFA (8.4%), 1,2 pentanediol (2.8%) and 1,5-pentanediol (2.1%). On the contrary, increasing the amount of substrate (1.0 g) resulted 95% of furfuryl alcohol and 5% of 2-furfurylfuran. Therefore, it is reasonable to propose that at low substrate concentrations, although, complete conversion was obtained, over hydrogenation occurred because of the substrate scarcity. When 1.0 g substrate was employed, it might change the substrate/hydrogen ratio near the catalyst surface and the conversion dropped. Additional experiments were conducted to check the influence of substrate/hydrogen ratio (mol) fixed at 0.243 based on the maximum activity and selectivity achieved (Table 1; Entry 13 and 14). When the amount of furfural was very low (0.05 g), 0.12 MPa of hydrogen was sufficient to enhance the selectivity of furfuryl alcohol from 86.7% to 97.6%, although the conversion dropped slightly (∼96%) (Table 1; Entry 13). Similarly, for 1.0 g of the substrate, after changing the hydrogen pressure from 1 to 2.5 MPa, the conversion improved from 42.7% to 98.2% with a slight decrease in selectivity from 99.3% to 90.8% due to the appearance of THFA and the ring opening products (Table 1; Entry 14). Thus, in each case, a substrate/hydrogen mole ratio was found to be critical to achieve highest catalytic performance. These results implied that the hydrogen pressure and the amount of furfural have a linear relationship and demand an optimum substrate/hydrogen mole ratio to attain the maximum selectivity of the targeted product using Pt/Al2O3.
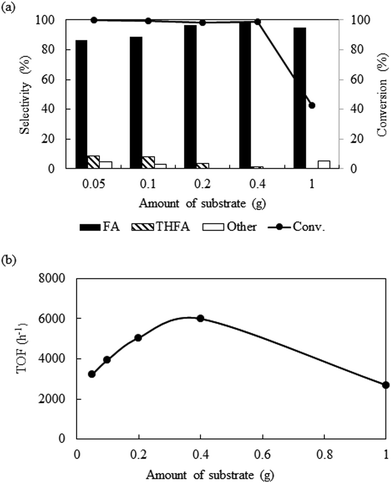 |
| | Fig. 5 Effect of the variation of substrate amount on the conversion and selectivity: reaction conditions: catalyst = 0.01 g, temperature = 80 °C, PCO2 = 8 MPa, PH2 = 1 MPa, reaction time = 4 h. | |
Reaction time dependent catalytic activity
To identify the reaction steps, a time course for the reaction was examined from 0.08 h to 18 h keeping other parameters constant (PCO2 = 8 MPa, PH2 = 1 MPa and temp. = 80 °C) (Fig. 6). There was no reaction observed right after the introduction of the reactants (0 h). In 0.08 h, only 4.6% furfural was converted, but the conversion increased steadily and reached the maximum of ∼99% in 4 h. No other products except furfuryl alcohol were in the detectable range until 0.5 h, after that ∼1% THFA appeared in the product mixture and remained almost constant. Hence, poor selectivity of THFA even after changing the different reaction parameters confirmed that hydrogenation of C![[double bond, length as m-dash]](https://www.rsc.org/images/entities/char_e001.gif) C is not a preferred route on Pt catalyst in compressed CO2.32 To check the long-term efficiency, the reaction was further extended for at least 18 h. The conversion of furfural was slightly improved from ∼99% to 100%, and the selectivity of furfuryl alcohol dropped from 98.6% to 95.0% due to the formation of THFA (4%) and 2-methylenebisfurfural (1%), which confirmed that the Pt catalyst still had the ability for further hydrogenation of furfuryl alcohol.
C is not a preferred route on Pt catalyst in compressed CO2.32 To check the long-term efficiency, the reaction was further extended for at least 18 h. The conversion of furfural was slightly improved from ∼99% to 100%, and the selectivity of furfuryl alcohol dropped from 98.6% to 95.0% due to the formation of THFA (4%) and 2-methylenebisfurfural (1%), which confirmed that the Pt catalyst still had the ability for further hydrogenation of furfuryl alcohol.
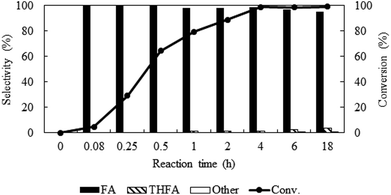 |
| | Fig. 6 Time profile of furfural hydrogenation in compressed CO2. Reaction conditions: catalyst![[thin space (1/6-em)]](https://www.rsc.org/images/entities/char_2009.gif) : :![[thin space (1/6-em)]](https://www.rsc.org/images/entities/char_2009.gif) substrate = 1 substrate = 1![[thin space (1/6-em)]](https://www.rsc.org/images/entities/char_2009.gif) : :![[thin space (1/6-em)]](https://www.rsc.org/images/entities/char_2009.gif) 40, temperature = 80 °C, PCO2 = 8 MPa, PH2 = 1 MPa. 40, temperature = 80 °C, PCO2 = 8 MPa, PH2 = 1 MPa. | |
Catalytic activity in organic solvents
To confirm the suitability of compressed CO2 as a reaction medium, the catalytic activity of the selected Pt/Al2O3 catalyst was evaluated using various polar solvents (water, methanol, ethanol and 2-propanol), generally used for the hydrogenation of furfural in liquid phase and also a nonpolar solvent such as hexane, which has comparable dielectric constant with the compressed CO2 under the same reaction conditions (Table 2). Results in Table 2 show that the conversion of furfural was high in polar solvents, but dropped significantly in nonpolar solvents: water (98.6%) > methanol (93.6%) > ethanol (82.0%) > 2-propanol (66.7%) > hexane (16.0%) (Table 2; Entry 1 to 5) indicating a clear trend correlating the dielectric constant of the medium with catalytic activity. Furthermore, among the polar solvents, 2-propanol afforded highest selectivity (94.9%) of furfuryl alcohol followed by water (∼90%), ethanol (88.4%) and then dropped substantially in methanol (25.9%) (Table 2; Entry 1–4). In the applied conditions, solvent related acetal formation enables rationalization of the reduced selectivity in polar solvents,30,33 whereas, nonpolar solvents like hexane, produced a complete selectivity to furfuryl alcohol (Table 2; Entry 5), but with the lowest conversion. Thus, comparing the performance of Pt/Al2O3 in traditional organic solvents and water under the same reaction conditions justified the use compressed CO2 as reaction medium, which exhibits excellent enhancement in the activity and selectivity.
Table 2 Hydrogenation of furfural in different organic solventsa
| Entry |
Solvent |
Conversion (%) |
Selectivity (%) |
| Furfuryl alcohol |
THFA |
Othera |
Reaction conditions: catalyst![[thin space (1/6-em)]](https://www.rsc.org/images/entities/char_2009.gif) : :![[thin space (1/6-em)]](https://www.rsc.org/images/entities/char_2009.gif) substrate = 1 substrate = 1![[thin space (1/6-em)]](https://www.rsc.org/images/entities/char_2009.gif) : :![[thin space (1/6-em)]](https://www.rsc.org/images/entities/char_2009.gif) 40; temp. = 80 °C; time = 4 h; PH2 = 1 MPa; solvent = 5 ml (corresponds to ∼0.14 mol of CO2); substrate concentration = 8%. Solvent related products for methanol, ethanol and 2-propanol are dimethyl, diethyl acetal and 2-isopropoxymethylfuran, respectively. 2,2′-Oxybis(methylene)difuran. 40; temp. = 80 °C; time = 4 h; PH2 = 1 MPa; solvent = 5 ml (corresponds to ∼0.14 mol of CO2); substrate concentration = 8%. Solvent related products for methanol, ethanol and 2-propanol are dimethyl, diethyl acetal and 2-isopropoxymethylfuran, respectively. 2,2′-Oxybis(methylene)difuran. |
| 1 |
Water |
98.6 |
89.5 |
— |
10.5b |
| 2 |
Methanol |
93.6 |
25.9 |
— |
74.1 |
| 3 |
Ethanol |
82.0 |
88.4 |
— |
11.6 |
| 4c |
2-Propanol |
66.7 |
94.9 |
— |
5.1 |
| 5 |
Hexane |
16.0 |
100.0 |
— |
— |
Comparison of activity with solvent-less conditions
Solvent-less condition is an impeccable way to develop an environmentally benign method. The hydrogenation of furfural has been investigated in the absence of any solvent (Fig. 2 marked with red). The result grabbed our attention due to the comparable catalytic activity with compressed CO2, which demonstrated a very high conversion of 90.2% and generates 80.3% furfuryl alcohol. A kinetic study of the reaction in solvent-less condition (Fig. 7) reveal that 40.6% furfural was converted within the reaction time of 0.25 h, which is higher than in compressed CO2 (29.2%). Comparing the reaction rate (TOF) at the lowest conversion (∼10%), suggested ∼1.5 times faster rate of furfural hydrogenation without any solvent (TOFCO2 = 6.0 × 10³ h−1 and TOFsolvent-less = 8.2 × 10³ h−1). Unfortunately, there was no change in the conversion of furfural after reaching the maximum of 90.2% in 1 h (Fig. 7). Contrarily, in compressed CO2, the catalyst ran successfully without experiencing any reduction in activity over the course of 18 h (Fig. 6). To address the decreased catalytic performance, at first we focused on the change in structural morphology of the spent catalysts from the reaction in compressed CO2 and solvent-less condition. Characterization of the used catalyst using different spectroscopic techniques (TEM, FTIR and XPS) and comparing the results with the fresh one confirmed that there was no substantial change occurred after the reaction (ESI; Fig. S4 to S6†). For instance, TEM images taken before and after the reactions in compressed CO2 (after 4th recycle) and in the solvent-less condition (after first reaction) described an unchanged morphology of the catalyst, which maintained an average particle size of 5 ± 0.5 nm (Fig. S4†). In the FTIR spectra of the used catalyst (compressed CO2 and solvent-less condition) no appreciable changes were observed (Fig. S5†). To detect any change in the oxidation state of Pt, we also analysed the XPS spectra of the fresh catalyst and after the reaction (ESI: Fig. S6(a–c); Table S1†). All the catalyst shows a doublet corresponding to metallic Pt (Pt 4f7/2 = 70.4 eV; Pt 4f5/2 = 73.4 eV). In addition, surface composition of fresh and used catalysts was also maintained (Table S1†). As the spectroscopic characterization failed to produce any significant difference in catalyst morphology between the fresh and used catalyst, we directed our attention to the corresponding product distributions of each system. Fig. 8 compares the yield of furfuryl alcohol and THFA obtained in compressed CO2 and in the solvent-less condition. We note that the primary difference between these two reaction systems is the augmentation of the THFA yield in the absence of any solvent. The calculated rate of formation of THFA, is substantially high in the solvent-less condition (TOFsolvent-less = 292 h−1) compared with compressed CO2 (TOFCO2 = 2.8 h−1) at the conversion level (∼89%) in which THFA appeared.
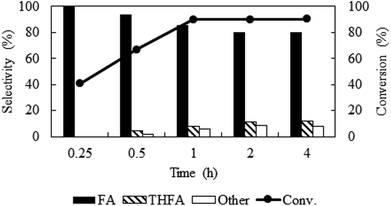 |
| | Fig. 7 Time course of the reaction under solvent-less condition over Pt/Al2O3 catalyst. Reaction conditions: catalyst![[thin space (1/6-em)]](https://www.rsc.org/images/entities/char_2009.gif) : :![[thin space (1/6-em)]](https://www.rsc.org/images/entities/char_2009.gif) substrate = 1 substrate = 1![[thin space (1/6-em)]](https://www.rsc.org/images/entities/char_2009.gif) : :![[thin space (1/6-em)]](https://www.rsc.org/images/entities/char_2009.gif) 40, temperature = 80 °C, PH2 = 1 MPa. 40, temperature = 80 °C, PH2 = 1 MPa. | |
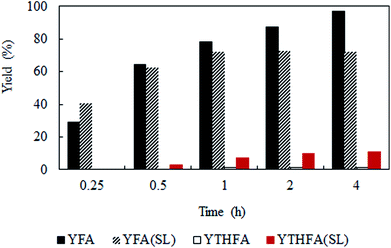 |
| | Fig. 8 Time dependent yield of furfuryl alcohol and THFA. Reaction conditions: catalyst![[thin space (1/6-em)]](https://www.rsc.org/images/entities/char_2009.gif) : :![[thin space (1/6-em)]](https://www.rsc.org/images/entities/char_2009.gif) substrate = 1 substrate = 1![[thin space (1/6-em)]](https://www.rsc.org/images/entities/char_2009.gif) : :![[thin space (1/6-em)]](https://www.rsc.org/images/entities/char_2009.gif) 40, temperature = 80 °C, PH2 = 1 MPa. YFA = yield of furfuryl alcohol, YTHFA = yield of THFA in compressed CO2; YFA (SL) = yield of furfuryl alcohol and YTHFA (SL) = yield of THFA in solvent-less condition. 40, temperature = 80 °C, PH2 = 1 MPa. YFA = yield of furfuryl alcohol, YTHFA = yield of THFA in compressed CO2; YFA (SL) = yield of furfuryl alcohol and YTHFA (SL) = yield of THFA in solvent-less condition. | |
The fundamentals behind the high reaction rate is a complicated issue. It can be predicted that the adsorption and desorption process of reactant and product on the catalyst surface has considerable effect on the reaction rate. Thus, we carried out a computational study to gain molecular level understandings of the adsorption/desorption phenomenon via calculation of the adsorption energy of furfural and furfuryl alcohol (major product) on the catalyst surface using Grand Canonical Monte Carlo method (details are in the ESI Section†). In this calculation, each of the molecules were allowed to adsorb within the constraint of periodicity at the experimental temperature of 80 °C. Fig. 9(a–d) and Table 3 provides possible adsorption modes and their corresponding energies, in compressed CO2 and in the solvent-less condition, respectively. Calculated adsorption energy of furfural in the compressed CO2 (−89.5 kcal mol−1) and in the solvent-less condition (−24.1 kcal mol−1), reveals a stronger adsorption in the former environment, hence, reduced reaction rate (Table 3; Entry 1). Moreover, faster desorption of furfuryl alcohol from the catalyst surface can be confirmed from the low adsorption energy in solvent-less condition (−26.6 kcal mol−1) compared to the compressed CO2 (−93.0 kcal mol−1), triggering faster desorption and eventually accelerated reaction rate as well as the enhanced rate of formation of THFA (Table 3; Entry 2).
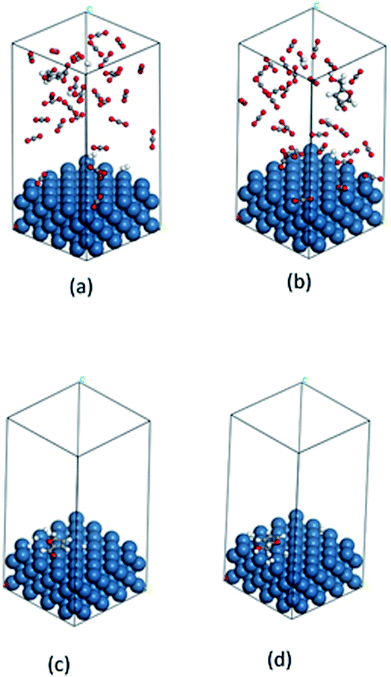 |
| | Fig. 9 Calculated images of adsorption: (a) furfural, (b) furfuryl alcohol in compressed CO2 and (c) furfural, (d) furfuryl alcohol in solvent-less condition on the catalyst surface. Color code: catalyst surface = teal, hydrogen = white, carbon = grey and oxygen = red. | |
Table 3 Calculated adsorption energy of reactant and the major product detected during the transformation of furfural
| Entry |
Molecule |
Adsorption energy (kcal mol−1) |
| Compressed CO2 |
Solvent-less |
| 1 |
Furfural |
−89.58427935 |
−24.13588960 |
| 2 |
Furfuryl alcohol |
−93.06611916 |
−26.58107491 |
Computational determination of the mobility of THFA
From the previous section, we observed that THFA was formed with very high rate in solvent-less conditions and with extremely low rate in compressed CO2. From the experimental data, we confirmed that the catalyst durability was lost when the reaction was performed without any solvent and one of the major differences is the formation of THFA. Of the several key issues that could have caused the loss of catalytic activity, the primary reason was thought to be diffusional restriction of compounds involved in a reaction system (reactant/product/intermediate). We have applied a molecular dynamics simulation to monitor the diffusion of THFA as well as to calculate the diffusion co-efficient (evaluated from the slope of mean-square-displacement (MSD) vs. time plot) by means of the Einstein relationship34 in compressed CO2 and in the solvent-less condition. Accuracy of the molecular simulation depends on the generated structure. Fig. 10a–d show the images of mobility and their corresponding MSD plot, in compressed CO2 and in solvent-less condition, respectively. Interestingly, the images provided a strikingly different location of THFA depending on the reaction environment. Comparing the mobility of THFA molecule through the calculated diffusion coefficient (Dsolvent-less = 0.0531 Å2 ps−1 and DCO2 = 0.131 Å2 ps−1), it is observed that the molecule is free to move away from the catalyst surface in compressed CO2 due to the high diffusivity. On the other hand, a restricted movement near the catalyst surface was observed in the solvent-less condition. The results corresponded well with the experimental observation and perfectly fit to explain the longer catalyst lifetime in compressed CO2, hence beneficial for Pt like noble metal catalysts.
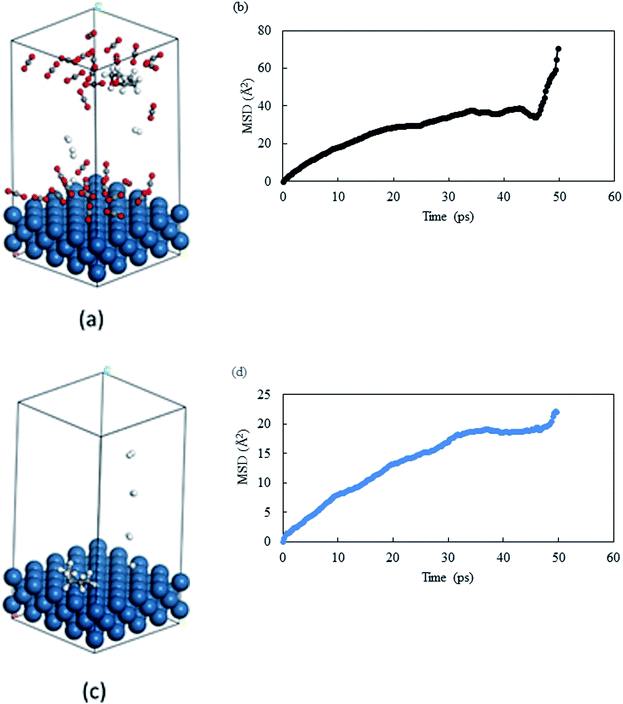 |
| | Fig. 10 Images of last frame of MD: (a) THFA in compressed CO2 and (c) THFA in solvent-less condition. Catalyst surface = teal, hydrogen = white, carbon = grey and oxygen = red. MSD plot of THFA in (b) compressed CO2 and (d) solvent-less condition. | |
Catalyst recycling
Deactivation of the catalyst is a common problem that generally occurs in the hydrogenation of furfural in the gas phase or in the liquid phase reaction due to coke formation, strong adsorption of reaction species as well as change in the active site. Thus, the spent catalyst was recycled after separation from the product mixture simply by filtration (Fig. S7†). The obtained results confirmed the stability of the catalyst, which slightly loses its activity after 4th recycle possibly because of handling. Hence, the catalyst provided appreciable reusability under the studied reaction conditions.
Conclusion
This study has highlighted the fact that the selective hydrogenation of furfural to furfuryl alcohol can be performed with the extreme efficiency on Pt/Al2O3 in compressed CO2 without any diluent or additives. Optimisation of different reaction parameters (CO2 and hydrogen pressure, temperature, substrate/hydrogen ratio and nature of the support) confirmed the participation of each factors in the catalytic activity. This approach reveals a comparable reaction profile in compressed CO2 and solvent-less condition, which differ widely in organic solvents. Despite the high catalytic activity and selectivity in the solvent-less condition, robustness of the catalyst was hampered due to the formation of THFA. A combined approach of experimental analysis and computational studies confirmed that compressed CO2 renders the best condition to restrict the generation of THFA; a potential candidate of deactivation. The high diffusivity of compressed CO2 controlled the mobility of THFA near the catalyst surface as confirmed by the higher diffusion coefficient, which enhanced the durability of the catalyst.
The simple methodology presented here is the best way to achieve excellent selectivity, easy product separation and appreciable recyclability. Advancement of the discussed strategy can be accelerated after exploring the versatility of this method towards the development of a sustainable technology for selective transformation of biomass-derived platform molecules.
Methods
Materials
Furfural was purchased from Wako Pure Chemicals Industries Ltd. and used as received. Carbon dioxide (>99.99%) was supplied by Nippon Sanso Co. Ltd. Pt/Al2O3, Pd/Al2O3 and Ru/Al2O3 were from Aldrich. Rh/Al2O3, was from Wako Pure Chemicals Industries Ltd. Pt catalysts supported on MCM-41 and substituted MCM-41 were synthesised in our laboratory hydrothermally via direct introduction method using tetraethylorthosilicate (silica source), cetyltrimethylammonium bromide (CTAB; template), sodium hydroxide (NaOH) and Pt salt solution (Pt acetylacetonate).35 In brief, a gel of molar composition SiO2![[thin space (1/6-em)]](https://www.rsc.org/images/entities/char_2009.gif) :
:![[thin space (1/6-em)]](https://www.rsc.org/images/entities/char_2009.gif) 0.12CTAB
0.12CTAB![[thin space (1/6-em)]](https://www.rsc.org/images/entities/char_2009.gif) :
:![[thin space (1/6-em)]](https://www.rsc.org/images/entities/char_2009.gif) xAl or Ti
xAl or Ti![[thin space (1/6-em)]](https://www.rsc.org/images/entities/char_2009.gif) :
:![[thin space (1/6-em)]](https://www.rsc.org/images/entities/char_2009.gif) 0.5NaOH
0.5NaOH![[thin space (1/6-em)]](https://www.rsc.org/images/entities/char_2009.gif) :
:![[thin space (1/6-em)]](https://www.rsc.org/images/entities/char_2009.gif) PtO
PtO![[thin space (1/6-em)]](https://www.rsc.org/images/entities/char_2009.gif) :
:![[thin space (1/6-em)]](https://www.rsc.org/images/entities/char_2009.gif) 118H2O, where, x can be varied from 0.25 to 0.01 was obtained by the step-wise addition of all the components (CTAB + H2O + NaOH → Pt solution of desired concentration → SiO2) with continuous stirring, subjected to hydrothermal treatment for 48 h at 140 °C in an autoclave. After that the autoclave was cooled at room temperature, the solid product was filtered, washed with deionised water and dried at 60 °C. Calcination of the sample was carried out at 550 °C in air for 8 h to remove the template. In each case metal content was ∼5 wt%. Detail of the catalyst characterisation is in the ESI Section.†
118H2O, where, x can be varied from 0.25 to 0.01 was obtained by the step-wise addition of all the components (CTAB + H2O + NaOH → Pt solution of desired concentration → SiO2) with continuous stirring, subjected to hydrothermal treatment for 48 h at 140 °C in an autoclave. After that the autoclave was cooled at room temperature, the solid product was filtered, washed with deionised water and dried at 60 °C. Calcination of the sample was carried out at 550 °C in air for 8 h to remove the template. In each case metal content was ∼5 wt%. Detail of the catalyst characterisation is in the ESI Section.†
Catalytic activity
Furfural hydrogenation was conducted in a 50 ml batch reactor placed in a hot air circulating oven and the details are given elsewhere.36 In a typical experiment, a required amount of the catalyst (0.01 g) and substrate (neat) (0.4 g) were introduced in the reactor. The reactor was heated for a specified amount of time (90 min) to attain the required temperature of 80 °C. After that, hydrogen followed by CO2, was charged into the reactor using a high-pressure liquid pump (JASCO) and then compressed to the desired pressure. The content of the reactor was stirred with a magnetic stirrer bar during the reaction. After reaction, the reactor was quenched using an ice bath followed by careful depressurization to atmospheric pressure. In the next step, solid catalyst was separated from liquid product simply by filtration. The products were identified by GC-MS against a standard, which was also used for qualitative analysis. Detail of the analytical method is in the ESI Section.†
Phase observation
The phase behaviour of furfural in compressed CO2 was studied separately in a 10 ml high pressure view cell fitted with sapphire windows. The cell was placed over a magnetic stirrer for stirring the content and connected to a pressure controller, to regulate the pressure inside the view cell. In addition, a temperature controller was also used to maintain the desired temperature of 80 °C ± 1 °C. Required materials were introduced into the view cell at a constant hydrogen pressure of 1 MPa, while CO2 pressure was varied from 4 to 14 MPa. The content of the view cell was stirred continuously using a magnetic stirrer and the images were recorded after stopping the stirrer. Phase behaviour of furfuryl alcohol was also checked separately using the same procedure.
Computational methodology
Method of calculating mobility using molecular dynamic simulation
To calculate the mobility of the targeted molecule, molecular dynamics simulation was performed with a molecular dynamics engine from DASSAULT Systemes, BIOVIA called FORCITE. A constant volume and a constant temperature ensemble (NVT) was maintained throughout the calculation. We have used Nosé–Hoover–Langevin (NHL) as the barostat and run the calculation for 50 ps with a time step of 1 fs. The Pt layer is constraint for all the calculation. We have used COMPASS force-field and used the force-field charges and other parameters from there. Ewald37 summation method and atomic cut off for van der Waals interactions were used to handle long range forces. The calculation was run for 50![[thin space (1/6-em)]](https://www.rsc.org/images/entities/char_2009.gif) 000 steps or 50 ps and every 250 steps the frames were saved followed by the analysis of the mean square displacement (MSD) of the targeted molecule in the presence and in the absence of CO2. Mean square displacement (MSD) analysis is a technique which determines the mode of displacement of particles followed over time. In particular, it can help to determine whether the particle is freely diffusing, transported, or bound. In addition MSD analysis can derive an estimate of the parameters of movement, such as the diffusion coefficient for freely diffusing particles. The MSD can be obtained directly from the particle positions in a molecular dynamics simulation. If r(t) is the position at time t, and r(t + Δt) the position an interval Δt later, the squared displacement of the particle during that interval is (r(t + Δt) − r(t))2. The increase of MSD with time is related to the diffusion coefficient D:
000 steps or 50 ps and every 250 steps the frames were saved followed by the analysis of the mean square displacement (MSD) of the targeted molecule in the presence and in the absence of CO2. Mean square displacement (MSD) analysis is a technique which determines the mode of displacement of particles followed over time. In particular, it can help to determine whether the particle is freely diffusing, transported, or bound. In addition MSD analysis can derive an estimate of the parameters of movement, such as the diffusion coefficient for freely diffusing particles. The MSD can be obtained directly from the particle positions in a molecular dynamics simulation. If r(t) is the position at time t, and r(t + Δt) the position an interval Δt later, the squared displacement of the particle during that interval is (r(t + Δt) − r(t))2. The increase of MSD with time is related to the diffusion coefficient D:| |
 |
(1)
|
where, Nα is the number of diffusive atoms in the system and ri(t) and ri(0) denotes the position vector of the atom at time t and t = 0, respectively. Diffusion co-efficient was calculated from the slope of the curve (a) after fitting the data in diffusion regime to a straight line of y = ax + b, and abstract the slope a according to the above definition, D then follows as: D = a/6. Details of adsorption energy calculation is in the ESI Section.†
Conflicts of interest
There are no conflicts to declare.
Acknowledgements
H. K. is funded by the Japan-U.S. cooperation project for research and standardization of Clean Energy Technologies, The Ministry of Economy, Trade and Industry (METI), Japan and CREST, Japan Science and Technology (JST).
References
-
(a) G. W. Huber, S. Iborra and A. Corma, Chem. Rev., 2006, 106, 4044–4098 CrossRef PubMed;
(b) Y. Liu, C. Luo and H. Liu, Angew. Chem., Int. Ed., 2012, 51, 3249–3253 CrossRef PubMed;
(c) Y. Nakagawa, M. Tamura and K. Tomishige, ACS Catal., 2013, 3, 2655–2668 CrossRef;
(d) R. Carrasquillo-Flores, M. Kaldstrom, F. Schuth, J. A. Dumesic and R. Rinaldi, ACS Catal., 2013, 3, 993–997 CrossRef;
(e) M. J. Climent, A. Corma and S. Iborra, Green Chem., 2014, 16, 516–547 RSC;
(f) Q. Zhang and F. Jerome, ChemSusChem, 2013, 6, 2042–2044 CrossRef PubMed;
(g) A. M. Ruppert, K. Weinberg and R. Palkovits, Angew. Chem., Int. Ed., 2012, 51, 2564–2601 CrossRef PubMed.
- R. Mariscal, P. Maireles-Torres, M. Ojeda, I. Sadaba and M. López Granados, Energy Environ. Sci., 2016, 9, 1144–1189 Search PubMed.
-
(a) R. H. Kottke, Kirk-Othmer, Encyclopedia of Chemical Technology, John Wiley and Sons, New York, vol. 12, 1998 Search PubMed;
(b) H. E. Hoydonckx, W. M. Van Rhijn, W. Van Rhijn, D. E. De Vos and P. A. Jacobs, Furfural and Derivatives, Wiley-VCH Verlag GmbH & Co. KGaA, Weinheim, 2012 Search PubMed.
-
(a) F. D. Pileidis and M.-M. Titirici, ChemSusChem, 2016, 9, 562–580 CrossRef PubMed;
(b) J. P. Lange, E. van der Heide, J. van Buijtenen and R. Price, ChemSusChem, 2012, 5, 150–166 CrossRef PubMed.
-
(a) S. Sitthisa, T. Sooknoi, Y. G. Ma, P. B. Balbuena and D. E. Resasco, J. Catal., 2011, 277, 1–13 CrossRef;
(b) S. Sitthisa, T. Pham, T. Prasomsri, T. Sooknoi, R. G. Mallinson and D. E. Resasco, J. Catal., 2011, 280, 17–27 CrossRef.
-
(a) V. Vorotnikov, G. Mpourmpakis and D. G. Vlachos, ACS Catal., 2012, 2, 2496–2504 CrossRef;
(b) J. W. Medlin, ACS Catal., 2011, 1, 1284–1297 CrossRef.
-
(a) R. V. Sharma, U. Das, R. Sammynaiken and A. K. Dalai, Appl. Catal., A, 2013, 454, 127–136 CrossRef;
(b) K. Yan, C. Jarvis, T. Lafleur, Y. X. Qiao and X. Xie, RSC Adv., 2013, 3, 25865–25871 RSC.
-
(a) M. M. Villaverde, N. M. Bertero, T. F. Garetto and A. J. Marchi, Catal. Today, 2013, 213, 87–93 CrossRef;
(b) C. P. Jiménez-Gómez, J. A. Cecilia, R. Moreno-Tost and P. Maireles-Torres, Top. Catal., 2017, 60, 1040–1053 CrossRef.
-
(a) Z. Strassberger, M. Mooijman, E. Ruijter, A. H. Alberts, C. de Graaff, R. V. A. Orru and G. Rothenberg, Appl. Organomet. Chem., 2010, 24, 142–146 Search PubMed;
(b) K. J. Zeitsch, Sugar Series, Elsevier, The Netherlands, vol. 13, 2000 Search PubMed;
(c) H. Adkins and R. Connor, US Pat., 2094975, 1937;
(d) L. J. Frainier and H. H. Fineberg, US Pat., 4302397, 1981.
- W. Gong, C. Chen, Y. Zhang, H. Zhou, H. Wang, H. Zhang, Y. Zhang, G. Wang and H. Zhao, ACS Sustainable Chem. Eng., 2017, 5, 2172–2180 CrossRef.
- Y. Yang, Y. Miao, S. Li, L. Gao and G. Xiao, Mol. Catal., 2017, 436, 128–137 CrossRef.
- J. Zhang and J. Chen, ACS Sustainable Chem. Eng., 2017, 5, 5982–5993 CrossRef.
- X. Yang, H. Chen, Q. Meng, H. Zheng, Y. Zhu and Y. W. Li, Catal. Sci. Technol., 2017, 7, 5625–5634 Search PubMed.
- S. H. Pang, N. E. Love and J. W. Medlin, J. Phys. Chem. Lett., 2014, 5, 4110–4114 CrossRef PubMed.
- M. J. Taylor, L. Jiang, J. Reichert, A. C. Papageorgiou, S. K. Beaumont, K. Wilson, A. F. Lee, J. V. Barth and G. Kyriakou, J. Phys. Chem. C, 2017, 121, 8490–8497 Search PubMed.
- M. J. Taylor, L. J. Durndell, M. A. Isaacs, C. M. A. Parlett, K. Wilson, A. F. Lee and G. Kyriakou, Appl. Catal., B, 2016, 180, 580–585 CrossRef.
- M. G. Dohade and P. L. Dhepe, Green Chem., 2017, 19, 1144–1154 RSC.
- X. Liu, B. Zhang, B. Fei, X. Chen, J. Zhang and X. Mu, Faraday Discuss., 2017, 202, 79–98 RSC.
-
(a) J. Kijenski, P. Winiarek, T. Paryjczak, A. Lewicki and A. Mikołajska, Appl. Catal., A, 2002, 233, 171–182 CrossRef;
(b) X. Chen, L. Zhang, B. Zhang, X. Guo and X. Mu, Sci. Rep., 2016, 6, 2855–2858 Search PubMed;
(c) A. O'Driscoll, T. Curtin, W. Y. Hernández, P. van der Voort and J. J. Leahy, Org. Process Res. Dev., 2016, 20, 1917–1929 CrossRef;
(d) A. B. Merlo, V. Vetere, J. M. Ramallo-Lopez, F. G. Requejo and M. L. Casella, React. Kinet., Mech. Catal., 2011, 104, 467–482 CrossRef.
- L. Liu, H. Lou and M. Chen, Appl. Catal., A, 2018, 550, 1–10 CrossRef.
- S. Kuhaudomlap, O. Mekasuwandumrong, P. Praserthdam, S.-I. Fujita, M. Arai and J. Panpranot, Catalysts, 2018, 8, 87–98 CrossRef.
-
(a) Z. L. Li, S. Kelkar, C. H. Lam, K. Luczek, J. E. Jackson, D. J. Miller and C. M. Saffron, Electrochim. Acta, 2012, 64, 87–93 CrossRef;
(b) S. K. Green, J. Lee, H. J. Kim, G. A. Tompsett, W. B. Kim and G. W. Huber, Green Chem., 2013, 15, 1869–1879 RSC;
(c) B. Zhao, M. Chen, Q. Guo and Y. Fu, Electrochim. Acta, 2014, 135, 139–146 CrossRef;
(d) X. H. Chadderdon, D. J. Chadderdon, J. E. Matthiesen, Y. Qiu, J. M. Carraher, J.-P. Tessonnier and W. Li, J. Am. Chem. Soc., 2017, 139, 14120–14128 CrossRef PubMed.
- M. Pierre, US Pat., 2763666, 1956.
- B. Miya, US Pat., 4252689, 1981.
-
(a) M. Chatterjee, A. Chatterjee, T. Ishizaka, T. Suzuki, A. Suzuki and H. Kawanami Adv, Adv. Synth. Catal., 2012, 354, 2009–2018 CrossRef;
(b) M. Chatterjee, T. Ishizaka, T. Suzuki, A. Suzuki and H. Kawanami, Green Chem., 2012, 14, 3415–3422 RSC;
(c) M. Chatterjee, T. Ishizaka, T. Suzuki, A. Suzuki and H. Kawanami, Catal. Sci. Technol., 2011, 1, 1466–1471 RSC.
-
(a) J. G. Stevens, R. A. Bourne, M. V. Twigg and M. Poliakoff, Angew. Chem., Int. Ed., 2010, 49, 8856–8859 CrossRef PubMed;
(b) M. Chatterjee, T. Ishizaka and H. Kawanami, Green Chem., 2018, 20, 2345–2355 RSC.
- R. Locus, D. Verboekend, R. Zhong, K. Houthoofd, T. Jaumann, S. Oswald, L. Giebeler, G. Baron and B. F. Sels, Chem. Mater., 2016, 28, 7731–7743 CrossRef.
- T. Tatsumi, K. A. Koyano and N. Igarashi, Stud. Surf. Sci. Catal., 1998, 121, 221–226 Search PubMed.
- M. Chatterjee, A. Chatterjee and Y. Ikushima, Green Chem., 2004, 6, 114–118 RSC.
- P. G. Jessop and B. Subramanium, Chem. Rev., 2007, 107, 2666–2694 CrossRef PubMed.
-
(a) G. Hitzler, F. R. Small, S. K. Ross and M. Poliakoff, Org. Process Res. Dev., 1998, 2, 137–146 CrossRef;
(b) D. Chouchi, D. Gourgouillon, M. Courel, J. Vital and M. Nunes da Ponte, Ind. Eng. Chem. Res., 2001, 40, 2551–2554 CrossRef.
-
(a) M. Chatterjee, M. Sato, H. Kawanami, T. Ishizaka, T. Yokoyama and T. Suzuki, Appl. Catal., A, 2011, 396, 186–193 CrossRef;
(b) C. I. Melo, R. Bogel-Łukasik, M. Gomes da Silva and E. Bogel-Łukasik, Green Chem., 2011, 13, 2825–2839 RSC.
-
(a) M. Chatterjee, F. Y. Zhao and Y. Ikushima, Adv. Synth. Catal., 2004, 346, 459–466 CrossRef;
(b) M. Chatterjee, F. Y. Zhao and Y. Ikushima, New J. Chem., 2003, 27, 510–513 RSC;
(c) M. Chatterjee, Y. Ikushima and F.-Y. Zhao, Catal. Lett., 2002, 82, 141–144 CrossRef.
- A. Einstein, Ann. Phys., 1905, 17, 549–560 CrossRef.
- M. Chatterjee, T. Iwasaki, Y. Onodera and T. Nagase, Catal. Lett., 1999, 61, 199–202 CrossRef.
- M. Chatterjee, A. Chatterjee and Y. Ikushima, Green Chem., 2004, 6, 114–118 RSC.
-
(a) P. P. Ewald, Ann. Phys., 1921, 64, 253–267 CrossRef;
(b) M. P. Tosi, Cohesion of ionic solids in Born model, in Solid State Physics, vol. 16, ed. Seitz F. and Turnbull D., Academic Press, New York, 1964, pp. 1–120 Search PubMed.
Footnote |
| † Electronic supplementary information (ESI) available. See DOI: 10.1039/c8ra03719a |
|
| This journal is © The Royal Society of Chemistry 2018 |
Click here to see how this site uses Cookies. View our privacy policy here.  Open Access Article
 *a,
Abhijit Chatterjeec,
Takayuki Ishizakaa and
Hajime Kawanami
 *ab
*ab
![[double bond, length as m-dash]](https://www.rsc.org/images/entities/char_e001.gif) C and an aldehyde group, and is extremely reactive in a hydrogen atmosphere, resulting in several by-products and a threat to alcohol selectivity as well as catalyst life. The process described has a very high reaction rate (6000 h−1) with an excellent selectivity/yield (99%) of alcohol, without any organic solvents or metal additives. This strategy has several key features over existing methodologies, such as reduced waste, and facile product separation and purification (reduced energy consumption). Combining the throughput of experimental observation and molecular dynamics simulation, indeed the high diffusivity of compressed CO2 controls the mobility of the compound, and eventually maintains the activity of the catalyst. Results are also compared for different solvents and solvent-less conditions. In particular, combination of an effective Pt catalyst with compressed CO2 provides an encouraging alternative solution for upgradation of biomass related platform molecules.
C and an aldehyde group, and is extremely reactive in a hydrogen atmosphere, resulting in several by-products and a threat to alcohol selectivity as well as catalyst life. The process described has a very high reaction rate (6000 h−1) with an excellent selectivity/yield (99%) of alcohol, without any organic solvents or metal additives. This strategy has several key features over existing methodologies, such as reduced waste, and facile product separation and purification (reduced energy consumption). Combining the throughput of experimental observation and molecular dynamics simulation, indeed the high diffusivity of compressed CO2 controls the mobility of the compound, and eventually maintains the activity of the catalyst. Results are also compared for different solvents and solvent-less conditions. In particular, combination of an effective Pt catalyst with compressed CO2 provides an encouraging alternative solution for upgradation of biomass related platform molecules.![[double bond, length as m-dash]](https://www.rsc.org/images/entities/char_e001.gif) C bond,29 Pd results in the formation of THFA (21.6%) as well as the ring opening products (1,2-pentanediol = 8.6%, 1,5-pentanediol = 5.8%) within the reaction time of 4 h (Table 1; Entry 7). An improved alcohol selectivity (81.6%) was accomplished in a controlled experiment with reduced hydrogen pressure (0.5 MPa) and the reaction time (1 h) (Table 1; Entry 8), however, it was difficult to prevent the hydrogenation of –C
C bond,29 Pd results in the formation of THFA (21.6%) as well as the ring opening products (1,2-pentanediol = 8.6%, 1,5-pentanediol = 5.8%) within the reaction time of 4 h (Table 1; Entry 7). An improved alcohol selectivity (81.6%) was accomplished in a controlled experiment with reduced hydrogen pressure (0.5 MPa) and the reaction time (1 h) (Table 1; Entry 8), however, it was difficult to prevent the hydrogenation of –C![[double bond, length as m-dash]](https://www.rsc.org/images/entities/char_e001.gif) C of the furan ring over Pd. On the other hand, despite the low reaction rate, Rh and Ru exhibited very high furfuryl alcohol selectivity of 97.9% and 96.4%, respectively (Table 1; Entry 9 and 10). Based on the observed catalytic activity (the highest conversion and selectivity), Pt/Al2O3, emerged as a most suitable candidate for further studies. No reaction was observed in the absence of catalyst or with the only support materials.
C of the furan ring over Pd. On the other hand, despite the low reaction rate, Rh and Ru exhibited very high furfuryl alcohol selectivity of 97.9% and 96.4%, respectively (Table 1; Entry 9 and 10). Based on the observed catalytic activity (the highest conversion and selectivity), Pt/Al2O3, emerged as a most suitable candidate for further studies. No reaction was observed in the absence of catalyst or with the only support materials.
![[thin space (1/6-em)]](https://www.rsc.org/images/entities/char_2009.gif) :
:![[thin space (1/6-em)]](https://www.rsc.org/images/entities/char_2009.gif) substrate = 1
substrate = 1![[thin space (1/6-em)]](https://www.rsc.org/images/entities/char_2009.gif) :
:![[thin space (1/6-em)]](https://www.rsc.org/images/entities/char_2009.gif) 40, temperature = 80 °C, PCO2 = 8 MPa, reaction time = 4 h.
40, temperature = 80 °C, PCO2 = 8 MPa, reaction time = 4 h.
![[thin space (1/6-em)]](https://www.rsc.org/images/entities/char_2009.gif) :
:![[thin space (1/6-em)]](https://www.rsc.org/images/entities/char_2009.gif) substrate = 1
substrate = 1![[thin space (1/6-em)]](https://www.rsc.org/images/entities/char_2009.gif) :
:![[thin space (1/6-em)]](https://www.rsc.org/images/entities/char_2009.gif) 40, PCO2 = 8 MPa, PH2 = 1 MPa, reaction time = 4 h.
40, PCO2 = 8 MPa, PH2 = 1 MPa, reaction time = 4 h.
![[double bond, length as m-dash]](https://www.rsc.org/images/entities/char_e001.gif) C is not a preferred route on Pt catalyst in compressed CO2.32 To check the long-term efficiency, the reaction was further extended for at least 18 h. The conversion of furfural was slightly improved from ∼99% to 100%, and the selectivity of furfuryl alcohol dropped from 98.6% to 95.0% due to the formation of THFA (4%) and 2-methylenebisfurfural (1%), which confirmed that the Pt catalyst still had the ability for further hydrogenation of furfuryl alcohol.
C is not a preferred route on Pt catalyst in compressed CO2.32 To check the long-term efficiency, the reaction was further extended for at least 18 h. The conversion of furfural was slightly improved from ∼99% to 100%, and the selectivity of furfuryl alcohol dropped from 98.6% to 95.0% due to the formation of THFA (4%) and 2-methylenebisfurfural (1%), which confirmed that the Pt catalyst still had the ability for further hydrogenation of furfuryl alcohol.

![[thin space (1/6-em)]](https://www.rsc.org/images/entities/char_2009.gif) :
:![[thin space (1/6-em)]](https://www.rsc.org/images/entities/char_2009.gif) substrate = 1
substrate = 1![[thin space (1/6-em)]](https://www.rsc.org/images/entities/char_2009.gif) :
:![[thin space (1/6-em)]](https://www.rsc.org/images/entities/char_2009.gif) 40, temperature = 80 °C, PCO2 = 8 MPa, PH2 = 1 MPa.
40, temperature = 80 °C, PCO2 = 8 MPa, PH2 = 1 MPa.![[thin space (1/6-em)]](https://www.rsc.org/images/entities/char_2009.gif) :
:![[thin space (1/6-em)]](https://www.rsc.org/images/entities/char_2009.gif) substrate = 1
substrate = 1![[thin space (1/6-em)]](https://www.rsc.org/images/entities/char_2009.gif) :
:![[thin space (1/6-em)]](https://www.rsc.org/images/entities/char_2009.gif) 40; temp. = 80 °C; time = 4 h; PH2 = 1 MPa; solvent = 5 ml (corresponds to ∼0.14 mol of CO2); substrate concentration = 8%.b Solvent related products for methanol, ethanol and 2-propanol are dimethyl, diethyl acetal and 2-isopropoxymethylfuran, respectively.c 2,2′-Oxybis(methylene)difuran.
40; temp. = 80 °C; time = 4 h; PH2 = 1 MPa; solvent = 5 ml (corresponds to ∼0.14 mol of CO2); substrate concentration = 8%.b Solvent related products for methanol, ethanol and 2-propanol are dimethyl, diethyl acetal and 2-isopropoxymethylfuran, respectively.c 2,2′-Oxybis(methylene)difuran.
![[thin space (1/6-em)]](https://www.rsc.org/images/entities/char_2009.gif) :
:![[thin space (1/6-em)]](https://www.rsc.org/images/entities/char_2009.gif) substrate = 1
substrate = 1![[thin space (1/6-em)]](https://www.rsc.org/images/entities/char_2009.gif) :
:![[thin space (1/6-em)]](https://www.rsc.org/images/entities/char_2009.gif) 40, temperature = 80 °C, PH2 = 1 MPa.
40, temperature = 80 °C, PH2 = 1 MPa.![[thin space (1/6-em)]](https://www.rsc.org/images/entities/char_2009.gif) :
:![[thin space (1/6-em)]](https://www.rsc.org/images/entities/char_2009.gif) 0.12CTAB
0.12CTAB![[thin space (1/6-em)]](https://www.rsc.org/images/entities/char_2009.gif) :
:![[thin space (1/6-em)]](https://www.rsc.org/images/entities/char_2009.gif) xAl or Ti
xAl or Ti![[thin space (1/6-em)]](https://www.rsc.org/images/entities/char_2009.gif) :
:![[thin space (1/6-em)]](https://www.rsc.org/images/entities/char_2009.gif) 0.5NaOH
0.5NaOH![[thin space (1/6-em)]](https://www.rsc.org/images/entities/char_2009.gif) :
:![[thin space (1/6-em)]](https://www.rsc.org/images/entities/char_2009.gif) PtO
PtO![[thin space (1/6-em)]](https://www.rsc.org/images/entities/char_2009.gif) :
:![[thin space (1/6-em)]](https://www.rsc.org/images/entities/char_2009.gif) 118H2O, where, x can be varied from 0.25 to 0.01 was obtained by the step-wise addition of all the components (CTAB + H2O + NaOH → Pt solution of desired concentration → SiO2) with continuous stirring, subjected to hydrothermal treatment for 48 h at 140 °C in an autoclave. After that the autoclave was cooled at room temperature, the solid product was filtered, washed with deionised water and dried at 60 °C. Calcination of the sample was carried out at 550 °C in air for 8 h to remove the template. In each case metal content was ∼5 wt%. Detail of the catalyst characterisation is in the ESI Section.†
118H2O, where, x can be varied from 0.25 to 0.01 was obtained by the step-wise addition of all the components (CTAB + H2O + NaOH → Pt solution of desired concentration → SiO2) with continuous stirring, subjected to hydrothermal treatment for 48 h at 140 °C in an autoclave. After that the autoclave was cooled at room temperature, the solid product was filtered, washed with deionised water and dried at 60 °C. Calcination of the sample was carried out at 550 °C in air for 8 h to remove the template. In each case metal content was ∼5 wt%. Detail of the catalyst characterisation is in the ESI Section.†
![[thin space (1/6-em)]](https://www.rsc.org/images/entities/char_2009.gif) 000 steps or 50 ps and every 250 steps the frames were saved followed by the analysis of the mean square displacement (MSD) of the targeted molecule in the presence and in the absence of CO2. Mean square displacement (MSD) analysis is a technique which determines the mode of displacement of particles followed over time. In particular, it can help to determine whether the particle is freely diffusing, transported, or bound. In addition MSD analysis can derive an estimate of the parameters of movement, such as the diffusion coefficient for freely diffusing particles. The MSD can be obtained directly from the particle positions in a molecular dynamics simulation. If r(t) is the position at time t, and r(t + Δt) the position an interval Δt later, the squared displacement of the particle during that interval is (r(t + Δt) − r(t))2. The increase of MSD with time is related to the diffusion coefficient D:
000 steps or 50 ps and every 250 steps the frames were saved followed by the analysis of the mean square displacement (MSD) of the targeted molecule in the presence and in the absence of CO2. Mean square displacement (MSD) analysis is a technique which determines the mode of displacement of particles followed over time. In particular, it can help to determine whether the particle is freely diffusing, transported, or bound. In addition MSD analysis can derive an estimate of the parameters of movement, such as the diffusion coefficient for freely diffusing particles. The MSD can be obtained directly from the particle positions in a molecular dynamics simulation. If r(t) is the position at time t, and r(t + Δt) the position an interval Δt later, the squared displacement of the particle during that interval is (r(t + Δt) − r(t))2. The increase of MSD with time is related to the diffusion coefficient D:


