 Open Access Article
Creative Commons Attribution 3.0 Unported Licence
High-pressure synthesis and electrochemical properties of tetragonal LiMnO2†
Takeshi Uyama *a,
Kazuhiko Mukai
 a and
Ikuya Yamada
 b
b
aToyota Central Research and Development Laboratories, Inc., Nagakute, Aichi 480-1192, Japan. E-mail: e1599@mosk.tytlabs.co.jp
bDepartment of Materials Science, Graduate School of Engineering, Osaka Prefecture University, 1-2 Gakuen, Sakai, Osaka 599-8590, Japan
First published on 24th July 2018
Abstract
Tetragonal structured LiMnO2 (t-LiMnO2) samples were synthesized under pressures above 8 GPa and investigated as a positive electrode material for lithium-ion batteries. Rietveld analyses based on X-ray diffraction measurements indicated that t-LiMnO2 belongs to a γ-LiFeO2-type crystal structure with the I41/amd space group. The charge capacity during the initial cycle was 37 mA h g−1 at 25 °C, but improved to 185 mA h g−1 at 40 °C with an average voltage of 4.56 V vs. Li+/Li. This demonstrated the superiority of t-LiMnO2 over other lithium manganese oxides in terms of energy density. The X-ray diffraction measurements and Raman spectroscopy of cycled t-LiMnO2 indicated an irreversible transformation from the γ-LiFeO2-type structure into a LixMn2O4 spinel structure by the displacement of 25% of the Mn ions to vacant octahedral sites through adjacent octahedral sites.
Introduction
Lithium manganese oxides (LMOs) have been extensively studied as a potential positive electrode material for lithium-ion batteries (LIBs), due to their low cost and environmental friendliness.1–6 Since such properties are crucial for large-scale applications for LIBs such as electric vehicles and grid energy storage systems,7 research efforts have been devoted to the development of LMOs with high energy densities (Ws). Table 1 summarizes the structure types, synthesis methods, and electrochemical properties of previously reported LMOs, and their crystal structures are shown issn Fig. 1a–g. Of these LMOs, a cubic spinel-structured LiMn2O4 (Fig. 1a) is widely accepted as the most practical positive electrode material.1,2,8 LiMn2O4 exhibits a rechargeable capacity (Qrecha) of approximately 120 mA h g−1 with an average voltage (Eave) of 4.1 V vs. Li+/Li, and its W approaches the theoretical limit value due to the moderate theoretical capacity (Qtheo) of 148 mA h g−1.| Compounds | Structure types (space group) | Synthesis methods | Qtheoa/mA h g−1 | Electrochemical properties | Remarks | References |
|---|---|---|---|---|---|---|
| a Theoretical capacity (Qtheo) is calculated assuming that a charge-transfer number is n. | ||||||
| LiMn2O4 | Cubic spinel (Fd![[3 with combining macron]](https://www.rsc.org/images/entities/char_0033_0304.gif) m) m) |
Solid-state reaction | 148 (n = 1) | Qrecha ∼ 120 mA h g−1, Eave ∼ 4.1 V | 1, 2 and 8 | |
| Li2MnO3 (Li[Li1/3Mn2/3]O2) | Monoclinic layer (C2/m) | Solid-state reaction | 459 (n = 2) | Qrecha ∼ 0 mA h g−1 | Electrochemically inactive | 9 and 10 |
| o-LiMnO2 | β-NaMnO2 (Pmmn) | Solid-state reaction | 285 (n = 1) | Qcha = 180–230 mA h g−1, Eave ∼3.6 V (first charge only) | Transformation into spinel phase on the charge reaction | 12–18 |
| m-LiMnO2 | α-NaMnO2 (C2/m) | Ion exchange method | 285 (n = 1) | Qcha = 270 mA h g−1, Eave ∼ 3.8 V (first charge only) | Transformation into spinel phase on the charge reaction | 4 and 19 |
| Li2/3[Li1/6Mn5/6]O2 | O2-type layer (P3m1) | Ion exchange method | 193 (n = 2/3) | Qrecha = 150 mA h g−1, Eave ∼ 3.2 V | Decrease of the Qrecha in a full cell | 20 |
| Lip[Li1/4Mn3/4]O2 (p < 1) | O2-type layer (P63mc) | Ion exchange method | <327 (n < 1) | Qrecha = 200 mA h g−1, Eave ∼ 3.2 V | Decrease of the Qrecha in a full cell | 21 |
| t-LiMnO2 | γ-LiFeO2 (I41/amd) | High-pressure and high-temperature method | 285 (n = 1) | Unknown | This work | |
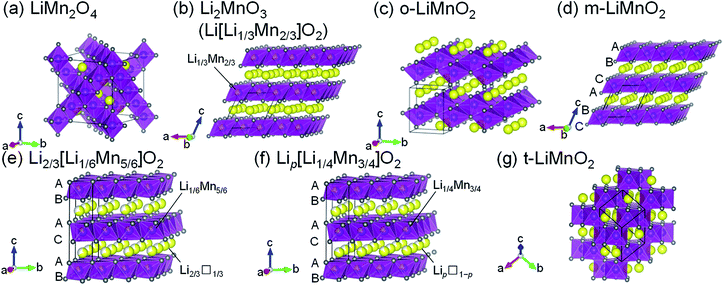 | ||
| Fig. 1 Crystal structures of seven lithium manganese oxides: (a) LiMn2O4, (b) Li2MnO3 (Li[Li1/3Mn2/3]O2), (c) o-LiMnO2, (d) m-LiMnO2, (e) Li2/3[Li1/6Mn5/6]O2, (f) Lip[Li1/4Mn3/4]O2, and (g) t-LiMnO2. Yellow, purple, and gray spheres indicate Li, Mn, and O atoms, respectively. Unit cells are shown by the solid black lines. The oxygen stacking manner is shown in Fig. 1d–f. | ||
In terms of the Qtheo, LiMnO2 and its derivatives are appealing, and their structural and electrochemical properties vary depending on their composition and method of synthesis. A monoclinic layered Li2MnO3, also written as Li[Li1/3Mn2/3]O2 (Fig. 1b), has a large Qtheo of 458 mA h g−1. However, Li2MnO3 is essentially electrochemically inactive because of the difficulty in further oxidizing the Mn4+ species,9 unless a proton exchange10 and/or an oxygen loss11 in its lattice proceed during the initial charge reaction. An orthorhombic LiMnO2 (o-LiMnO2)12–18 and a monoclinic LiMnO2 (m-LiMnO2)4,19 have a formal oxidation state of Mn3+ (Fig. 1c and d) and their charge capacities (Qchas) reach a maximum of 230 mA h g−1 for o-LiMnO2 and 270 mA h g−1 for m-LiMnO2. However, delithiated o- and m-LiMnO2 can be irreversibly and spontaneously transformed into a LixMn2O4 spinel; thus, the Qrecha values for both of these compounds decrease in a manner similar to that seen in LiMn2O4 as the changes in the charge and discharge curves echo those of LixMn2O4.12,15–19 In contrast, O2-type layered Li2/3[Li1/6Mn5/6]O2 (ref. 20) and Lip[Li1/4Mn3/4]O2 with p < 1 (ref. 21) (Fig. 1e and f) were reported to display good cycleability without transformation into the LixMn2O4 spinel. The oxygen stacking, which is ABACAB for Li2/3[Li1/6Mn5/6]O2 and Lip[Li1/4Mn3/4]O2 (unlike the ABCABC stacking seen in m-LiMnO2), plays an important role in this. As a result, the Qrecha is 150 mA h g−1 for Li2/3[Li1/6Mn5/6]O2 and 200 mA h g−1 for Lip[Li1/4Mn3/4]O2. In the initial cycle, the Qcha ranges between 20 and 50 mA h g−1, and is smaller than the Qrecha due to lithium deficiency in these compounds. This triggers a decrease in the Qrecha whenever these compounds are used in full cells with negative electrode materials that do not contain residual lithium, e.g. graphite and silicon.
Sugiyama et al. synthesized a tetragonal LiMnO2 (t-LiMnO2) from o-LiMnO2 by a high-pressure and high-temperature method, with pressures between 4 and 6 GPa and temperatures between 900 and 1200 °C.22 Rietveld analyses based on X-ray diffraction (XRD) measurements showed that t-LiMnO2 has a γ-LiFeO2-type structure with I41/amd space group (Fig. 1g). In this structure, MnO6 octahedra form a three-dimensional framework by sharing their edges, resulting in a straight channel of Li+ ions along the [111] direction. This configuration between MnO6 octahedra and Li+ ions is clearly different from the framework composed of two-dimensional MnO6 layers in the LiMnO2-based compounds mentioned above (see Fig. 1b–f); rather, the crystal structure of t-LiMnO2 is comparable to that of LiMn2O4. Therefore, in addition to the high Qtheo (285 mA h g−1), t-LiMnO2 is also a desirable material for understanding the relationships between the structural and electrochemical properties in a group of LMOs.
Despite its unique crystallographic character, the electrochemical properties of t-LiMnO2 remain unclear. This is likely due to the difficulty in conducting large-scale synthesis via the high-pressure method because a tiny sample container is generally used to generate high pressure (>10 GPa).23 However, recent technological developments, including the use of belt-type and multi-anvil-type equipment, enabled us to evaluate a variety of functional materials.24–27 In the current study, we synthesized t-LiMnO2 under high pressures up to 12 GPa and reported its electrochemical performance as a positive electrode material for LIBs for the first time, in order to clarify the relationship between the structural and electrochemical properties of t-LiMnO2. The Qcha of t-LiMnO2 reached 185 mA h g−1 with an Eave of 4.56 V upon increasing the operating temperature to 40 °C, which is superior to other LMOs. This information will be helpful in designing advanced LMOs with high W in terms of their structure and composition.
Experimental
Sample preparations
t-LiMnO2 was synthesized from o-LiMnO2 by the high-pressure and high-temperature method using a Walker-type apparatus.28 o-LiMnO2 was first synthesized via solid-state reactions. Stoichiometric amounts of LiOH·H2O (Wako Pure Chemical Industries Ltd.) and Mn2O3 (Wako Pure Chemical Industries Ltd.) were mixed in ethanol and the mixture was dried and pressed into a 5 mm-thick pellet with a diameter of 15 mm. The pellet was heated at 1000 °C for 12 h under argon gas flow at a heating rate of 200 °C h−1 and a cooling rate of 1 °C min−1. The obtained o-LiMnO2 was crushed and re-pressed into a 5 mm-thick pellet with a diameter of 2.8 mm before being packed into a platinum capsule. The capsule was then placed in a BN insulation sleeve, which was placed in a cylindrical graphite heater. The assembled sample was placed in a (Mg, Co)O octahedral pressure medium with side lengths of 14 mm. The (Mg, Co)O octahedra were slowly compressed to 5, 8, or 12 GPa by eight tungsten carbide truncated 8 mm edges. The compressed samples were then heated at 1000 °C for 30 min and subsequently quenched to room temperature, and the pressure was slowly released until an ambient pressure was achieved. Hereafter, the o-LiMnO2 samples treated at 5, 8, and 12 GPa are represented as LMO (5 GPa), LMO (8 GPa), and LMO (12 GPa), respectively, to avoid a misunderstanding of the actual phase purity. A powder sample of LiMn2O4 was also synthesized by heating a mixture of LiOH·H2O and MnO2 (Kojundo Chemical Laboratory Co., Ltd.) at 1000 °C for 12 h under oxygen gas flow.Characterization of the samples
The powder samples of o-LiMnO2, LMO (5 GPa), LMO (8 GPa), and LMO (12 GPa) were characterized by scanning electron microscopy (SEM), synchrotron XRD measurements, and Raman spectroscopy. The SEM images were recorded using an S-3600N (Hitachi High-Technologies, Company Ltd.) at an accelerating voltage of 15 kV. The XRD measurements were conducted at a BL5S2 beamline available at the Aichi Synchrotron Radiation Center. The samples were packed into borosilicate glass capillary tubes with a diameter of 0.3 mm (WJM-Glas Müller GmbH). The XRD patterns were collected using a two-dimensional detector, PILATUS 100K (Dectris Ltd., Baden-Daettwil), over a 2θ range between 5° and 95°. The incident X-ray wavelength (λ) was determined to be 0.799323(2) or 0.799670(2) Å from the XRD patterns of silicon powders (NIST 640d). Rietveld analyses and drawings of crystal structures were carried out using the RIETAN-FP29 and VESTA softwares,30 respectively. The Raman spectra were collected on an NRS-3300 (Jasco Co. Ltd.) using an excitation laser wavelength of 532 nm and a laser power of 0.1 mW. The duration of exposure was 600 s.Electrochemical properties
The electrochemical reactivities of the o-LiMnO2, LMO (5 GPa), LMO (8 GPa), and LMO (12 GPa) samples were examined with sandwich-type two-electrode cells. The powdered sample, acetylene black (AB, Denka Co., Ltd.), and polytetrafluoroethylene (PTFE, Daikin Industries Ltd.) were combined in a ratio of 70![[thin space (1/6-em)]](https://www.rsc.org/images/entities/char_2009.gif) :
:![[thin space (1/6-em)]](https://www.rsc.org/images/entities/char_2009.gif) 20
20![[thin space (1/6-em)]](https://www.rsc.org/images/entities/char_2009.gif) :
:![[thin space (1/6-em)]](https://www.rsc.org/images/entities/char_2009.gif) 10 to give a viscoelastic mixture, which was then pressed onto an aluminum mesh current collector with a diameter of 16 mm. The mixture functioned as a working electrode. Lithium metal pressed onto 19 mm-wide stainless steel was used as a counter electrode. The electrolyte was made from a solution of 1 M LiPF6 dissolved in ethylene carbonate (EC)/dimethyl carbonate (DMC) at an EC
10 to give a viscoelastic mixture, which was then pressed onto an aluminum mesh current collector with a diameter of 16 mm. The mixture functioned as a working electrode. Lithium metal pressed onto 19 mm-wide stainless steel was used as a counter electrode. The electrolyte was made from a solution of 1 M LiPF6 dissolved in ethylene carbonate (EC)/dimethyl carbonate (DMC) at an EC![[thin space (1/6-em)]](https://www.rsc.org/images/entities/char_2009.gif) :
:![[thin space (1/6-em)]](https://www.rsc.org/images/entities/char_2009.gif) DMC ratio of 3
DMC ratio of 3![[thin space (1/6-em)]](https://www.rsc.org/images/entities/char_2009.gif) :
:![[thin space (1/6-em)]](https://www.rsc.org/images/entities/char_2009.gif) 7 v/v (Kishida Chemical Company Ltd.) and the separator was constructed from two sheets of porous polyethylene membrane (Tonen-General Sekiyu K. K.). The cells were assembled in an argon-filled glove box and operated at a current density of 0.025 mA cm−2. The voltage ranged from 1.8 to 4.8 V and the operating temperature was set at 25 or 40 °C.
7 v/v (Kishida Chemical Company Ltd.) and the separator was constructed from two sheets of porous polyethylene membrane (Tonen-General Sekiyu K. K.). The cells were assembled in an argon-filled glove box and operated at a current density of 0.025 mA cm−2. The voltage ranged from 1.8 to 4.8 V and the operating temperature was set at 25 or 40 °C.
After cycling test at 25 °C, crystal structures of the samples were investigated using synchrotron XRD and Raman measurements to clarify both macroscopic and microscopic structural changes during the cycling. The cells were charged and discharged twenty times at 25 °C. The cycled samples were then taken from the working electrodes, which had been thoroughly rinsed with a diethyl carbonate solution. Each of the samples was packed into a capillary tube with a diameter of 0.7 mm and put into a quartz glass cell (GL Sciences Inc.) for the XRD measurements and for the Raman spectroscopy, respectively. All the procedures were conducted in the argon-filled glove box, so as not to contact with the atmosphere. The laser power of the Raman spectroscopy was set at 1.0 mW in consideration of absorbance of the quartz cell. The Raman spectra of the charged LMO (12 GPa) sample, LiMn2O4, PTFE, and AB were also measured.
Results and discussion
Morphological and structural characterization
Fig. 2a–d show SEM images for the o-LiMnO2, LMO (5 GPa), LMO (8 GPa), and LMO (12 GPa) samples, respectively. Particles of o-LiMnO2 exhibit flake-like shapes with widths between 2–10 μm and thicknesses less than 2 μm. The particle shapes appear to round out and become uniform in size with increasing applied pressure, i.e., rough shapes with a dispersive size of 1–10 μm at 5 GPa and smooth morphologies with a dominant size of ∼8 μm at 8 GPa and 12 GPa were observed. This morphological change is likely due to a phase transformation, as will be discussed below.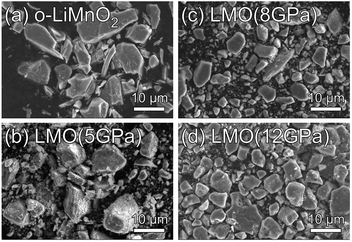 | ||
| Fig. 2 SEM images for the (a) o-LiMnO2, (b) LMO (5 GPa), (c) LMO (8 GPa), and (d) LMO (12 GPa) samples. | ||
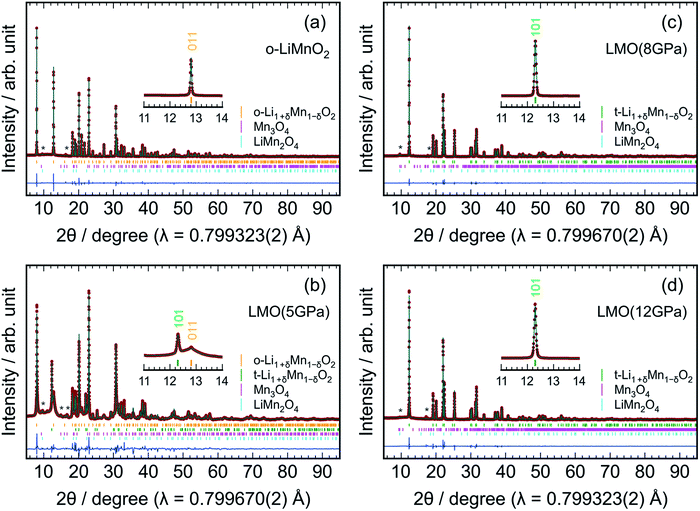
Fig. 3 shows the results of Rietveld analyses for the (a) o-LiMnO2, (b) LMO (5 GPa), (c) LMO (8 GPa), and (d) LMO (12 GPa) samples. The crystal structure of the o-LiMnO2 sample was assigned as an orthorhombic β-NaMnO2-type structure with Pmmn space group; that is, a zigzag layered structure in which Li and Mn atoms occupy each of the octahedral 2b sites (Fig. 1c). However, the o-LiMnO2 sample is not in a single phase but contained some impurity phases as shown by asterisk marks at around 2θ = 10° and 16°, and these were found to be hausmannite (Mn3O4 with I41/amd space group) and spinel LiMn2O4 by examining the possible crystal structures of LMOs and manganese oxides. Thus, we performed Rietveld analyses with three coexisting phases, in which a Mn under-stoichiometric Li1+δMn1−δO2 is adopted to refine the crystal structure of o-LiMnO2. Here, δ represents the Mn deficiency due to impurities. Moreover, we considered Li and Mn atoms to randomly occupy each of the 2b sites, as a cation mixing of Li and transition metal ions occasionally occurs in lithium insertion materials.31 The structure parameters of the o-LiMnO2 sample are listed in Table 2. The lattice parameters of o-LiMnO2 were calculated to be ao = 2.80700(2) Å, bo = 4.57721(2) Å, and co = 5.75210(3) Å. The actual composition was determined to be Li1.005Mn0.995O2 (δ = 0.005), where 1.5% of the Mn ions occupied Li (2b) sites. The weight fractions were 98.9 wt% for Li1.005Mn0.995O2, 0.7 wt% for Mn3O4, and 0.4 wt% for LiMn2O4, giving a Li/Mn ratio of 0.999/1.000, which was consistent with the Li/Mn ratio of the starting material.
| Phase | Space group | Atom | Wyckoff position | ga | x | y | za | Ba/Å2 |
|---|---|---|---|---|---|---|---|---|
| a Constraints: g(Mn1) = 1 − g(Li1), g(Mn2) = g(Li1) − δ, g(Li2) = 1 + δ − g(Li1), z(Mn1) = z(Li1), z(Li2) = z(Mn2), B(Mn1) = B(Li1), B(Li2) = B(Mn2), and B(O2) = B(O1). | ||||||||
| o-LiMnO2 | Pmmn | Li1 | 2b | 0.985(1) | 1/4 | 3/4 | 0.1188(9) | 1.32(8) |
| Mn1 | 2b | 0.015(1) | 1/4 | 3/4 | 0.1188(9) | 1.32(8) | ||
| Mn2 | 2b | 0.980(1) | 1/4 | 3/4 | 0.6347(1) | 0.55(1) | ||
| Li2 | 2b | 0.020(1) | 1/4 | 3/4 | 0.6347(1) | 0.55(1) | ||
| O1 | 2a | 1 | 1/4 | 1/4 | 0.1432(3) | 0.58(2) | ||
| O2 | 2a | 1 | 1/4 | 1/4 | 0.6004(3) | 0.58(2) | ||
| Composition: Li1.005Mn0.995O2 (δ = 0.005), ao = 2.80700(2) Å, bo = 4.57721(2) Å, and co = 5.75210(3) Å | ||||||||
| Reliable factors: Rwp = 5.658%, Rp = 4.184%, and S = 0.4501 | ||||||||
| Mass fractions: 98.9 wt% for o-LiMnO2, 0.7 wt% for Mn3O4, and 0.4 wt% for LiMn2O4 | ||||||||
For the LMO (5 GPa) sample, the diffraction line at 2θ = 12.8° decreases, but the diffraction line at 2θ = 12.3° clearly generates, due to the formation of the t-LiMnO2 phase (see the inset of Fig. 3b). As listed in Table S1,† the mass fractions of o-LiMnO2 and t-LiMnO2 were found to be 86.6 and 8.6 wt%, respectively. For the LMO (8 GPa) and LMO (12 GPa) samples, the diffraction line at 2θ = 12.8° disappears, and almost all diffraction lines can be assigned as the tetragonal γ-LiFeO2-type structure with I41/amd space group (Fig. 3c and d). The hausmannite impurity also transformed into a CaMn2O4-type structure (Pbcm) with an applied pressure up to 8 GPa.32 Table 3 shows the structure parameters of the LMO (12 GPa) sample as determined by Rietveld analyses under identical assumptions as the o-LiMnO2 sample. The tetragonal lattice parameters, at and ct, were determined to be 4.18278(2) and 8.22922(6) Å, respectively. Note that the actual composition of t-LiMnO2, Li1.012Mn0.988O2 (δ = 0.012), was almost identical to that of o-LiMnO2. From the occupancy factor, g, it was shown that Mn ions occupy 0.8% of the Li (4a) sites. As shown in Table S3,† there were no significant differences in the structural parameters, including the at, ct, composition, atomic coordination, and g between the LMO (8 GPa) and LMO (12 GPa) samples.
| Phase | Space group | Atom | Wyckoff position | ga | x | y | z | Ba/Å2 |
|---|---|---|---|---|---|---|---|---|
| a Constraints: g(Mn1) = 1 − g(Li1), g(Mn2) = g(Li1) − δ, g(Li2) = 1 + δ − g(Li1), B(Mn1) = B(Li1), and B(Li2) = B(Mn2). | ||||||||
| t-LiMnO2 | I41/amd | Li1 | 4a | 0.992(1) | 0 | 3/4 | 1/8 | 1.31(9) |
| Mn1 | 4a | 0.008(1) | 0 | 3/4 | 1/8 | 1.31(9) | ||
| Mn2 | 4b | 0.980(1) | 0 | 1/4 | 3/8 | 0.51(1) | ||
| Li2 | 4b | 0.020(1) | 0 | 1/4 | 3/8 | 0.51(1) | ||
| O1 | 8e | 1 | 0 | 1/4 | 0.1413(1) | 1.2(2) | ||
| Composition: Li1.012Mn0.988O2 (δ = 0.012), at = 4.18278(2) Å, and ct = 8.22922(6) Å | ||||||||
| Reliable factors: Rwp = 6.403%, Rp = 4.544%, and S = 0.4712 | ||||||||
| Mass fractions: 97.8 wt% for t-LiMnO2, 1.8 wt% for Mn3O4, and 0.4 wt% for LiMn2O4 | ||||||||
The change in the XRD patterns indicated that o-LiMnO2 gradually transformed into t-LiMnO2 at 5 GPa, with the phase transformation occurring as the pressure reached 8 GPa. Conversely, Sugiyama et al. reported that this phase transformation was completed at a pressure of 5 GPa in Mn over-stoichiometric Li0.93Mn1.07O2.22 Therefore, the transformation from o-LiMnO2 to t-LiMnO2 is very sensitive to the Li/Mn ratio of o-LiMnO2; Mn under-stoichiometric Li1.1Mn0.9O2 (δ = 0.1) actually transformed into a rock-salt structure rather than into t-LiMnO2 at 5 GPa and 1000 °C.22
Fig. 4a–d show Raman spectra of the o-LiMnO2, LMO (5 GPa), LMO (8 GPa), and LMO (12 GPa) samples, respectively. Factor group analyses33 predicted twelve Raman bands of 4Ag + 4B2g + 4B3g for o-LiMnO2 structure and eight Raman bands of A1g + 3B1g + 4Eg for t-LiMnO2 structure. The Raman spectrum for the o-LiMnO2 sample shows three major Raman bands at 411, 556, and 657 cm−1 and three minor Raman bands at 191, 363, and 488 cm−1. Although all of the Raman bands are not fully assigned, according to the previous reports,34–36 the major Raman bands are attributed to vibrations in the MnO6 octahedra, that is, the O–Mn–O stretching modes at 657 cm−1, the O–Mn–O bending modes at 556 cm−1, and the Mn–O–Mn deformation modes at 441 cm−1. The Raman spectrum of the LMO (5 GPa) sample is similar with that of the o-LiMnO2 sample, however, the intensities of the Raman bands at ∼411, 556, and 657 cm−1 become weak compared with its original Raman spectrum. Furthermore, new and weak Raman bands are observed at 406, 510, and 617 cm−1, and these Raman bands are clearly observed in the Raman spectra of the LMO (8 GPa) and LMO (12 GPa) samples. There are at least ten Raman bands in the Raman spectrum of the LMO (12 GPa) sample, although the theoretical calculation predicted eight Raman bands. This difference is probably due to the nonstoichiometry and/or impurity phases in the LMO (12 GPa) sample. Anyway Raman spectroscopy clarified that the transformation from o-LiMnO2 to t-LiMnO2 is achieved under pressures above 8 GPa, which is consistent with the results of the XRD measurements.
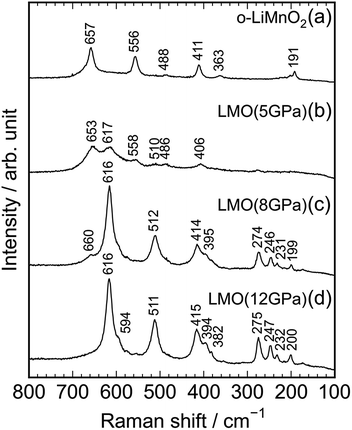 | ||
| Fig. 4 Raman spectra of the (a) o-LiMnO2, (b) LMO (5 GPa), (c) LMO (8 GPa), and (d) LMO (12 GPa) samples. | ||
Electrochemical properties
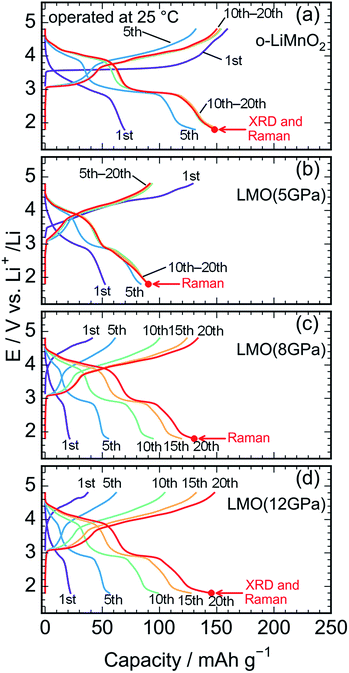
Fig. 5a shows charge and discharge curves of the Li cell with the LiMnO2 sample, operated at temperature of 25 °C. The cell voltage (E) increases rapidly from an open circuit voltage (∼3.1 V) before plateauing at ∼3.5 V when the Qcha reaches 120 mA h g−1. Then, the E climbs to 4.8 V with a gentle gradient during the initial charge. In the discharge curve, however, the E drops sharply to 3.5 V, and gradually decreases to ∼3.0 V without any clear voltage plateaus. The Qcha is 160 mA h g−1, whereas discharge capacity (Qdis) is only 70 mA h g−1. New voltage plateaus appeared at ∼3.0 and 4.0 V in subsequent charge and discharge curves. The differences in charge and discharge curves between 1st and subsequent cycles is caused by an irreversible structural transformation to the LixMn2O4 spinel during the initial cycle, as previously reported.12,18,37Fig. 5b–d display the charge and discharge curves of the lithium cells with the LMO (5 GPa), LMO (8 GPa), and LMO (12 GPa) samples, respectively. The charge and discharge curves of these three samples are clearly different from those of o-LiMnO2; i.e., the E monotonically increases from 3.2 V to 4.8 V without any apparent voltage plateaus. The Qcha of LMO (5 GPa) is 154 mA h g−1, while the Qcha values of LMO (8 GPa) and LMO (12 GPa) are 41 and 37 mA h g−1, respectively, which are approximately 13% of the Qtheo. The initial discharge curves have a similar E profile with a broad center at ∼3.0 V. The Qdis values of the LMO (5 GPa), LMO (8 GPa), and LMO (12 GPa) samples are 52, 21, and 22 mA h g−1, respectively. Besides the decline in the E, as similarly noted for o-LiMnO2, both the charge and discharge curves display multiple voltage plateaus with an increasing cycle number. This implied that t-LiMnO2 irreversibly transformed into the LixMn2O4 spinel with the electrochemical cycling. The cycle performances of these four samples are given in Fig. S1.† The Qcha and Qdis values of o-LiMnO2 [LMO (5 GPa)] increase with the cycle numbers until tenth cycles, and then maintain at ∼150 (100) mA h g−1. On the other hand, the Qcha and Qdis values of LMO (8 GPa) and LMO (12 GPa) increase with the cycle numbers up to twenty cycles. The Qcha and Qdis values of LMO (12 GPa) are similar with those of o-LiMnO2.
Fig. 6a and b show charge and discharge curves of the lithium cells with the o-LiMnO2 and LMO (12 GPa) samples, respectively, operated at temperature of 40 °C. The initial Qcha of o-LiMnO2 is approximately 200 mA h g−1, which is larger than the value (=160 mA h g−1) obtained at 25 °C. This originates from the appearance of a moderate voltage plateau over 4.0 V with a Qcha of ∼50 mA h g−1, as reported for an o-LiMnO2/Li cell at 55 °C by Cho.38 Subsequent charge and discharge curves reveal the increases in Qcha from 200 mA h g−1 to 225 mA h g−1 and in Qdis from 155 mA h g−1 to 220 mA h g−1. The irreversible transformation into the LixMn2O4 spinel is thought to be accelerated, compared to the measurements at 25 °C.
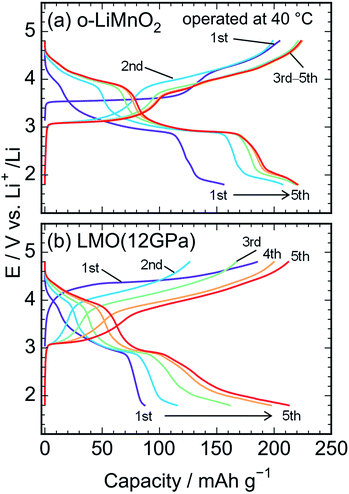 | ||
| Fig. 6 Charge and discharge curves of the lithium cells with the (a) o-LiMnO2 and (b) LMO (12 GPa) samples. The cells were operated at temperature of 40 °C. | ||
The E of LMO (12 GPa) slowly increases from an open circuit voltage of approximately 3.0 V to ∼4.4 V with a Qcha of ∼40 mA h g−1 during the initial charge. Afterwards, the E remains flat until finally reaching the cut-off voltage of 4.8 V. In contrast to the situation observed at 25 °C, the Qcha increases dramatically to 185 mA h g−1, in comparison to the Qtheo of 65%. The redox reaction at approximately 4.4 V is not observed in LMO (5 GPa), whereas it is clearly seen in the LMO (8 GPa) (see Fig. S2a and b†). According to the first-principle calculations and numerical simulations reported by Ceder's group,39–42 the Li+ ion diffusion barrier for γ-LiFeO2-type structured materials is higher than that for other positive electrode materials such as LiCoO2 with an α-NaFeO2-type structure and LiMn2O4 with a spinel-type structure. Moreover, the Mn ions that occupied 0.8% of the 4a lithium sites (Table 3) would block the lithium diffusion path at 25 °C, as reported for LiFePO4, which has a one-dimensional lithium ion path along the b axis.43 Therefore, by increasing the temperature up to 40 °C, Li+ ions could be kinetically removed from the lattice during the initial charge reaction. Moreover, the initial charge curve exhibited an Eave of 4.56 V, indicating that the Mn3+/Mn4+ redox potential in t-LiMnO2 was superior to that of o-LiMnO2 (Eave = 3.86 V). Since the W for positive electrode materials is calculated as a product of the Qrecha and Eave, the W for t-LiMnO2 during the initial charge was estimated to be 844 mW h g−1 using a Qcha = 185 mA h g−1 and Eave = 4.56 V. This value was much larger than the W for LiMn2O4 (∼500 mW h g−1) which is already commercially available as the positive electrode material.8 A high Eave is favorable for the potential application of t-LiMnO2 in this field.
The initial discharge curve, by contrast, could not maintain this Eave and exhibited a Qdis of 87 mA h g−1, resulting in a W value of 273 mW h g−1. This was due to the type of polarization, which was similar to that seen in the results obtained at 25 °C. With an increasing cycle number, the Qcha and Qdis improved to approximately 210 mA h g−1. Nevertheless, the Eave was about 2.9 V at discharge and 4.0 V at charge over the course of more than two cycles. The W in the charge and discharge curves during the fifth cycle was 815 mW h g−1 and 618 mW h g−1, respectively.
Crystal structure change upon electrochemical cycling
Ex situ XRD measurements and Raman spectroscopy were conducted on the cycled electrodes to understand the phase transformation of t-LiMnO2 during cycling. The XRD patterns of the cycled o-LiMnO2 and LMO (12 GPa) samples are shown in Fig. 7a and b, respectively. The XRD pattern of o-LiMnO2 is assigned as a mixture of the LixMn2O4 spinel (Fd![[3 with combining macron]](https://www.rsc.org/images/entities/char_0033_0304.gif) m) with x < 1, lithiated LiyMn2O4 tetragonal (I41/amd) phase with y > 1, and PTFE originated from the binder in the electrode. The lattice parameters, which were calculated using the least squares method with more than five non-overlapping diffraction lines, are found to be ac = 8.224(9) Å for LixMn2O4, and at = 5.666(6) Å and ct = 9.151(9) Å for LiyMn2O4. Since these lattice parameters correspond to those for Li0.98Mn2O4 (ac = 8.230 Å) and Li1.82Mn2O4 (at = 5.654 Å and ct = 9.202 Å),44 the x and y values are estimated to be 0.98 and 1.82, respectively.
m) with x < 1, lithiated LiyMn2O4 tetragonal (I41/amd) phase with y > 1, and PTFE originated from the binder in the electrode. The lattice parameters, which were calculated using the least squares method with more than five non-overlapping diffraction lines, are found to be ac = 8.224(9) Å for LixMn2O4, and at = 5.666(6) Å and ct = 9.151(9) Å for LiyMn2O4. Since these lattice parameters correspond to those for Li0.98Mn2O4 (ac = 8.230 Å) and Li1.82Mn2O4 (at = 5.654 Å and ct = 9.202 Å),44 the x and y values are estimated to be 0.98 and 1.82, respectively.
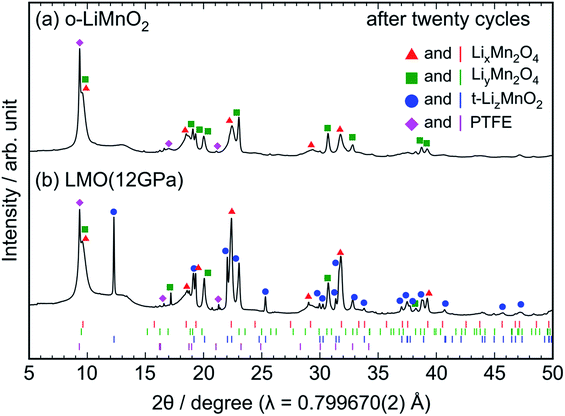 | ||
| Fig. 7 Ex situ XRD patterns of the cycled (a) o-LiMnO2 and (b) LMO (12 GPa) samples. The measurements were performed at the discharged states, as indicated by the red arrows in Fig. 5a and d. Diffraction lines represented by red triangles, green squares, blue circles, and magenta diamonds, originate from those from LixMn2O4 with the spinel structure, LiyMn2O4 with tetragonal structure, t-LizMnO2, and PTFE, respectively. The Bragg positions for each of these phases are also shown in the bottom using identically colored vertical lines. | ||
As seen in Fig. 7b, the XRD pattern of the cycled LMO (12 GPa) sample is assigned as a mixture of the LixMn2O4 spinel, the LiyMn2O4 tetragonal, t-LizMnO2, and PTFE. The evolution of the LixMn2O4 spinel and LiyMn2O4 tetragonal phases confirms the transformation to the spinel structure from t-LiMnO2 during cycling, as in the case for o-LiMnO2. The lattice parameters were calculated to be ac = 8.252(4) Å for LixMn2O4, at = 5.657(4) Å and ct = 9.173(7) Å for LiyMn2O4, and at = 4.1854(8) Å and ct = 8.230(2) Å for t-LizMnO2. Thus, the x, y, and z values were estimated to be 0.98, 1.82, and ∼1, respectively.
As seen in Fig. S3,† the Raman spectrum of the charged LMO (12 GPa) sample is similar with that of the pristine LMO (12 GPa) sample, except for the Raman band at 654 cm−1. This indicates that the local structure of LMO (12 GPa) is maintained during the initial charge reaction. However, Fig. 8 clarifies that the extended twenty cycle test converts the t-LiMnO2 structure into the spinel structure. That is, there are only three broad Raman bands at ∼650, 620, and 490 cm−1 in the cycled o-LiMnO2 and LMO (12 GPa) samples, and these Raman spectra are similar with the Raman spectrum of the pristine LiMn2O4 sample. The Raman bands at ∼650, 620, and 490 cm−1 are also observed in the cycled LMO (5 GPa) and LMO (8 GPa) samples (see Fig. S4†). It should be noted that the Raman spectra of the cycled (or charged) o-LiMnO2, LMO (5 GPa), LMO (8 GPa), and LMO (12 GPa) samples contain contributions of PTFE and AB, which were used for preparing the working electrodes. As seen in Fig. S5,† the Raman spectrum of PTFE shows three major Raman bands at 733, 385, and 290 cm−1, while that of AB is featureless. The contributions of PTFE and AB are, hence, negligibly small to the Raman spectra of the cycled (or charged) LMO samples.
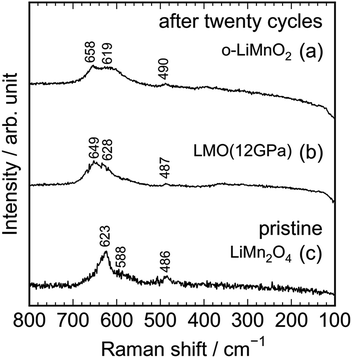 | ||
| Fig. 8 Ex situ Raman spectra of the cycled (a) o-LiMnO2 and (b) LMO (12 GPa) samples together with the Raman spectrum of the pristine (c) LiMn2O4. Raman spectra of (a) and (b) were taken at the discharged state, as indicated by the red arrows in Fig. 5a and d. | ||
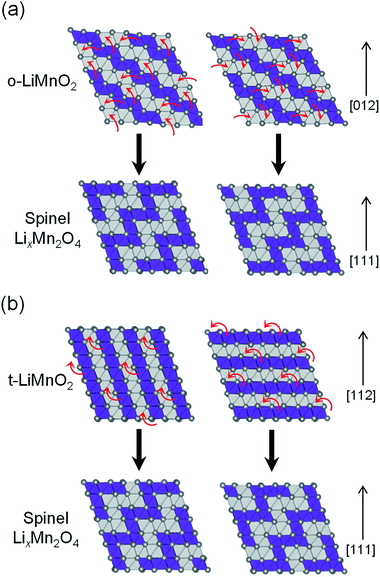
Fig. 9 shows possible mechanisms of the transformation into the spinel structure from the delithiated (a) o-LiMnO2 and (b) t-LiMnO2. Oxide ions in o-LiMnO2, t-LiMnO2, and LixMn2O4 spinel are arranged in the same ABCABC stacking manner along the [012] direction for o-LiMnO2, [112] for t-LiMnO2, and [111] for LixMn2O4, although the orderings between Mn and vacancy (or Li) octahedral sites are different each other. According to Thackeray et al.,15 LixMn2O4 is formed from two repeating types of MnO2 sheets, as shown in the left and right sides of Fig. 9. Thus, there are two ways for the transformation into the spinel from o-LiMnO2 or t-LiMnO2. In the case of o-LiMnO2, the transformation is caused by the displacement of half of the Mn ions to adjacent vacant octahedral sites.15–17 By contrast, the transformation of t-LiMnO2 is achieved by the displacement of a quarter of the Mn ions in the 4b sites into the vacant octahedral sites (4a) via adjacent octahedral sites without a rearrangement of the ABCABC oxygen packing (Fig. 9b). In this transformation, t-LiMnO2 has 50% lower amounts of migrated Mn ions, resulting in approximately twice longer in routes of Mn ions, compared to the case for o-LiMnO2.
The transformation mechanism of t-LiMnO2 shows that a suppression of the Mn displacement at the charged state is essential for realizing electrochemical properties such as the Qrecha, Eave, and W in the initial charge state over several cycles. Although the blocking effect of the movement of Mn ions in o-LiMnO2 has not been reported for the substitution of different cations with Li ions, a small amount of doping could be suitable for t-LiMnO2 due to the small amount of migrated Mn ions and their long displacement distance. Recently, electrochemical properties of tetragonal structured Li0.35MnO2 (ref. 45) and Li0.59MnO2 (ref. 46) nanoparticles were reported; i.e., the initial Qcha and Qdis values of the nanosized Li0.35MnO2 are 72.9 and 178.8 mA h g−1, respectively. The E profile is similar to the discharge curve of the LixMn2O4 spinel, although the crystal structure of Li0.35MnO2 is maintained even after twenty cycles.45 Since the electrochemical properties and structural stabilities of t-LiMnO2 differ from those of Li0.35MnO2 (ref. 45) (or Li0.59MnO2),47 both Li content (x) and particle size also play important roles in stabilizing structure during cycling.
Conclusions
We first investigated the electrochemical performances of t-LiMnO2 to obtain structural and electrochemical information regarding a series of LiMnO2 compounds with potential for the development of LMOs with high W. The t-LiMnO2 samples with γ-LiFeO2-type structure (I41/amd) were prepared from o-LiMnO2 under pressures up to 8 GPa and at a temperature of 1000 °C, as evident by XRD measurements and Raman spectroscopy. Rietveld analyses indicated that the actual composition of t-LiMnO2 is Li1.012Mn0.988O2, in which Mn ions partially occupy the 4a lithium sites. The Qcha of t-LiMnO2 rose to 185 mA h g−1 at 40 °C during the initial charge, even though it was only 37 mA h g−1 at 25 °C. Furthermore, the initial charge curve showed that the Eave (4.56 V) with Mn3+/Mn4+ redox was the highest among LMOs such as o-LiMnO2 and LiMn2O4. However, the initial discharge curve did not maintain the Eave, and exhibited a Qdis of 87 mA h g−1 due to an irreversible phase transformation into the LixMn2O4 spinel during the initial charge. Substitution of different cations and optimization of Li content and particle size will be necessary to maintain the electrochemical properties of t-LiMnO2 throughout long cycles.Conflicts of interest
There are no conflicts to declare.Acknowledgements
We appreciate Dr Yuichi Kato of TCRDL for help with Raman spectroscopy. The XRD measurements were conducted on the BL5S2 beamline of the Aichi Synchrotron Radiation Center, Aichi Science & Technology Foundation, Japan (Proposal No. 201702017 and No. 201706077).Notes and references
- M. M. Thackeray, W. I. F. David, P. G. Bruce and J. B. Goodenough, Mater. Res. Bull., 1983, 18, 461 CrossRef.
- M. M. Thackeray, P. J. Johnson, L. A. de Picciotto, P. G. Bruce and J. B. Goodenough, Mater. Res. Bull., 1984, 19, 179 CrossRef.
- M. M. Thackeray, S. H. Kang, C. S. Johnson, J. T. Vaughey, R. Benedek and S. A. Hackney, J. Mater. Chem., 2007, 17, 3053 RSC.
- A. R. Armstrong and P. G. Bruce, Nature, 1996, 381, 499 CrossRef.
- K. Yamaura, Q. Huang, L. Zhang, K. Takada, Y. Baba, T. Nagai, Y. Matsui, K. Kosuda and E. T. Muromachi, J. Am. Chem. Soc., 2006, 128, 9448 CrossRef PubMed.
- M. Freire, N. V. Kosova, C. Jordy, D. Chateigner, O. I. Lebedev, A. Maignan and V. Pralong, Nat. Mater., 2016, 15, 173 CrossRef PubMed.
- O. K. Park, Y. Cho, S. Lee, H.-C. Yoo, H.-K. Song and J. Cho, Energy Environ. Sci., 2011, 4, 1621 RSC.
- M. M. Thackeray, Prog. Solid State Chem., 1997, 25, 1 CrossRef.
- P. Kalyani, S. Chitra, T. Mohan and S. Gopukumar, J. Power Sources, 1999, 80, 103 CrossRef.
- A. D. Robertson and P. G. Bruce, Chem. Mater., 2003, 15, 1984 CrossRef.
- D. Y. W. Yu, K. Yanagida, Y. Kato and H. Nakamura, J. Electrochem. Soc., 2009, 156, A417 CrossRef.
- I. Koetschou, M. N. Richard, J. R. Dahn, J. B. Soupart and J. C. Rousche, J. Electrochem. Soc., 1995, 142, 2906 CrossRef.
- C.-H. Lu and H.-C. Wang, J. Eur. Ceram. Soc., 2004, 24, 717 CrossRef.
- Y.-I. Jang, B. Huang, H. Wang, D. R. Sadoway and Y.-M. Chiang, J. Electrochem. Soc., 1999, 146, 3217 CrossRef.
- R. J. Gummow, D. C. Liles and M. M. Thackeray, Mater. Res. Bull., 1993, 28, 1249 CrossRef.
- H. Wang, Y.-I. Jang and Y.-M. Chiang, Electrochem. Solid-State Lett., 1999, 2, 490 CrossRef.
- Y.-M. Chiang, H. Wang and Y.-I. Jang, Chem. Mater., 2001, 13, 53 CrossRef.
- L. Croguennec, P. Deniard and R. Brec, J. Electrochem. Soc., 1997, 144, 3323 CrossRef.
- P. G. Bruce, A. R. Armstrong and R. L. Gizendanner, J. Mater. Chem., 1999, 9, 193 RSC.
- J. M. Paulsen, C. L. Thomas and J. R. Dahn, J. Electrochem. Soc., 1999, 146, 3560 CrossRef.
- N. Yabuuchi, R. Hara, M. Kajiyama, K. Kubota, T. Ishigaki, A. Hoshikawa and S. Komaba, Adv. Energy Mater., 2014, 4, 1301453 CrossRef.
- J. Sugiyama, T. Noritake, T. Hioki, T. Itoh, T. Hosomi and H. Yamauchi, Mater. Sci. Eng., 2001, B84, 224 CrossRef.
- W. B. Holzapfel and N. S. Isaacs, High-Pressure Techniques in Chemistry and Physics, Oxford University Press, London, 1997 Search PubMed.
- P. F. McMillan, Nature, 2002, 1, 19 CrossRef PubMed.
- I. Yamada, H. Fujii, A. Takamatsu, H. Ikeno, K. Wada, H. Tsukasaki, S. Kawaguchi, S. Mori and S. Yagi, Adv. Mater., 2017, 29, 1603004 CrossRef PubMed.
- K. Mukai and I. Yamada, J. Electrochem. Soc., 2017, 164, A3590 CrossRef.
- I. Yamada, K. Tsuchida, K. Ohgushi, N. Hayashi, J. Kim, N. Tsuji, R. Takahashi, M. Matsushita, N. Nishiyama, T. Inoue, T. Irifune, K. Kato, M. Takata and M. Takano, Angew. Chem., Int. Ed., 2011, 50, 6579 CrossRef PubMed.
- D. Walker, M. A. Carpenter and C. M. Hitch, Am. Mineral., 1990, 75, 1020 Search PubMed.
- F. Izumi and K. Momma, Solid State Phenom., 2007, 130, 15 Search PubMed.
- K. Momma and F. Izumi, J. Appl. Crystallogr., 2011, 44, 1272 CrossRef.
- Y. Makimura, T. Sasaki, T. Nonaka, Y. F. Nishimura, T. Uyama, C. Okuda, Y. Itou and Y. Takeuchi, J. Mater. Chem. A, 2016, 4, 8350 RSC.
- A. F. Reid and A. E. Ringwood, Earth Planet. Sci. Lett., 1969, 6, 205 CrossRef.
- E. Kroumova, M. I. Aroyo, J. M. Perez-Mato, A. Kirov, C. Capillas, S. Ivantchev and H. Wondratschek, Phase Transitions, 2003, 79, 155 CrossRef.
- E. Kroumova, M. I. Aroyo, J. M. Perez-Mato, A. Kirov, C. Capillas, S. Ivantchev and H. Wondratschek, Phase Transitions, 2003, 79, 155 CrossRef.
- C. M. Julien and M. Massot, Mater. Sci. Eng., 2003, B100, 69 CrossRef.
- T.-J. Kim, D. Son, J. Cho and B. Park, J. Power Sources, 2006, 154, 268 CrossRef.
- L. Z. Zhao, Y. W. Chen and G. R. Wang, Solid State Ionics, 2010, 181, 1399 CrossRef.
- J. N. Reimers, E. W. Fuller, E. Rossen and J. R. Dahn, J. Electrochem. Soc., 1993, 142, 3396 CrossRef.
- J. Cho, Chem. Mater., 2001, 13, 4537 CrossRef.
- A. Van der Ven and G. Geder, Electrochem. Solid-State Lett., 2000, 3, 301 CrossRef.
- A. Van der Ven and G. Ceder, J. Power Sources, 2001, 97–98, 529 CrossRef.
- A. Van der Ven, J. Bhattacharya and A. A. Belak, Acc. Chem. Res., 2013, 46, 1216 CrossRef PubMed.
- A. Urban, J. Lee and G. Ceder, Adv. Energy Mater., 2014, 4, 1400478 CrossRef.
- R. Malik, D. Burch, M. Bazant and G. Ceder, Nano Lett., 2010, 10, 4123 CrossRef PubMed.
- Y.-I. Jang, B. Huang, F. C. Chou, D. R. Sadoway and Y.-M. Chaing, J. Appl. Phys., 2000, 87, 7382 CrossRef.
- W. Du, Z. Su and Y. Zhang, Ceram. Int., 2016, 42, 6500 CrossRef.
- M. Ama, Z. Su and H. Pan, Ceram. Int., 2015, 41, 13887 CrossRef.
Footnote |
| † Electronic supplementary information (ESI) available: Cycle performances at 25 °C of the o-LiMnO2, LMO (5 GPa), LMO (8 GPa) and LMO (12 GPa) samples, charge and discharge curves of the lithium cells with the LMO (5 GPa) and LMO (8 GPa) samples operated at 40 °C, structural parameters of the LMO (5 GPa) and LMO (8 GPa) samples, Raman spectrum of the charged LMO (12 GPa) sample, Raman spectra of the cycled LMO (5 GPa) and LMO (8 GPa) samples, and Raman spectra of PTFE and AB. See DOI: 10.1039/c8ra03722a |
| This journal is © The Royal Society of Chemistry 2018 |

