 Open Access Article
Quinic acid and hypervalent chromium: a spectroscopic and kinetic study†
María Florencia Mangiameli *ab,
Sebastián Bellúab,
Bárbara Pérez Moraab,
Luis Salaa and
Nadia Mamanaa
aÁrea Química General e Inorgánica, Departamento de Química-Física, Facultad de Ciencias Bioquímicas y Farmacéuticas, Universidad Nacional de Rosario, Suipacha 531, S2002LRK Rosario, Santa Fe, Argentina. E-mail: mangiameli@iquir-conicet.gov.ar; Tel: +54 341 4350214
bInstituto de Química de Rosario-CONICET, Suipacha 570, S2002LRK Rosario, Santa Fe, Argentina
First published on 17th August 2018
Abstract
The redox reaction between an excess of quinic acid (QA) and CrVI involves the formation of intermediates, namely, CrIV and CrV species, which in turn react with the organic substrates. As observed with other substrates that have already been studied, CrIV does not accumulate during this reaction because of the rate of the reaction. Its rate of disappearance is several times higher than that of the reaction of CrVI or CrV with QA. Kinetic studies indicate that the redox reaction proceeds via a combined mechanism that involves the pathways CrVI → CrIV → CrII and CrVI → CrIV → CrIII, which is supported by the observation of superoxo-CrIII (CrO22+) ions, free radicals, and oxo-CrV species as intermediates and the detection of CrVI ester species. The present study reports the complete rate laws for the QA/chromium redox reaction.
Introduction
CrVI is a very important environmental pollutant and a well-known occupational contaminant.1 Although it is not doubted that CrVI induces cancer,2–8 there is still a discussion regarding the species most probably responsible for cell damage and the mechanism(s) involved.9–12 CrVI itself cannot react with DNA in vitro or with isolated nuclei. On the other hand, when reducing agents are present in the medium, it causes an extensive diversity of DNA damage, which includes damage to Cr–DNA complex, DNA–protein crosslinks, and apurinic–apyrimidinic sites as well as oxidative damage.11,13–17 The formation of CrV and CrII/IV intermediates during the oxidation of a variety of organic compounds by CrVI has been observed,18–22 and their involvement in Cr-induced cancers1,23 has aroused much curiosity in the chemistry and biochemistry of chromium.24 In fact, the detection by continuous-wave electron paramagnetic resonance (CW-EPR) or electron spin resonance (ESR) of a long-lived CrV species25–28 is focused on the probable role(s) performed by CrV species in carcinogenesis brought about by CrVI. A similar situation has arisen with CrIV. In the course of the examination of the interactions of aldohexoses29–34 and carboxylic acids26,35–37 with CrVI, we were able to demonstrate the interactions of CrVI, CrV and CrIV with different sugars present in biological systems.tert-2-Hydroxy acid, quinic acid (QA), ((1R,3R,4R,5R)-1,3,4,5-tetrahydroxycyclohexanecarboxylic acid) (Fig. 1) is a natural cyclic polyol compound found in plums, peaches, pears, apples, quina bark, Eucalyptus globulus, carrot and tobacco leaves, coffee beans and other vegetables.38 Additionally, QA is related to the acidity of coffee.39 QA is an important biological substrate, because it is important in the cellular synthesis of aromatic compounds, and it is also a multipurpose chiral starting material for new pharmaceuticals.
Considering its structure, QA is a perfect ligand for studying the redox reactions of Cr in vitro with biologically significant donor groups. The hydroxyl-substituted cyclohexane ring in QA can act as a cellular carbohydrate. Functional groups such as diols (e.g., ascorbic acid, ribose, D-glucose and their derivatives) and 2-hydroxy acids (e.g., citric, malic, and lactic acids) can be simulated by different regions of QA (tert-2-hydroxyacid moiety and cis-diol (O(3),O(4)) and trans-diol (O(4),O(5)) groups), each of which is a potential chelating agent for CrV/IV. It has been established that CrIV/CrV can be produced intracellularly during the reduction of CrVI40–42 besides the oxidation of CrIII in the presence of activated oxygen generated throughout enzymatic reactions.43–46 Additionally, the lifetimes of identified CrIV complexes under biological conditions (pH ∼ 7) are measured in minutes or seconds18,47 as well as in a slightly acidic medium (pH ∼ 4.5–5.5) similar to that occurring in the cellular uptake of insoluble chromates by phagocytosis.48 QA makes it possible to perform intramolecular competition experiments between different functional groups (vic-diol versus tert-2-hydroxy acid) or different orientations of the same functional group (trans versus cis diol).49 Lay et al. studied QA by CW-EPR in the presence of CrV to determine and understand the structures of the complexes formed between both species.49 However, no kinetic studies have been carried out on QA/Cr systems, which are necessary to obtain information about what is known about this substrate and its relation with chromium species and to propose a mechanism for the reaction between CrVI and QA. It is also important to measure the half-lives of intermediate species as well as their interaction with QA because of their possible presence in the intracellular environment and the potential for damage that they represent.
Experimental section
Materials
QA (Sigma, p.a.), potassium dichromate (Mallinckrodt), perchloric acid (Baker, A.C.S.), sodium hydroxide (Cicarelli, p.a.), H2SO4 (Fluka, puriss. p.a. (HPLC)), methanol, oxalic acid (Biopack, p.a.), HCl (Cicarelli, p.a.), argon (99.9%), acrylamide (Merck, 99.0%), ehba = 2-ethyl-2-hydroxybutanoic acid (Aldrich, 99.0%), diphenylpicrylhydrazyl (dpph) (Aldrich, p.a.), Zn (Sigma-Aldrich, 99.9%), HgCl2 (Merck, 99.8%), Cr(ClO4)3·6H2O (Sigma-Aldrich, p.a.) and [Fe(NH4)2]2(SO4)2 (Cicarelli, p.a.) were used without further purification. Sodium perchlorate monohydrate (Fluka, 98.0%), oxygen (99.99%), Zn (Cicarelli, p.a.), and HgCl2 (Cicarelli, p.a.) were also used. 4-(2-Hydroxyethyl)-1-piperazineethanesulfonic acid (Hepes) buffer (Sigma Ultra, 99.5%) was added to adjust the pH of solutions to 7.05. Aqueous solutions were prepared in Milli-Q water (18.2 MΩ cm−1). [CoIII(NH3)5Cl]Cl2 (ref. 50) and Na[CrVO(ehba)2]·H2O51 were synthesized according to the method described in the literature.For experiments performed in the pH range of 1–5, the pH of the solutions was adjusted by the addition of 0.5 M HClO4 or 1.0 M NaOH. In the experiments performed at a constant ionic strength (I = 1.0 M) and different proton concentrations, mixtures of sodium perchlorate solutions and perchloric acid solutions were used. Sodium perchlorate solutions were prepared by dissolving the salt in an appropriate amount of water to reach a concentration of 7.12 M. The concentration of stock solutions of perchloric acid was determined by titration employing standard analytical methods.
CAUTION. CrVI compounds are human carcinogens, and CrV complexes are mutagenic and potential carcinogens.52 Contact with the skin and inhalation must be avoided. Acrylamide is a carcinogen and must be handled in a well-ventilated fume hood.53
Methods
Substrate stability
The stability of the organic substrates under different experimental conditions such as the concentrations of HClO4 and oxygen used in the kinetic measurements was tested by high-performance liquid chromatography (HPLC). Chromatograms were obtained using a KNK-500A chromatograph equipped with a 7125 HPLC pump. The analysis was carried out on an Aminex HPX-87H HPLC column (300 × 7.8 mm, Bio-Rad Laboratories) using 9.0 × 10⁻³ N H2SO4 with a flow rate of 0.6 mL min−1 as the eluent at 33 °C. The effluent was monitored with a UV detector (ProStar 325 UV-vis detector, λ = 220 nm). QA was incubated at 33 °C in the conditions of the kinetic experiments. At different times, aliquots were taken, diluted with the eluent medium and filtered using a nylon filter with 0.2 μm pores (Nalgene) prior to injection.Polymerization test
The polymerization of acrylamide was investigated during the reaction of QA with CrVI by employing a specific test for the generation of free radicals.54 A solution of CrVI (0.19 mL, 0.53 M) was added to 1.0 mL of a reaction mixture containing QA (1.0 mmol) and acrylamide (3.66 mmol). When [CrVI] was negligible, 5.0 mL of cold methanol (0 °C) was added to the mixture, and a white polymer precipitated. Control experiments showed that no polymerization of acrylamide occurred under the experimental conditions with either CrVI or QA alone. The reaction of oxalic acid with CrVI was employed as a positive control. A solution of CrVI (1.0 mL, 0.53 M) was added to 1.0 mL of a mixture containing oxalic acid (2.0 mmol) and acrylamide (7.3 mmol). After the disappearance of CrVI, 10.0 mL of cold methanol (0 °C) was added to the reaction mixture, and the immediate appearance of a white polymer was observed. Possible reactions of CrV and CrIV with acrylamide were investigated using Na[CrVO(ehba)2]54 and [CrIVO(ehbaH)2].50 No precipitation occurred upon mixing CrV or CrIV complexes with acrylamide under the conditions used in the CrVI/QA reaction.Generation of CrII
As was previously described in the main text,18,26,27,37 aqueous CrO2+ species can be generated in situ by rapid oxidation of Cr2+ using oxygen. To generate the required Cr2+, it is necessary to employ a highly reducing medium. The procedure involves a Zn/Hg amalgam and a strong flow of hydrogen. The Zn/Hg amalgam was prepared in a 5 mL balloon by stirring a mixture of Zn (∼5.0 g, previously washed with 3.0 M HCl for 5 min) and HgCl2 (0.3 M in 1.0 M HCl) for 30 min. Afterwards, excess HgCl2 was eliminated, and the resulting amalgam was washed three times with 1.0 M HClO4 and finally with distilled water. An appropriate volume of HClO4 and distilled water was added to the amalgam in the balloon to obtain pH of 1.0 in a final volume of 3.5 mL. Finally, the balloon was closed with a rubber septum cap and stirred while being bubbled with H2 for at least 45 min to ensure a reducing medium. Then, 200 μL of 6.0 mM Cr(ClO4)3 was injected while keeping the H2 bubbling and stirring constant. After 1.0 h, Cr(ClO4)3 was quantitatively reduced to Cr2+. The value of [Cr2+] was determined by treating an aliquot of the reaction mixture with an aqueous solution of [CoIII(NH3)5Cl]Cl2 under an anaerobic atmosphere (Ar); the mixture was then poured into concentrated HCl, and the CoII content was determined by measuring the absorbance of [CoCl4]2− at 692 nm.50In situ generation of oxo-CrIV (CrO2+)
For in situ generation of CrO2+, a deoxygenated solution of Cr2+ was injected into an acidic aqueous solution of QA, which was saturated with O2 (1.26 mM). At very low Cr2+/O2 ratios (<0.05), CrO22+ was quantitatively formed, whereas at intermediate Cr2+/O2 ratios (∼0.15), the reaction afforded mixtures of CrO2+ and CrO22+.55 In a typical experiment, 100 μL of 6.0 mM Cr2+ was injected into a septum-capped spectrophotometric quartz cell with a path length of 1.0 cm, which was filled with 2.3 mL of an O2-saturated solution containing 0.25–6.0 mM QA and appropriate concentrations of HClO4 and NaClO4 ([H+] = 0.1–0.6 M, I = 1.0 M) at 15 °C. Under these experimental conditions, the reaction between Cr2+ and O2 rapidly produced 0.07 mM CrO2+ (average yield of 28% based on total [Cr2+]). After CrO2+ was formed, it reacted with QA to yield Cr2+, which was then quantitatively transformed to a superoxo-CrIII ion (CrO22+) by reacting with the remaining oxygen (Cr2+/O2 ratio <0.05) with no autocatalytic consumption of CrO22+ by Cr2+.55Quantification of CrO2+
The concentration of CrO2+ generated by the reaction of Cr2+ with O2 was determined by injecting 100 μL of 6.0 mM Cr2+ into 2.3 mL of an O2-saturated solution of 0.1 M ehba buffer (pH 3.0) at 15 °C. Immediately after mixing, the solution turned pink, and the absorbance of [CrIV(O)(ehba)2]2− at 512 nm (ε = 2380 M−1 cm−1) was measured.47Spectrophotometric measurements
All kinetic measurements were performed by monitoring the absorbance changes with a Jasco V-550 spectrophotometer with fully thermostated cell compartments (±0.2 °C). The reactions were followed under pseudo-first-order conditions using an excess of QA with respect to Cr. The reactant solutions were thermostated prior to the experiment and transferred into a quartz cell with a path length of 1.0 cm immediately after mixing. All kinetic data were fitted using routines in the Origin 6.0 package.Table 1 lists key wavelengths for different Cr species analyzed in this study.
| Chromium species | CrVI | CrV | CrIII | CrO22+ |
|---|---|---|---|---|
| Wavelength (nm) | 350 | 570 | 570 | 290 |
Chromate esters
Chromate esters were investigated by UV-vis spectrophotometry in the region of 250–600 nm, in which they exhibited characteristic absorption bands. Reactions were performed at pH of 7.05 (Hepes buffer), at which the redox reaction is slow enough to enable observations of the formation of esters. The instrument was zeroed using an arrangement in which the reference and sample beams passed through matching cells, and both contained 5.0 × 10⁻⁴ M CrVI in 0.1 M Hepes buffer with a pH of 7.05. The solution in the sample cell was replaced with a reaction solution containing 5.0 × 10⁻⁴ M CrVI and 0.25–0.013 M QA in Hepes buffer at pH = 7.05 and T = 24 °C. The spectra obtained after mixing showed a characteristic absorption at 460 nm. Each mixture was monitored for 5 minutes, and no variations were observed in the shape and intensity of the spectra.Time evolution of the QA/CrVI reaction
Time-dependent UV-vis spectra were recorded for two different reaction mixtures. The first mixture containing 0.3 M QA, 0.1 M HClO4, and 6.0 × 10⁻⁴ M CrVI with I = 1.0 M at 33 °C was monitored between 200 and 800 nm every 4 minutes until total consumption of CrVI to determine the presence of the isosbestic point. The second reaction mixture containing 0.3 M QA, 0.1 M HClO4, and 6.0 × 10⁻³ M CrVI with I = 1.0 M at 33 °C was monitored between 450 and 900 nm every 4 minutes until total consumption of CrVI to determine whether the final redox product of the reaction was CrIII(aq) or CrIII ligand. In this reaction, the time evolution of the QA/CrVI mixture was monitored by following changes in the absorption band at 570 nm. The concentration of CrVI used in this experiment was 10 times higher because CrIII species have a very low ε value at 570 nm. The rate constants obtained at this wavelength were in agreement with those calculated from the data recorded at 350 nm in these experimental conditions.QA/CrVI reactions
The disappearance of CrVI in the reaction mixtures at 33 °C was followed by monitoring the absorbance at 350 nm until at least 80% conversion. The initial concentration of CrVI was 6.0 × 10⁻⁴ M, whereas the QA concentration was varied from 0.03 M to 0.12 M. In these kinetic measurements, I was kept constant at 1.0 M, whereas [HClO4] was varied from 0.1 to 0.5 M at various [QA] values. The rate constants (k6 and k5) were deduced from multiple determinations and were within ±10% of each other. The rate constants obtained at 350 nm were used to fit the absorbance changes at 420–440 nm. The goodness of fit at these wavelengths was used to corroborate the rate expressions used to determine the rate constants for 350 nm. The first-order dependence of the rate upon [CrVI] was confirmed by a set of experiments, where [CrVI]0 was varied between 0.3 and 0.6 mM, but T, [QA] and ionic strength were kept constant.Detection of superoxo-CrIII ions during the reaction of QA with CrVI
The fact that CrII is involved in the oxidation mechanism of several alcohols by CrIV and CrVI in HClO4 was demonstrated by its conversion to CrO22+ upon reacting with dioxygen.55–59 The possible formation of Cr2+ in QA/CrVI mixtures was investigated by periodic UV-vis scanning (220–500 nm) of solutions of 0.09 M QA, 0.06 mM CrVI and 1.0 M HClO4 saturated with oxygen ([O2] = 1.26 mM) at 25 °C. Periodic scanning of the reaction mixture showed that the CrVI band at 350 nm decreased in intensity, whereas new peaks appeared at 290 nm and 245 nm. When the value of [CrVI] was negligible, 0.30 mM Fe2+ was added to bring about the following reaction (eqn (1)):| CrO22+ + 3Fe2+ + 4H+ → Cr3+ + 3Fe3+ + 2H2O | (1) |
The spectrum of the reaction mixture was subtracted from the corresponding spectrum recorded prior to the addition of Fe2+. The presence of a negative difference in absorbance around 290 nm between these spectra was consistent with the presence of CrO22+.
In addition, the same reaction was conducted under strictly anaerobic conditions (Ar). In this case, the absence of oxygen implied that no CrIV would be generated and also no CrO22+ would be formed. The characteristic absorption bands at 245 and 290 nm were not present.
QA/CrIV reactions
The oxidation of QA by CrO2+ was studied under pseudo-first-order conditions with an excess of QA with respect to CrIV and monitored using a spectrophotometer by following CrO22+ as a final redox product. Kinetic data were recorded spectrophotometrically following the formation of CrO22+ at 290 nm (ε = 3000 M−1 cm−1) by employing a septum-capped spectrophotometer cell with a path length of 1.0 cm, which was filled with 2.3 mL of an O2-saturated solution of the organic substrate. At this wavelength, neither the substrate QA nor the oxidized products exhibited absorption. All mixtures of QA/CrO2+ showed an increase in two absorption bands (245 and 290 nm) with a relative intensity of Abs245/Abs290 = 2.2, which is characteristic of CrO22+.55 Kinetic measurements were performed at [CrIV] = 0.07 mM, I = 1.0 M, [O2] = 1.26 mM and 15 °C. The range of QA concentrations used was 1.0–6.0 mM, and no disproportionation reaction of CrO2+ was observed. The range of [HClO4] used was 0.10–0.60 M. The experimental pseudo-first-order rate constants (k4exp), which were determined from nonlinear least-square fits of absorbance data for 290 nm, were the averages of at least five determinations and were within ±10% of each other. The data used to calculate the kinetic constant, k4exp, corresponded to 80% of the exponential growth in the experimental values. The first-order dependence of the rate upon [CrIV] was confirmed by a set of experiments, where [CrIV]0 was varied between 3.0 × 10⁻⁵ and 6.0 × 10⁻⁵ M, but T, [QA], and I were kept constant.EPR measurements
EPR spectra were obtained with a Bruker Elexsys 500 spectrometer operated at X-band frequencies (∼9 GHz). Microwaves were generated by means of a klystron (ER041MR), and frequencies were measured with a built-in frequency counter. Spectra were recorded as first derivatives of the microwave absorption at 1024 points at 18 ± 1 °C using a microwave power of 202 mW, a modulation amplitude of 2.0 G, a time constant of 20 ms, a sweep width of 120 G and a conversion time of 40 ms. Also, g-values were determined by reference to dpph (g = 2.0036) as an external standard reference. The power values used in the EPR experiments did not exceed 10 mW to avoid signal saturation. In the EPR measurements, the speed and number of scans were fixed to reduce the time taken for each measurement; this was done to avoid fluctuations in the EPR signals during scanning of the samples.Results
Reaction time of the QA/CrVI mixture
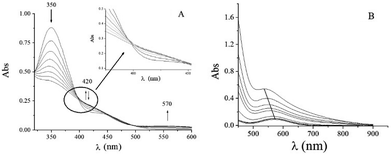
The UV-vis absorption spectrum of the QA/CrVI reaction mixture in an acidic medium (HClO4) showed the characteristic behavior of CrVI in an acidic medium25–27 with a shoulder at 420/450 nm and a band at 350 nm (Fig. 2). The absorbance at 350 nm decayed, and the absorbance at the shoulder first increased and then decayed over time; also, there was an increase in the absorbance at 570 nm (Fig. 2A).The absence of an isosbestic point (highlighted area in Fig. 2A) indicates that there are more than one competing redox reactions involving intermediate chromium species, which must be present in appreciable concentrations during the reduction of CrVI to CrIII.
As the reaction proceeded, two d–d bands were detected in the electronic absorption spectrum at λmax = 406 nm (ε = 40 M−1 cm−1) and 573 nm (ε = 18 M−1 cm−1) (Fig. S1†). These bands were assigned to the 4A2g → 4T1g and 4A2g → 4T2g octahedral transitions of CrIII in Oh symmetry.60 After 6 h, significant changes were observed in these two bands; for example, the band at 539 nm (ε = 90 M−1 cm−1) shifted to 571 nm (ε = 15 M−1 cm−1) (Fig. 2B). This observation suggested that the absorption at 571 nm originated from CrV and CrIII–QA complex species. The CrIII–QA complex formed initially was slowly hydrolysed to CrIII(aq).
Detection of CrVI esters
Differential UV-vis spectra of QA/CrVI mixtures were used to study the formation of CrVI esters. An absorption band (λmax = 470 nm) was observed (Fig. 3), which was consistent with literature data.61 At pH values near neutrality, the redox reaction of QA/CrVI occurred extremely slowly, and the reduction of CrVI was negligible. In consequence, the ester formation and electron transfer reactions could be clearly distinguished.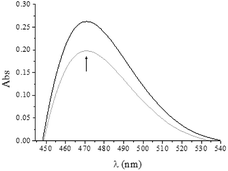 | ||
| Fig. 3 Differential UV-vis spectra of QA/CrVI mixtures at pH of 7.05: [QA] = 0.25 M (black)–0.013 M (grey), [CrVI] = 5.0 × 10⁻⁴ M, [Hepes] = 0.10 M, T = 24.0 °C, and pH = 7.05. | ||
Detection of CrII
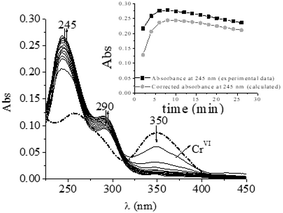
The involvement of CrII species in the oxidation of different organic alcohols by CrIV/CrVI in acidic media has previously been established by the formation of superoxo-CrIII (CrO22+) by a reaction with dioxygen.18,26,27,37,55,62 Periodic scanning of the QA/CrVI reaction mixture in 1.0 M HClO4 with a high oxygen concentration and a very low CrVI concentration (please see experimental conditions) reveals two bands at 290 and 245 nm, which are characteristic of CrO22+ (Fig. 4). This observation confirms the formation of CrII and can be considered to be indirect evidence of the participation of CrIV in the QA/CrVI redox mechanism, as has been observed with other saccharides.18,25–27,37Taking into account the spectra shown in Fig. 4, the absorbance at 245 nm and 290 nm at any time in these experimental conditions is due to the contributions of CrO22+ and CrVI. It is interesting to determine how much each species contributes to the total absorbance to determine the real contribution of the redox reaction of CrIV to the total oxidation mechanism. To do this, the contribution of CrO22+ ions at the absorbance at 245 nm is calculated according to eqn (2):
| Abs245(CrO22+) = Abs245 − Abs350 × ε1−1 × ε2 | (2) |
Considering that the molar absorption coefficient of CrO22+ at 245 nm is 7000 M−1 cm−1,56 the maximum concentration of CrO22+ was 3.48 × 10⁻⁵ M (yield, 49.7%). The yield of CrO22+ should approximate to 100% if the reaction takes place entirely via the CrVI → CrIV → CrII pathway. The fact that the percentage yield of CrO22+ reached only 50% of the expected theoretical value suggested that only half of CrVI reacted with QA via a pathway involving CrII/IV.
At 350 nm, the absorbance was insignificant; 0.30 mM FeII was added, and a new spectrum was recorded. The latter spectrum was subtracted from the spectrum recorded prior to the addition of FeII. The difference spectrum displayed a negative absorbance around 290 nm, which is consistent with the formation of CrO22+, as has been observed with other saccharides (Fig. S2†).18
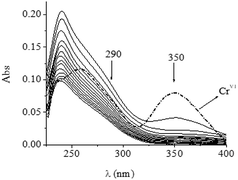
When the QA/CrVI reaction was conducted in the same experimental conditions but in a strictly anaerobic medium (Ar), the spectrum showed the disappearance of the characteristic bands of CrO22+ at 245 and 290 nm due to anaerobic conditions (Fig. 5). This fact also confirmed the identity of CrII species.
Rate studies
Reaction of QA/CrIV
As was reported in the experimental section, CrIV was generated in situ through the reaction between CrII and O2 in appropriate experimental conditions. The QA/CrIV reaction under acidic media and O2-saturated conditions produced CrII. Since neither the substrate nor the oxidized products absorb at 290 nm, this reaction can be indirectly observed by measuring the increment in absorbance at this wavelength, which corresponds to the formation of CrO22+. Typical sequential electronic spectra, which show the characteristic bands of CrO22+ at 245 and 290 nm, are shown in Fig. 6A. The intensity ratio between the absorption bands at 245 and 290 nm was 2.2, which confirmed the presence of CrO22+.18,55,56,63 As occurred with other substrates studied previously,18,25–27,37 the monotonic growth at 290 nm was found to follow first-order kinetics (Fig. 6B). A series of experiments using constant values of temperature, [QA] and ionic strength (I) and [CrIV]0 in the range of 3.0–6.0 × 10⁻⁵ M were used to confirm the first-order dependence of the rate upon [CrIV] (data not shown). The experimental rate constant, k4exp, was calculated by applying a nonlinear least-square fit to the absorbance/time data using 80% of the exponential growth in the experimental values, according to eqn (3):| Abs = Abs∞ + (Abs0 − Abs∞)e−(k4exp)t | (3) |
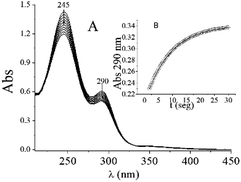 | ||
| Fig. 6 (A) Time evolution of UV/vis absorption spectra of QA/CrIV mixtures. (B) Increase in absorbance at 290 nm due to CrO22+ formation by the QA/CrVI reaction. [H+] = 0.30 M, I = 1.0 M, [CrIV]0 = 0.07 mM, [QA] = 0.003 M, T = 15.0 °C, and [O2] = 1.26 mM. The time interval between each trace was 2.0 min. The fitting of the experimental data was performed using eqn (2) and the Origin 6.0 program. | ||
Table 2 summarizes the values of k4exp for several concentrations of QA in different concentrations of HClO4. As represented in Fig. 7A, the k4exp values for different [H+] values depend linearly on the concentration of QA. The k4H values were calculated using eqn (4):
| k4exp = k4H[QA] | (4) |
| [QA]/mM | [HClO4]/M | ||||
|---|---|---|---|---|---|
| 0.10 | 0.20 | 0.30 | 0.40 | 0.60 | |
| a T = 15.0 °C, [CrIV]0 = 0.070 mM, and I = 1.0 M. Mean values from multiple determinations. The rate constants were obtained using the Origin 6.0 program. | |||||
| 1.00 | 0.070 ± 0.007 | 0.044 ± 0.004 | 0.035 ± 0.004 | — | — |
| 2.00 | 0.142 ± 0.014 | 0.088 ± 0.009 | 0.066 ± 0.007 | 0.060 ± 0.006 | 0.05 ± 0.005 |
| 2.50 | 0.177 ± 0.018 | 0.110 ± 0.011 | 0.086 ± 0.009 | 0.076 ± 0.008 | — |
| 3.00 | 0.212 ± 0.021 | 0.132 ± 0.013 | 0.104 ± 0.010 | 0.090 ± 0.009 | 0.074 ± 0.007 |
| 4.00 | — | — | 0.138 ± 0.014 | 0.120 ± 0.012 | 0.100 ± 0.010 |
| 5.00 | — | — | 0.173 ± 0.017 | 0.150 ± 0.015 | 0.124 ± 0.012 |
| 6.00 | — | — | — | — | 0.148 ± 0.015 |
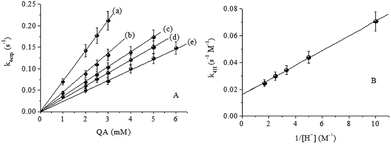 | ||
| Fig. 7 (A) Effect of [QA] on k4exp. (B) Linear dependence of k4H on [H+]−1. T = 15.0 °C, I = 1.0 M, [CrIV]0 = 0.070 mM and [H+] = (a) 0.10, (b) 0.20, (c) 0.30, (d) 0.40 and (e) 0.60 M. | ||
The bimolecular rate constant, k4H, varies linearly with [H+]−1 with a slope kIIIV of (0.00548 ± 6.4) × 10−5 s−1 and a positive intercept kIIV of (0.01615 ± 3.5) × 10−4 M−1 s−1 (Fig. 7B), according to eqn (5):
| k4H = kIIV + kIIIV[H+]−1 | (5) |
Combining eqn (4) and (5) results in eqn (6), which describes the rate constant, k4, for the disappearance of CrIV:
| k4 = (kIIV + kIIIV[H+]−1)[QA] | (6) |
Oxidation of QA by CrVI
As was previously observed with other substrates,25–27 for the QA/CrVI mixture, the curves of absorbance at 350 nm vs. time displayed a monotonic decreasing behavior that cannot be described using a single-exponential decay. An acceptable description of the kinetic profiles could be obtained by using a set of consecutive first-order reactions, as presented in Scheme 1.Considering the superposition of the absorbance of CrV throughout the redox reaction, the absorbance at 350 nm is given by eqn (7):
| Abs350 = εVI[CrVI] + εV[CrV] | (7) |
Combining eqn (6) with rate expressions65 that result from considering first-order reactions gives the following expression (eqn (8)):
| Abs350 = Abs0e−2(k6)t + k6εV[CrVI]0(e−(k5)t − e−2(k6)t)/(2k6 − k5) | (8) |
| k6exp = k6H[QA] | (9) |
| k6H = kIVI + kIIVI[H+]2 | (10) |
| k6 = (kIVI + kIIVI[H+]2)[QA] | (11) |
| [QA]/M | [HClO4]/M | ||||
|---|---|---|---|---|---|
| 0.10 | 0.20 | 0.30 | 0.40 | 0.50 | |
| a T = 33.0 °C, [CrVI]0 = 6.0 × 10⁻⁴ M, and I = 1.0 M.b Mean values from multiple determinations. | |||||
| 103 k6expb/s−1 M−1 | |||||
| 0.030 | 0.48 ± 0.05 | 0.73 ± 0.07 | 1.27 ± 0.13 | 1.80 ± 0.18 | 2.30 ± 0.23 |
| 0.045 | 0.60 ± 0.06 | 1.30 ± 0.13 | 1.90 ± 0.19 | 2.50 ± 0.25 | 3.90 ± 0.39 |
| 0.080 | 1.19 ± 0.12 | 2.10 ± 0.21 | 3.36 ± 0.34 | 4.86 ± 0.49 | 6.85 ± 0.69 |
| 0.100 | 1.40 ± 0.14 | 2.80 ± 0.28 | 4.22 ± 0.42 | 5.70 ± 0.57 | 8.00 ± 0.80 |
| 0.120 | 1.70 ± 0.17 | 3.10 ± 0.31 | 4.90 ± 0.49 | 6.80 ± 0.68 | 9.80 ± 0.98 |
![[thin space (1/6-em)]](https://www.rsc.org/images/entities/char_2009.gif) |
|||||
| 103 k5expb/s−1 | |||||
| 0.030 | 0.11 ± 0.01 | 0.17 ± 0.02 | 0.25 ± 0.03 | 0.40 ± 0.04 | 0.70 ± 0.07 |
| 0.045 | 0.14 ± 0.014 | 0.22 ± 0.02 | 0.36 ± 0.40 | 0.60 ± 0.06 | 0.98 ± 0.09 |
| 0.080 | 0.27 ± 0.023 | 0.39 ± 0.04 | 0.62 ± 0.06 | 1.04 ± 0.11 | 1.79 ± 0.18 |
| 0.100 | 0.33 ± 0.03 | 0.48 ± 0.05 | 0.81 ± 0.08 | 1.33 ± 0.13 | 2.20 ± 0.20 |
| 0.120 | 0.40 ± 0.04 | 0.63 ± 0.06 | 0.98 ± 0.09 | 1.60 ± 0.16 | 2.70 ± 0.30 |
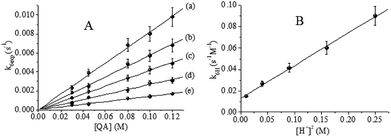 | ||
| Fig. 8 (A) Effect of [QA] on k6exp. (B) Quadratic dependence of k6H on [H+]2. T = 33.0 °C, I = 1.0 M, [CrVI]0 = 6.0 × 10⁻⁴ M and [H+] = (a) 0.10, (b) 0.20, (c) 0.30, (d) 0.40 and (e) 0.50 M. | ||
Plots of k5exp vs. [QA] for a constant value of [H+] revealed linear dependence, as can be seen in Fig. 9A. Using these experimental data and eqn (12), the bimolecular rate constant k5H could be calculated. A quadratic dependence was revealed by plotting k5H vs. [H+] (Fig. 9B). The corresponding k5H values were calculated using eqn (13).
| k5exp = k5H[QA] | (12) |
| k5H = kIV + kIIV[H+]2 | (13) |
| k5 = (kIV + kIIV[H+]2)[QA] | (14) |
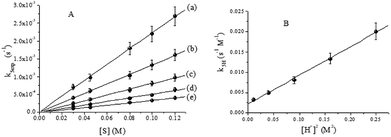 | ||
| Fig. 9 (A) Effect of [QA] on k5exp. (B) Quadratic dependence of k5H on [H+]2. T = 33.0 °C, I = 1.0 M, [CrVI]0 = 6.0 × 10⁻⁴ M and [H+] = (a) 0.10, (b) 0.20, (c) 0.30, (d) 0.40 and (e) 0.50 M. | ||
According to Fig. 9B, kIV = (2.22 ± 0.3) × 10−3 s−1 M−1 and kIIV = (7.01 ± 0.19) × 10−2 s−1 M−3. For the disappearance of CrVI and CrV, the rate constants are specified by eqn (11) and (14), respectively.
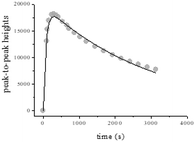
By using CW-EPR spectroscopy, the rate constants k6 and k5 could be independently obtained. The EPR peak-to-peak height for CrV in the reaction of 0.25 M QA and 2.5 × 10⁻³ M CrVI in 0.5 M HClO4 increased and decayed at 18 °C (Fig. 10). A higher modulation amplitude (2.0 G) was used to avoid superhyperfine coupling. Eqn (15) was used to fit the CW-EPR data. This equation was derived by considering consecutive first-order reactions.
| h = Ak6(e−(k5)t − e−2(k6)t)/(2k6 − k5) | (15) |
The parameter A depends on the spectrometer settings (modulation, gain, etc.).
The values of both rate constants k5 and k6 determined by CW-EPR were in accordance with those obtained using eqn (11) and (14), considering the experimental error and the difference in temperature. The good fitting of the data shown in Fig. 10 and that of the kinetic measurements at 350 nm (Fig. 8 and 9) indicated that the use of two different spectroscopic techniques, namely, UV/vis and CW-EPR could confirm the suggested consecutive first-order reactions shown in Scheme 1. According to the previously determined k4 values, it can be inferred that CrIV is involved in a fast kinetic step and CrV persists in the QA/CrVI mixture.
Kinetic studies at 570 nm were also carried out for QA/CrVI mixtures. In these experiments, it must be considered that oxo-CrV–QA complexes are not the only absorptive species present, and CrIV, CrIII and CrIII–ligand species also absorb at this wavelength. Additionally, and according to our previous results, CrIV did not accumulate and did not contribute to the absorption at 570 nm. The absorbance at 570 nm vs. time is shown in Fig. 11. First, the absorbance increased quickly (∼500 seconds) to high values, which could be associated with the formation of CrV and CrIII–ligand complexes. After this maximum, the absorbance decayed in an exponential way. This was probably due to the decay of CrV species and the hydrolysis of CrIII–ligand complexes. The experimental data were fitted using eqn (16), derived from Scheme 1, which considers CrIII–ligand to be the final redox species in the mixture; this enabled us to confirm or reject the previous assumption.
| Abs570 = εV[CrV] + εIII[CrIII–ligand] | (16) |
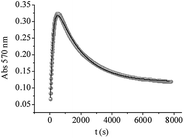 | ||
| Fig. 11 Experimental curves of absorbance at 570 nm vs. time for QA/CrVI reactions. The experimental data were fitted using eqn (16). [QA] = 0.10 M, [HClO4] = 0.20 M, [CrVI] = 4.0 × 10⁻³ M, I = 1.0 M, T = 33.0 °C, and QA/CrVI = 25/1. | ||
Eqn (17) describes the total absorbance at 570 nm at any time.
| Abs570 = εIII[CrVI]0[1 − e−2(k6)t + (εV − εIII)k6(e−(k5)t − e−2(k6)t)/(2k6 − k5)] | (17) |
The experimental data were properly fitted using eqn (17). The resulting calculated molar absorptivity values were εV = 34 M−1 cm−1 and εIII = 29.5 M−1 cm−1 (Fig. 11), which were reasonable for the complexes of CrV and CrIII with saccharides.66 Under the experimental conditions, the values of k6 and k5 were in accordance with those calculated with either eqn (17) or eqn (11)–(14).
The kinetic profile simulated using k5 and k6 shows comparable values for the time of the maximum intensity (tmax = 475 s) of Abs570 and the calculated time (465 s) at which [CrV]max occurred in the reaction (more than 40% of total Cr) (Fig. 12). These results indicate that the CrV intermediate species can be responsible for the behavior of the absorbance at 570 nm during the first period, whereas the next portion of the data corresponds to the slow decomposition of CrIII species into CrIII(aq). Moreover, as can be seen from Fig. 12, CrV still remains in the mixture after CrVI is completely consumed.
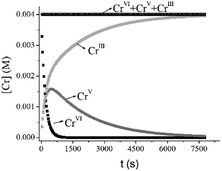 | ||
| Fig. 12 Simulated kinetic profiles for Cr species. [Cr] values were calculated using k6 = 0.0028 M−1 s−1, k5 = 0.0005 s−1, T = 33.0 °C, I = 1.0 M, [QA] = 0.10 M, [H+] = 0.20 M, and [Cr]T = 4.0 × 10⁻³ M. Values of k6 and k5 were calculated using eqn (10) and (13), respectively. | ||
Discussion
Oxidation of QA by CrVI
The reduction of CrVI by QA exhibits strong pH dependence. The reaction is slow at pH > 1, and CrVI is quickly consumed when [H+] > 0.5 M. Therefore, the [H+] range of 0.1–0.05 M was preferred to perform the kinetic study of this reaction. When [H+] was 0.1 M, the time-dependent UV/vis spectra of the QA/CrVI mixture (Fig. 2A) showed two relevant points; the absorbance (a) decayed over time at 350 nm and 420–470 nm and (b) increased without an isosbestic point at 570 nm. As was previously pointed out, the absence of an isosbestic point indicates that more than one reaction occurs throughout the reduction of CrVI to CrIII, and several chromium species are present in considerable amounts.Kinetics analysis
The presence of CrIV and/or CrV intermediates during the reduction of CrVI has been previously observed for different substrates.18,22,26,27,37 The detection of organic radicals and CrO22+ in the QA/CrVI mixture along with the observation of relatively long-lived oxo-CrV species jointly indicate that CrIV/CrV intermediates were produced in the reaction of QA with CrVI; this also strongly suggests that this redox process follows one- and two-electron pathways.Considering the presence of the two detected chromium intermediates, namely, CrV and CrIV and that CrIV reacts faster than CrV/VI, it is necessary to determine whether both or only one of them must be considered during the analysis of experimental kinetic data. A comparison of the corresponding oxidation rates for CrVI, CrV and CrIV (eqn (18), (19) and (20)) can be made by employing kn values obtained from eqn (6), (14) and (11), respectively, in the following conditions: [QA] = 0.03 M, [H+] = 0.1 M, and [CrIV] = [CrVI]T = [CrV]T = 6.0 × 10⁻⁴ M.
| υ4 = k4[CrIV] = (kIIV + kIIIV[H+]−1)[QA][CrIV] | (18) |
| υ5 = k5[CrV]T = (kIV + kIIV[H+]2)[QA][CrV]T | (19) |
| υ6 = k6[CrVI]T = (kIVI + kIIVI[H+]2)[QA][CrVI]T | (20) |
The calculated values of the rates were υ4 = 1.3 × 10⁻⁶ M s−1 > υ6 = 2.3 × 10⁻⁷ M s−1 > υ5 = 5.3 × 10⁻⁸ M s−1, and the ratios between these values were (a) υ4/υ5 ≈ 25/1, (b) υ4/υ6 ≈ 5/1 and (c) υ5/υ6 ≈ 6/1. These calculated data confirmed that CrIV reacted faster than CrV and CrVI species, suggesting that although CrIV was formed during the oxidation of QA with CrVI, it did not accumulate and cannot be considered for the fitting of experimental kinetic data. The rate values calculated for υ6 and υ5 confirmed the kinetic profiles represented in Fig. 12, which indicated that CrV was still present when there was no remaining CrVI; this suggested that this intermediate species reacted more slowly than CrVI with QA. Consequently, at any wavelength, the time dependence of the absorption data for the reaction can be fitted using the sequence proposed in Scheme 1. Moreover, eqn (15) can be used to fit the data for CW-EPR peak-to-peak height vs. time (Fig. 10). The first-order rate constants determined in this way agreed perfectly with those determined from the UV/vis spectroscopy data (eqn (11) and (14)).
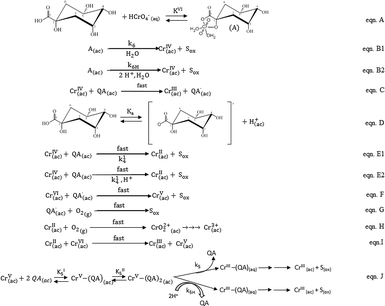
At this point, and considering all the previously reported results, we are able to propose and discuss a novel insight into the possible mechanism for the reaction of QA with CrVI (Scheme 2).
Proposed mechanism
According to the literature,67 at [CrVI] and [H+] used in these kinetic studies, CrVI occurs as HCrO4−. According to the first-order dependence on [CrVI] of the reaction rate, this species is proposed to be the reactive form of CrVI. Furthermore, the oxidation reaction of alcohols with CrVI begins with the formation of CrVI esters.26,27,37 The band observed around 460 nm shortly after QA and CrVI were mixed in conditions that favored the redox reaction is characteristic of the presence of the CrVI ester and indicates the presence of a CrVI complex intermediate that formed quickly prior to the reduction of CrVI. Therefore, the first step in the mechanism is the formation of the CrVI ester, where QA acts as a bidentate ligand (eqn A, Scheme 2). The next step in Scheme 2 is slow and comprises intramolecular two-electron transfer among molecules of the active CrVI ester to yield CrIV and Sox (eqn B1 and B2). Considering that this is an acidic substrate, it can be postulated, similar to that with other substrates,26 that both protonated and deprotonated forms of the CrVI ester can be oxidized in two different reactions. The first reaction B1 is independent of protons, and the second reaction B2 involves two protons. The theoretical rate law for the consumption of CrVI, mathematically derived from eqn A and B in Scheme 2, is represented by eqn (21). [CrVI]T denotes the total concentration of CrVI in the mixture and takes into consideration the concentrations of the ester and aqua-chromium forms.| −d[CrVI]/dt = {(kI6 + kII6[H+]2)KVI[QA][CrVI]T}/(1 + KVI[QA]) | (21) |
If KVI[QA] ≪ 1, as can be expected considering other previously studied substrates,26,27,37 eqn (21) becomes eqn (22), where k6KVI = kIVI and k6HKVI = kIIVI, which agrees with the experimental rate law (eqn (20)).
| −d[CrVI]/dt = (k6KVI + k6HKVI[H+]2)[QA][CrVI]T | (22) |
Once CrIV is formed, it participates in the oxidation mechanism in two competitive steps, comprising one- or two-electron reductions of CrIV by QA (eqn C and E). In eqn C, CrIV reacts in the presence of excess QA to generate CrIII and the QA radical (QA˙). This step is sustained by the polymerization of acrylamide when it is added to the QA/CrVI mixture. The alternative route for the reduction of CrIV by QA results in the formation of CrII and Sox, which is supported by the detection of CrO22+ (product of the reaction of CrII with O2). As was postulated for CrVI, QA exists in equilibrium between its protonated and unprotonated forms (eqn D, Scheme 2), both of which can react with CrIV in a fast reaction to yield CrII and Sox (eqn E1 and E2). These are also two electron intramolecular transfers; one is independent of protons (E1) and the other involves one proton (E2). Once again, the theoretical rate law for the consumption of CrIV, which was mathematically derived from eqn D and E in Scheme 2, is described by eqn (23). [QA]T represents the concentrations of the protonated and unprotonated forms of QA, and Ka is the acidity constant of QA.
| −d[CrIV]/dt = (k41 + k42Ka [H+]−1)[CrIV][QA]T | (23) |
If kIIV = k41 and kIIIV = k42Ka, this agrees with the experimental rate law (eqn (18)).
According to our results, CrIV does not accumulate in the mixture because it is involved in fast steps. The concentration of CrO22+ should be the same as [CrVI]0 if the reaction takes place entirely via the CrVI → CrIV → CrII pathway.55 Our experimental data indicate that the yield of CrO22+ increases as the value of [CrVI]0 decreases and reaches a limiting value of 49.7% (Fig. 4), indicating that nearly half of CrVI reacts via a route that does not involve CrII. QA˙ and CrII, which are formed as shown in eqn C and E1 and E2, respectively, rapidly react with CrVI to produce CrV and Sox in the first case (eqn F) and CrV and CrIII in the second case (eqn I) (k = 2.0 × 10⁹ M−1 s−1).55,68 Both species can also be quickly trapped by O2 to give Sox (eqn G) and CrIII(ac) (eqn H). At this point, it can be seen that CrV is formed via two alternative routes, namely, eqn F and I, which are both fast reactions involving one-electron transfers. Once formed, CrV can further oxidize QA via a two-electron process to generate Sox and CrIII as the final products (eqn J, Scheme 2). As was previously demonstrated by the calculated rate values and as shown in Fig. 12, the reaction of QA with CrV is slower than that of QA with CrVI because after all the initial CrVI is consumed, CrV still remains in the mixture in measurable quantities. Based on the selectivity for the oxidation products of QA, the kinetic results and the CW-EPR results for the oxo-CrV–QA complexes,49 we proposed a fast reaction between CrV and QA that produces an oxo-CrV–(QA)2 bischelate (kI5, kII5), which finally produces Sox and CrIII via two different routes, namely, acid-dependent and acid-independent steps (eqn J). The theoretical rate law deduced for the disappearance of the CrV species (eqn (24)) is derived from eqn J in Scheme 2. [CrV]T represents the total concentration of CrV in the mixture.
| −d[CrV]/dt = KI5KII5[QA]2(kI5 + kII5[H+]2)[CrV]T/(KI5KII5[QA]2 + KI5[QA]2) | (24) |
If KI5KII5[QA]2 ≫ KI5[QA], as can be expected considering other previously studied substrates,26,27,37 eqn (24) becomes eqn (25), where kI5 = kIV and kII5 = kIIV, which agrees with the experimental rate law (eqn (19)).
| −d[CrV]/dt = (kI5 + kII5[H+]2)[QA][CrV]T | (25) |
Conclusions
The reaction of QA with CrVI strongly depends on pH. The oxidation of QA by CrVI generates Sox and a QA–CrIII(ac) complex, which is then slowly hydrolyzed to form CrIII(ac). Kinetic studies strongly support the hypothesis that the redox reaction proceeds via a combined mechanism, which involves CrVI → CrIV → CrII and CrVI → CrV → CrIII pathways, as has been previously demonstrated with other substrates.26,27,37 The mechanism is supported by the observation of CrO22+, CrV and free radicals as reaction intermediates. The bimolecular rate constant for QA/CrIV reaction is much higher than that with CrVI or CrV, which proves that CrIV does not accumulate in the QA/CrVI reaction mixture. The detection of free radicals and the relatively long half lifetimes of CrV species are some of the reasons for warnings against the use of CrVI in industry and other human activities because of its possible role in the oxidation of several substrates that are ubiquitous in nature.Conflicts of interest
There are no conflicts to declare.Acknowledgements
We thank the National Research Council of Argentina (CONICET) PIP 0037, the National Agency of Scientific and Technological Promotion (ANPCyT) PICT 2016-1611, Santa Fe Province Agency of Science, Technology and Innovation ASACTEI No. AC 2015-0005, No. resol 118-16 project number 2010-174-16 and the National University of Rosario (UNR) BIO425 for financial support. We thank Roman Sapino for his help in the CrIV determination experiments and Patricia Barreto for her help in the CrVI determination experiments.References
- International Agency for Research on Cancer (IARC), Overall Evaluations of Carcinogenicity to Humans, IARC, 203, http//www.iarc.fr, OSHA, Occupational exposure to hexavalent chromium, final rule, US Department of Labor, 2006 Search PubMed.
- A. Levina, L. Zhang and P. A. Lay, J. Am. Chem. Soc., 2010, 132, 8720–8731 CrossRef PubMed.
- B. J. Collins, M. D. Stout, K. E. Levine, G. E. Kissling, R. L. Melnick, T. R. Fennell, R. Walden, K. Abdo, J. B. Pritchard, R. A. Fernando, L. T. Bruka and M. J. Hooth, Toxicol. Sci., 2010, 119(2), 368–379 CrossRef PubMed.
- J. J. Beaumont, R. M. Sedman, S. D. Reynolds, C. D. Sherman, L. H. Li and R. A. Howd, et al., Epidemiology, 2008, 19(1), 12–23 CrossRef PubMed.
- T. Hara, T. Hoshuyama, K. Takahashi, V. Delgermaa and T. Sorahan, Scand. J. Work, Environ. Health, 2009, 36(3), 216–221 CrossRef.
- N. M. Gatto, M. A. Kelsh, D. Ha Mai, M. Suh and D. M. Proctor, Cancer Epidemiol., 2010, 34, 388–399 CrossRef PubMed.
- D. A. Khan, S. Mushtaq, F. A. Khan and M. Q. A. Khan, Toxicol. Ind. Health, 2008, 29(2), 209–215 CrossRef PubMed.
- K. P. Nickensa, S. R. Patierno and S. Ceryak, Chem.-Biol. Interact., 2010, 188, 276–288 CrossRef PubMed.
- L. F. Sala, J. C. Gonzalez, S. I. García, M. I. Frascaroli and S. Van Doorslaer, in Advances in Carbohydrate Chemistry and Biochemistry, ed D. Horton, Elsevier, Amsterdam, 1st edn, 2011, vol. 66, pp. 69–120 Search PubMed.
- M. Figgitt, R. Newson, I. J. Leslie, J. Fisher, E. Ingham and C. P. Casea, Mutat. Res., 2010, 688, 53–61 CrossRef PubMed.
- P. A. Mazzer, L. Maurmann and R. N. Bose, J. Inorg. Biochem., 2007, 101, 44–55 CrossRef PubMed.
- G. R. Borthiry, W. E. Antholine, J. M. Myers and C. R. Myers, Chem. Biodiversity, 2008, 5, 1545–1557 CrossRef PubMed.
- M. F. Reynolds, E. C. Peterson-Roth, I. A. Bespalov, T. Johnston, V. M. Gurel, H. L. Menard and A. Zhitkovich, Cancer Res., 2009, 69, 1–9 CrossRef PubMed.
- M. D. Cohen, B. Kargacin, C. B. Klein and M. Costa, Crit. Rev. Toxicol., 1993, 23, 255–281 CrossRef PubMed.
- R. Hill, A. M. Leidal, P. A. Madureira, L. D. Gillis, D. M. Waisman, A. Chiu and P. W. K. Lee, DNA Repair, 2008, 7, 1484–1499 CrossRef PubMed.
- T. Tanaka, S. Ohkubo, I. Tatsuno and C. Prives, Cell, 2007, 130, 638–650 CrossRef PubMed.
- R. Hill, A. M. Leidal, P. A. Madureira, L. D. Gillis, H. K. Cochrane, D. M. Waisman, A. Chiu and P. W. Lee, DNA Repair, 2008, 7, 239–252 CrossRef PubMed.
- J. C. González, M. F. Mangiameli, A. Crotta Asis, S. Bellú and L. F. Sala, Polyhedron, 2013, 49, 84–92 CrossRef.
- G. R Borthiry, W. E. Antholine, J. M. Myers and C. R. Myers, J. Inorg. Biochem., 2008, 102, 1449–1462 CrossRef PubMed.
- A. Levina, L. Zhang and P. A. Lay, J. Am. Chem. Soc., 2010, 132, 8720–8731 CrossRef PubMed.
- R. Bartholomäus, J. A. Irwin, L. Shi, S. M. Smith, A. Levina and P. A. Lay, Inorg. Chem., 2013, 52, 4282–4292 CrossRef PubMed.
- L. F. Sala, J. C. Gonzalez, S. I. Garcia, M. I. Frascaroli and S. Van Doorslaer, Adv. Carbohydr. Chem. Biochem., 2011, 66, 69–120 CrossRef PubMed.
- G. N. Babu, R. Ranjani, G. Farceda and S. D. S. Murthy, J. Phytol. Res., 2007, 20, 1–6 Search PubMed.
- A. Levina, R. Codd and P. A. Lay, in Biological Magnetic Resonance, ed G. R. Hanson and L. J. Berliner, Springer Publishers, New York, 2009, vol 28, Part 4, pp. 551–579 Search PubMed.
- J. C. González, S. I. García, S. Bellú, J. M. Salas Peregrin, A. M. Atria, L. F. Sala and S. Signorella, Dalton Trans., 2010, 39, 2204–2217 RSC.
- M. F. Mangiameli, J. C. González, S. I. García, S. Bellú, M. Santoro, E. Caffaratti, M. I. Frascaroli, J. M. Salas Peregrín, A. M. Atria and L. F. Sala, J. Phys. Org. Chem., 2010, 23, 960–971 CrossRef.
- M. F. Mangiameli, J. C. González, S. I. García, M. I. Frascaroli, S. Van Doorslaer, J. M. Salas Peregrin and L. F. Sala, Dalton Trans., 2011, 40, 7033–7045 RSC.
- A. Levina, R. Codd and P. A. Lay, in Biological Magnetic Resonance, ed G. R. Hanson and L. J. Berliner, Springer Publishers, New York, 2009, vol. 28, Part 4, pp. 551–579 Search PubMed.
- M. Rizzotto, A. Levina, M. Santoro, S. García, M. I. Frascaroli, S. Signorella, L. F. Sala and P. A. Lay, J. Chem. Soc., Dalton Trans., 2002, 3206–3213 RSC.
- V. Roldán, J. C. González, M. Santoro, S. García, N. Casado, S. Olivera, J. C. Boggio, J. M. Salas-Peregrin, S. Signorella and L. F. Sala, Can. J. Chem., 2002, 80, 1676–1686 CrossRef.
- S. Signorella, R. Lafarga, V. Daier and L. F. Sala, Carbohydr. Res., 2000, 324, 127–135 CrossRef PubMed.
- S. Signorella, M. I. Frascaroli, S. García, M. Santoro, J. C. González, C. Palopoli, V. Daier, N. Casado and L. F. Sala, J. Chem. Soc., Dalton Trans., 2000, 1617–1623 RSC.
- M. Rizzotto, V. Moreno, S. Signorella, V. Daier and L. F. Sala, Polyhedron, 2000, 19, 417–423 CrossRef.
- M. I. Frascaroli, J. M. Salas-Peregrin, L. F. Sala and S. Signorella, Polyhedron, 2009, 28, 1049–1056 CrossRef.
- J. C. González, S. I. García, S. Bellú, A. M. Atria, J. M. Salas Peregrin, A. Rockenbauer, L. Korecz, S. Signorella and L. F. Sala, Polyhedron, 2009, 28, 2719–2729 CrossRef.
- S. E. Bellú, J. C. González, S. I. García, S. Signorella and L. F. Sala, J. Phys. Org. Chem., 2008, 21, 1059–1067 CrossRef.
- M. F. Mangiameli, J. C. González, S. Bellú, F. Bertoni and L. F. Sala, Dalton Trans., 2014, 43, 9242 RSC.
- S. Santos, C. Freire, M. Domingues, A. Silvestre and C. Pascoal, J. Agric. Food Chem., 2011, 59(17), 9386–9393 CrossRef PubMed.
- J. A. Rivera, Forum Café, http://www.forumdelcafe.com/sites/default/files/biblioteca/f-45_alquimia_tueste_cafe_0.pdf.
- R. M. Sedman, J. Beaumont, T. A. McDonald, S. Reynolds, G. Krowech and R. Howd, J. Environ. Sci. Health, Part C: Environ. Carcinog. Ecotoxicol. Rev., 2006, 24, 155–182 CrossRef PubMed.
- K. Salnikow and A. Zhitkovich, Chem. Res. Toxicol., 2008, 21, 28–44 Search PubMed.
- A. K. Patlolla, C. Barnes, C. Yedjou, V. R. Velma and P. B. Tchounwou, Environ. Toxicol., 2009, 24(1), 66–73 CrossRef PubMed.
- W. Maret and A. Wedd, Binding Transport and Storage of Metal Ions in Biological Cells, Science, 2014, p. 202, https://books.google.com.ar/books?isbn=1849735999 Search PubMed.
- S. M. Roberts, J. P. Kehrer and L. Klotz, Studies on Experimental Toxicology and Pharmacology, Science, 2015, ch. 9, p. 175, https://books.google.com.ar/books?isbn=3319190962 Search PubMed.
- A. Yokoyama, K. Cho, K. D. Karlin and W. Nam, J. Am. Chem. Soc., 2013, 135(40), 14900–14903, DOI:10.1021/ja405891n.
- S. K. Panda and S. Choudhury, Braz. J. Plant Physiol., 2005, 17(1), 95–102 CrossRef.
- R. Codd, P. A. Lay and A. Levina, Inorg. Chem., 1997, 36, 5440–5448 CrossRef.
- R. Saha, R. Nandi and B. Saha, J. Coord. Chem., 2011, 64(10), 1782–1806 CrossRef.
- R. Codd and P. A. Lay, J. Am. Chem. Soc., 1999, 121, 7864–7876 CrossRef.
- A. Al-Ajlouni, A. Bakac and J. H. Espenson, Inorg. Chem., 1994, 33, 1011–1014 CrossRef.
- O. A. Babich and E. S. Gould, Inorg. Chem., 2001, 40, 5708–5710 CrossRef PubMed.
- International Agency for Research on Cancer (IARC), IARC Monogr. Eval. Carcinog. Risks Hum., Lyon, France, 1990, vol. 49, Updated 1997 Search PubMed.
- R. Feldam, in Occupational and Environmental Neurotoxicology, Lippincott-Raven Publishers, Philadelphia, 1999 Search PubMed.
- F. Hasan and J. Rocek, J. Am. Chem. Soc., 1972, 94, 9073–9081 CrossRef.
- S. Scott, A. Bakac and J. Espenson, J. Am. Chem. Soc., 1992, 114, 4205–4213 CrossRef.
- S. Scott, A. Bakac and J. Espenson, J. Am. Chem. Soc., 1991, 113, 7787–7788 CrossRef.
- P. A. Lay and A. Levina, J. Am. Chem. Soc., 1998, 120, 6704–6714 CrossRef.
- J. Pérez Benito, C. Arias and D. Lamrhari, New J. Chem., 1994, 18, 663–666 Search PubMed.
- J. Pérez Benito and C. Arias, Can. J. Chem., 1993, 71, 649–655 CrossRef.
- A. B. P. Lever, in Inorganic Electronic Spectroscopy, Elsevier, Amsterdam, 2nd edn, 1984, p. 419 Search PubMed.
- M. Mitewa and P. Bontchev, Coord. Chem. Rev., 1985, 61, 241–272 CrossRef.
- A. Al-Ajlouni, A. Bakac and J. H. Espenson, Inorg. Chem., 1994, 33, 1011–1014 CrossRef.
- J. C. González, S. García, N. Mamana, L. F. Sala and S. Signorella, Inorg. Chem. Commun., 2006, 9, 437–440 CrossRef.
- A. Nemes and A. Bakac, Inorg. Chem., 2001, 40, 2720–2724 CrossRef PubMed.
- J. H. Espenson, in Chemical Kinetcis and Reactions Mechanism, Mc Graw Hill, New York, 2nd edn, 2002 Search PubMed.
- R. Codd, C. T. Dillon, A. Levina and P. A. Lay, Coord. Chem. Rev., 2001, 216/217, 537–577 CrossRef.
- N. E. Brasch, D. A. Buckingham, A. B. Evans and C. R. Clark, J. Am. Chem. Soc., 1996, 118, 7969–7980 CrossRef.
- O. Pestovsky, A. Bakac and J. H. Espenson, J. Am. Chem. Soc., 1998, 120, 13422–13428 CrossRef.
Footnote |
| † Electronic supplementary information (ESI) available. See DOI: 10.1039/c8ra03809k |
| This journal is © The Royal Society of Chemistry 2018 |


