 Open Access Article
Nut-like MOF/hydroxylated graphene hybrid materials for adsorptive desulfurization of thiophene†
Ke Yang‡
 *,
Yu Yan‡,
Wen Chen,
Hongtao Kang,
Yi Han,
Wenquan Zhang,
Yafeng Fan and
Zhenxing Li
 *
*
State Key Laboratory of Heavy Oil Processing, Institute of New Energy, China University of Petroleum-Beijing, Beijing, 102249, P. R. China. E-mail: yangke@cup.edu.cn
First published on 29th June 2018
Abstract
Nowadays, sulfur compounds in fuel oils are the main source of environmental pollution and ultra-deep desulfurization of fuel oils has become a top priority. Many porous materials such as activated carbon and metal–organic frameworks (MOFs) have attracted attention in the field of adsorption desulfurization in recent years. A series of novel MOF/hydroxylated graphene hybrid materials were successfully designed and synthesized with different ratios for application in the field of ADS. The hydroxylated graphene (HG) was found dispersed not just on the surface but also inserted in the MOF crystals in what we call a nut-like structure. It was found that the introduction of a small amount (<8%) of HG does not hinder the formation of the Cu-BTC structure. Meanwhile, the adsorption performances of these composites for thiophene from oils were evaluated using batch adsorption tests at room temperature. The synergistic effect between Cu-BTC and HG in the hybrid materials can improve the adsorption capacity for thiophene molecules. The experimental equilibrium curve fitted well with the theoretical Langmuir isotherm model. The maximum sulfur adsorption capacity of 35.6 mg S g−1 for the hybrid materials was calculated using the Langmuir adsorption equation, which increased by 48% compared to parent Cu-BTC. Thus, these hybrid materials have great potential for application in the adsorptive desulfurization process, especially for thiophenic compounds.
1 Introduction
Recently, ultra-deep desulfurization technology for fuel oils has become a hot point for the petroleum refining industry owing to increasingly stringent emission standards.1,2 According to US guidelines, the sulfur content in fuel oils should be controlled to be less than 10 ppm from January 1, 2017.3 Hydrodesulfurization (HDS), as the most widely used technology in the industry, can effectively remove nonaromatic sulfur compounds, but is challenged by more sterically hindered thiophene and thiophene derivatives.4 More importantly, HDS is not suitable for ultra-deep desulfurization due to the high requirements of the operating conditions (high temperature and pressure), extra H2 consumption and octane number loss.5 To achieve ultra-deep desulfurization, adsorptive desulfurization (ADS) is considered one of the most promising alternative technologies to HDS with several advantages such as mild operation conditions and low energy consumption.6–10To date, various adsorbents such as porous carbon materials11–13 and zeolites14 have been successfully applied to the ADS field with good desulfurization performances. Recently MOFs, as a new type of porous material, have attracted researchers’ interest in the field of adsorption and separation due to their excellent properties such as high porosity, versatile chemistry, diverse topology/connectivity and structural flexibility.15 Cychosz et al.16 reported the adsorptive behavior of five different MOFs for thiophenic compounds for the first time. Their results showed that the desulfurization capacities of MOFs were all better than Na–Y zeolites. Afterwards, a vast amount of literature reported on MOFs as extraordinary adsorbent candidates for ADS.17,18 Moreover, the adsorption properties can be further improved by integrating carbon materials8,19–23 or metal nanoparticles.24–27 Petit et al.28 successfully synthesized a novel MOF–graphite oxide (GO) composite structure and found the synergistic effect between MOF-5 and GO sheets. This composite had a larger adsorption capacity compared to the parent material. They then synthesized Cu-BTC/GO composites and used them to remove hydrogen sulfide (H2S).29 Combining with dense graphene could improve the density of the parent Cu-BTC, resulting in an increase of the dispersive forces for adsorbing H2S molecules. Shi et al.30 modified Cu-BTC by incorporating AC during its synthesis process to enhance the desulfurization performance for H2S and dimethyl sulfide. This enhancement effect is attributed to a greater number of coordinatively unsaturated sites (CUS) in the composites. Ahmed et al.31 synthesized GO/MIL-101 composites and found that these adsorbents have larger adsorption capacities for nitrogen-containing compounds and sulfur-containing compounds than parent MIL-101.
In this work, we first synthesized a series of novel Cu-BTC/HG hybrid materials using a hydrothermal method and tested their adsorption performances for thiophene from oils. Firstly, Cu-BTC was selected as a candidate due to its simple synthesis method and relatively good stability among MOFs and its excellent intrinsic desulfurization properties. Then the HG was synthesized, as an incorporation material, possessing features such as a hydroxyl-containing surface and relative hydrophobicity compared to MOFs, which can produce a synergistic effect with Cu-BTC to further improve the desulfurization performance. The textural characterization of these hybrid materials was performed using XRD, N2 adsorption, SEM/EDS, FT-IR, Raman spectroscopy and TG analysis. To understand the desulfurization behavior of these novel adsorbents, liquid-phase batch adsorption experiments were performed and compared at room temperature and under atmospheric pressure.
2 Experimental
2.1 Materials
N,N-Dimethylformamide (DMF, AR, 99%) and copper nitrate hemipentahydrate, Cu(NO3)2·3H2O (AR, 99%), were purchased from Tianjin Fuchen Chemicals Co., Ltd. (Tianjin, China). 1,3,5-Benzenetricarboxylic acid (H3BTC) was supplied by Aladdin Reagent Co., Ltd. (Shanghai, China). Graphene was purchased from JCNANO Tech Co., Ltd. (Nanjing, China).2.2 Synthesis of materials
Cu-BTC was prepared using a hydrothermal method as reported previously with slight changes.32 Firstly, 0.24 g of Cu(NO3)2·3H2O was dissolved in 12 mL of deionized water. 0.18 g of H3BTC was dissolved into a mixture of 12 mL of ethanol and 12 mL of DMF. Then, the two solutions were mixed and stirred for 10 min at room temperature as Cu-BTC precursors. The mixture was transferred into a 50 mL Teflon-lined stainless steel autoclave and heated at 80 °C for 24 h. After cooling, blue crystals were separated by centrifugation and washed three times using DMF and ethanol separately. The products were then dried at 120 °C in a vacuum for 12 h.The synthesis of HG was carried out according to a previously reported method.33 0.4 g of graphene was dissolved in 16 mL of aqueous NaOH solution (2 M) with the aid of ultrasonication for 1 h at room temperature. Then, the mixture was transferred into a Teflon-lined stainless steel autoclave with a capacity of 20 mL and heated at 180 °C for 2 h. Following this, the mixture was washed with methanol until the pH reached 7.0 and the products were then dried at 50 °C in a vacuum for 12 h.
The Cu-BTC/HG hybrid materials were prepared by adding HG powder to well-dissolved Cu-BTC precursors. The composites are referred to as MGr-n with n = 1, 2, 3, 4 and 5 for different amounts of HG (2, 4, 6, 8 and 10% HG, respectively). Firstly, 4.08 mg, 8.16 mg, 12.24 mg, 16.32 mg or 20.4 mg of HG was added to the Cu-BTC precursor solution. Then the resulting mixture was sonicated for 5 min and stirred for another 20 min at room temperature. Next, the same synthesis procedure as that for Cu-BTC was carried out.
2.3 Characterization techniques
2.4 Batch adsorption test
Liquid-phase batch adsorption experiments were carried out in 50 mL glass vials. The thiophene was dissolved in isooctane with different initial sulfur concentrations (50–550 ppmw) as model oil. In a typical experiment, 50 mg of adsorbent and 5 mL of model oil were mixed and placed in a temperature-controlled shaker for 12 h at 25 °C. The liquid phase was then separated from the adsorbents by filtration. The filtration process was performed using a Buchner funnel with qualitative filter paper (maximum pore size < 1 μm). The sulfur concentrations were directly determined using a gas chromatography-flame ionization detector (GC-FID, Agilent-5977A, HP-5, 0.32 mm × 30 mm) and a fluorescent sulfur analyzer (KY-3000S). Prior to the adsorption experiments, all samples were degassed in a vacuum at 150 °C for 12 h to remove water and other contaminants in the adsorbents. The adsorption capacity was calculated using the following formula:where q is the adsorption capacity of the adsorbent (mg S per g adsorbent), v is the volume of model oil and m is the mass of adsorbent. C0 and Ce are the initial and equilibrium sulfur concentrations in the model oils (ppm), respectively.
2.5 Regeneration experiment
The regeneration process of the adsorbents was performed using solvent washing and thermal treatment methods. Firstly, all samples were washed and soaked with ethanol several times until the sulfur content in the filtrate ethanol solution reached zero. Then the adsorbents were dried in a vacuum at 150 °C overnight. The regenerated adsorbents were retested for the adsorption of thiophene.3 Results and discussion
3.1 Characterization of materials
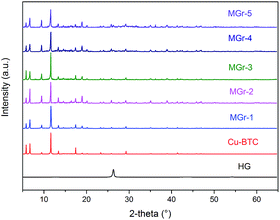
The XRD patterns of the HG, Cu-BTC and MGr-n composites are shown in Fig. 1. The XRD pattern of Cu-BTC is in accordance with those reported before.34 HG displayed a broad and weak peak located at 26.4°, which is assigned to an interlayer distance (d002) of carbon and agrees with previous reports.19,21,33,35 For the XRD patterns of the MGr-n composites, the diffraction peaks are similar to those of Cu-BTC, indicating that the introduction of HG does not prevent the formation of the Cu-BTC crystal structure in the hybrid materials. It was noted that the peak intensities of the MGr-1, 2 and 3 composites were slightly stronger than those of Cu-BTC. This result indicates a better crystallization and more orderly arrangement in the hybrid materials, which may be due to the template effects caused by the presence of HG in the Cu-BTC synthesis process.36 The peak intensities of the hybrid materials become weaker when the HG content is more than 6% because an excessive amount of HG is not conducive to the crystallization of materials. In addition, the emergence of peaks at 26.4° for the MGr-3, 4 and 5 composites indicates that there was a small amount of HG that did not exfoliate in the synthesis process of the hybrid materials. This phenomenon is slightly different with GO.37The right part of Fig. 2 illustrates the material synthesis process. Firstly, HG was obtained using an ultrasound-assisted method under alkaline conditions and a hydrothermal method. Next, when HG is mixed into a Cu(NO3)2 solution, the Cu2+ ion can be anchored on its surface by coordinating with the oxygen-containing functional groups of HG and then became nucleation sites to promote Cu-BTC crystal growth.38 The morphology texture of HG, Cu-BTC and the MGr-n composites can be clearly observed in SEM images. For HG, the sheet-like shape can be easily recognized (Fig. 2a). It shows a wrinkled surface, which is significantly different to the parent Cu-BTC crystal with a clear octahedral structure (Fig. 2b). The EDS elemental mapping images of HG show a homogenous distribution of C and O in the HG (shown in Fig. S1†). The sizes of Cu-BTC and these hybrid materials are mainly distributed around 5–10 μm. In the case of the MGr-n composites, the Cu-BTC still retains the octahedral morphology but with a rough surface. It was observed that the exfoliated HG sheets cover the surface of Cu-BTC, which leads the Cu-BTC crystal surface to become rippled and curled without destroying the structure (Fig. 2c and d). With increasing HG content, the crystal structure begins to become slightly incomplete and can be observed with obvious roughness and folds on the surface of the materials. For the SEM of the MGr-3 composite (Fig. 2e and f), it is interesting to find that some layered structures are present in the crystal structure, which is similar to the Cu-BTC/GO or MOF-5/GO composites reported in previous literature.39,40 This unique composite structure can be interpreted as the result of alternated growth of Cu-BTC and HG layers. Even when the HG was observed to be introduced into the crystal structure, there seemed to be no significant effect on the morphology and size of the Cu-BTC. It was found that the HG was not just dispersed on the surface but also inserted into the MOF crystals, which is like a nut structure, and the possible interactions between Cu-BTC and HG are shown in Fig. S2.† This phenomenon is different to some other hybrid materials which show serious changes in morphology and size when mixed with GO in the synthesis process.41,42 In addition, the EDS analyses for Cu-BTC and the MGr-5 composite are presented in Fig. S3 and S4.†
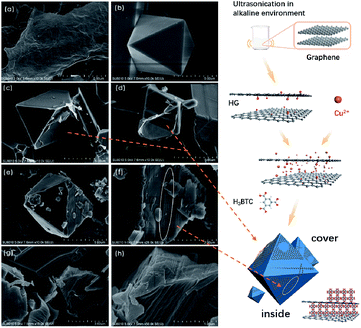 | ||
| Fig. 2 SEM images of (a) HG, (b) Cu-BTC, (c) MGr-1, (d) MGr-2, (e and f) MGr-3 and (g and h) MGr-4, and the synthesis process of the Cu-BTC/HG composites. | ||
Fig. 3 shows N2 adsorption–desorption isotherms and pore size distribution graphs of the materials. It is evident that HG exhibits Type-III isotherms with a Type H3 hysteresis loop, corresponding to a nonporous and lamellar aggregate structure of HG. The Cu-BTC shows Type-I isotherms, which means it is a typical microporous material. For the hybrid materials, there was a large adsorption capacity at low pressure and a low adsorption capacity at high pressure with a small Type H4 hysteresis loop, indicating the presence of a large number of micropores with a few mesopores in the materials. The pore size distributions of Cu-BTC and the MGr-n composites were calculated according to the NLDFT theory, and it was found that the pore sizes are mainly distributed from 0.5 to 0.6 nm and 0.7 to 0.9 nm, respectively.
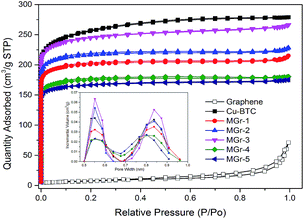 | ||
| Fig. 3 N2 adsorption–desorption isotherms (77 K) and pore diameter distribution (NLDFT) of the samples. | ||
The textural parameters of the samples are listed in Table 1. The BET surface area of Cu-BTC was found to be 968 m2 g−1, which is similar to that reported in previous literature.43 It could be found that the surface areas of the hybrid materials were all lower than that of parent Cu-BTC. The values of the ratio between micropore volume and total pore volume also decreased, especially for the MGr-3 composite, which may be due to the formation of new mesopores between the Cu-BTC crystals and the HG sheets. It is worth noting that the MGr-3 composite exhibited a greater pore volume than parent Cu-BTC and the other hybrid materials. However, the beneficial effect on the porous structure began to vanish with increasing HG content for the MGr-4 and 5 composites.
| Sample | SBET (m2 g−1) | Pore volume (cm3 g−1) | ||
|---|---|---|---|---|
| Vmicro | Vmeso | Vtotal | ||
| HG | 26 | — | — | — |
| Cu-BTC | 968 | 0.335 | 0.050 | 0.385 |
| MGr-1 | 801 | 0.274 | 0.047 | 0.321 |
| MGr-2 | 863 | 0.296 | 0.048 | 0.344 |
| MGr-3 | 962 | 0.318 | 0.072 | 0.405 |
| MGr-4 | 700 | 0.218 | 0.037 | 0.255 |
| MGr-5 | 669 | 0.225 | 0.043 | 0.268 |
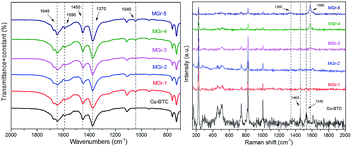
FT-IR and Raman spectra of all samples are presented in Fig. 4. In the case of HG, the two wide bands at around 3100 to 3600 cm−1 and 1630 cm−1 indicate the presence of the hydroxyl vibrations of the C–OH groups (shown in Fig. S5†).44–46 The peaks between 1300 and 1700 cm−1 correspond to the characteristic signals of the Cu sites and BTC ligands in Cu-BTC. Compared with parent Cu-BTC, a new band at 1040 cm−1 becomes obvious with increasing HG content, owing to the vibration of C–O in HG. In addition, there were slight changes in the intensity ratios of the asymmetric and symmetric stretching vibrations of carboxylate groups at 1645/1590 cm−1 and 1450/1370 cm−1 respectively. This suggests that the environment of the carboxylate groups in the BTC ligands changes.40 This can be explained by the appearance of coordination bonds between the hydroxyl groups of HG and Cu2+, which hinders some carboxylate groups in the ligands that would normally coordinate with the central metal.
The Raman spectrum of parent Cu-BTC was in agreement with the literature reported before.38,47,48 The peaks observed at 1360 cm−1 (D band) and 1585 cm−1 (G band) correspond to the characteristic signals of sp3 and sp2 hybridization of C atoms, respectively. It can be seen that the intensities of the D band and the G band were distinctly enhanced with increasing HG content. In addition, the peaks at 1460 cm−1 and 1540 cm−1 represent the symmetric and asymmetric stretching vibrations of C–O2, respectively. For the MGr-n composites, the intensity of these two peaks almost disappeared, indicating that the environment may have changed between the Cu2+ and the BTC ligands.49
The parent Cu-BTC and MGr-3 composite were selected as two representative materials to investigate thermodynamic weightlessness characteristics under an argon flow. The TG and DTG curves of Cu-BTC and the MGr-3 composite are shown in Fig. 5. For Cu-BTC, the peaks at ∼100 °C and ∼180 °C are related to the removal of water that is physically adsorbed in pores and coordinated to the central metal of Cu-BTC, respectively. Finally, the second weight loss occurred from 300–350 °C, owing to the decomposition of the BTC ligands and secondary building units in Cu-BTC, which indicates a complete collapse of the MOF structure.50 In the case of the MGr-3 composite, the intensities of the peaks are decreased significantly at ∼100 °C and ∼180 °C, indicating that the hybrid materials are relatively more hydrophobic compared to parent Cu-BTC. In addition, it is easy to see that the weight loss temperature and number of peaks are different to those of Cu-BTC, which indicate some changes in the chemical environment and better thermal stability for the hybrid materials.40
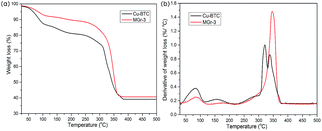 | ||
| Fig. 5 TG and DTG curves for Cu-BTC and the MGr-3 composite from 25 to 500 °C under an argon atmosphere. | ||
3.2 Desulfurization capacity
The adsorption isotherms followed the Langmuir equation of thiophene and were plotted to study and compare the desulfurization performance of all samples. As shown in Fig. 6a, HG shows a poor desulfurization performance with a very low saturation adsorption value while Cu-BTC and the MGr-n composites exhibited excellent adsorption capacities for thiophene. In the case of the MGr-n composites, they show a steeper increase than Cu-BTC at low thiophene concentrations, indicating a higher affinity between thiophene and the adsorbents. At high concentrations, the adsorption capacities increase slowly, showing almost horizontal plateaus due to the near adsorption saturation of the materials.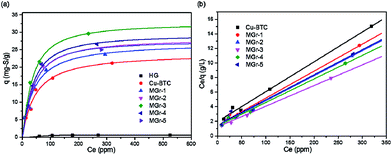 | ||
| Fig. 6 (a) Equilibrium adsorption isotherms at room temperature and (b) their corresponding Langmuir model plots for HG, Cu-BTC and MGr-n composites of thiophene from oils. | ||
The maximum adsorption sulfur capacity (Q0) can be estimated by plotting Ce/q against Ce and the linear straight lines show that the experimental results conform to the Langmuir model perfectly, as shown in Fig. 6b (the calculation method can be found in the ESI† and the linear Langmuir curve of HG is shown in Fig. S6†). The Q0 of thiophene for all samples is summarized in Table 2. The order of sulfur adsorption capacity for all samples is as follows: MGr-3 > MGr-4 > MGr-2 > MGr-5 > MGr-1 > Cu-BTC. Compared to the parent Cu-BTC, the MGr-n composites exhibit better desulfurization performances, especially the MGr-3 composite, whose Q0 reached up to 35.6 mg S g−1. It is worth noting that the improvement in the desulfurization effect does not increase linearly with the content of HG. The MGr-4 and 5 composites have a higher content of HG, but they showed relatively worse adsorption performances than the MGr-3 composite.
| Adsorbents | Measured | Hypothetical | ||
|---|---|---|---|---|
| Q0 (mg S per g) | b (L mg−1) | R | Q0H (mg S per g) | |
| HG | 0.73 | 0.01788 | 0.99316 | — |
| Cu-BTC | 24.1 | 0.02057 | 0.99714 | — |
| MGr-1 | 27.0 | 0.02497 | 0.99762 | 24.0 |
| MGr-2 | 29.2 | 0.02433 | 0.99746 | 23.5 |
| MGr-3 | 35.6 | 0.02277 | 0.99592 | 23.1 |
| MGr-4 | 31.0 | 0.02373 | 0.99711 | 22.6 |
| MGr-5 | 29.1 | 0.02278 | 0.99022 | 22.1 |
In order to estimate the desulfurization effect of HG in the hybrid materials, we hypothesized HG and Cu-BTC as a purely physical mixture and calculated the hypothetical maximum sulfur adsorption capacity with the following equation. The results are listed in Table 2.
| Q0H = QMOF × wt%MOF + QGr × wt%Gr |
If the two components were simply physically mixed, the desulfurization performance would be negatively correlated with HG content. However, it is clear that the measured maximum adsorption capacity of the MGr-n composites is higher than the hypothetical value, indicating that a synergistic effect exists between HG and Cu-BTC.
So far, the mechanism of adsorptive desulfurization with MOFs has mainly been explained by appropriate pore size,16 acid–base interaction of CUS,51,52 π-complexation53 and π–π stacking.54 In the case of Cu-BTC, it shows excellent desulfurization performance mainly due to suitable pore size and the presence of accessible CUS in the MOF crystal.16,52 As is well known, a large surface area contributes to the adsorption capacity of the adsorbents. For the MGr-n composites, due to a decrease in the surface area with the introduction of HG to Cu-BTC, the result that the desulfurization performance of the hybrid material is better than that of Cu-BTC cannot be explained simply by the porosity. In fact, the reason for the difference in the adsorption performance of the materials is not only due to the factors of pore size and volume of the adsorbent, but also the number of CUS in the MOFs.
The mechanism of ADS with MOFs can been explained by acid–base interactions between thiophene molecules and the CUS in MOFs and these interactions can be explained by the hard and soft acids and bases (HSAB) theory.55 According to the HSAB theory, soft or intermediate bases like sulfur compounds preferentially interact with soft or intermediate Lewis acid sites like Cu2+. Thiophene, with solitary electrons, exhibits alkaline characteristics and can be easily adsorbed on a CUS with an empty electron orbital in Cu-BTC or hybrid materials by acid–base interactions.
We have proved that the hydroxyl groups on the surface of HG sheets can immobilize the metal ion of Cu-BTC precursors. The participation of HG in the MOF crystal may affect the coordination of the central metal and ligands, which leads to some chemical environment changes for the central metal and CUS in the MOF crystal.36 Additionally, the HG in the hybrid materials can protect the CUS from being occupied by excess unreacted organic ligands and solvent molecules, resulting in more exposure of the CUS in MOFs.30,56 Additionally, most MOFs with metallic nodes are considered hydrophilic, and the adsorptive desulfurization capacity of Cu-BTC decreases rapidly in the presence of a small amount of water.36,51 HG can be considered hydrophobic due to the limited number of polar functional groups on its surface, which means it can retain a high level of aromaticity to repel water molecules.57 Thus, the HG in the MGr-n composites can help the materials become relatively hydrophobic, as evidenced by the DTG analysis, to reduce the negative impact of water on the sulfur adsorption capacity.
In addition to the above discussion, the pore size and volume of adsorbents also have an effect on the adsorption capacity. The micropore, whose size is bigger than a thiophene molecule, and the mesopore in the materials are both better for thiophene adsorption. As mentioned in the results of the pore diameter distribution, it is easy to see that the pore diameter is distributed around 0.83 nm for the low HG content structures (Cu-BTC, MGr-1, 2 and 3 composites). With the HG amount increasing (MGr-4 and 5 composites), the pore size of the composites decreases to around 0.8 nm and the pore volume also begins to decrease rapidly. The molecular size of thiophene is 0.56 × 0.77 nm, so it can enter the pores of Cu-BTC and the MGr-n composites. For the MGr-4 and 5 composites, the desulfurization capacity begins to decline due to the steric hindrance effect from the narrower pore size (∼0.8 nm) than those of the MGr-1, 2 and 3 composites, which have a relatively large pore size (∼0.83 nm). The number of suitable pores is also an important factor that affects the adsorption capacity of the materials. In addition, large pore volume can increase adsorption capacity further. The greater pore volume and suitable pore size of the MGr-3 composite lead it to have a better desulfurization performance than the other samples. Thus, an increasing number of adsorption sites and suitable pore size improve the desulfurization adsorption capacity. It is worth noting that the amount of incorporation of HG should be controlled to a suitable level in the hybrid materials to gain the best adsorption capacity.
3.3 Regeneration performance
The adsorbents are expected to be reused multiple times to reduce the cost. Therefore, it is important to investigate the regeneration performance of the adsorbent materials.52 In this study, we carried out solvent elution and thermal treatment to remove the thiophene from the adsorbents (Cu-BTC and MGr-3 composite). Firstly, the samples were washed and soaked with excess ethanol several times, until the sulfur content of the filtrate solution reached zero. Then the samples were dried in a vacuum at 150 °C overnight and the regenerated adsorbents were retested for the adsorption of thiophene. The desulfurization performance of the regenerated samples is shown in Fig. 7. In comparison to fresh Cu-BTC and MGr-3 composite, the sulfur adsorption capacity of the fifth regeneration decreases by 8.0% and 7.8% respectively. The XRD patterns of Cu-BTC and the MGr-3 composite are shown in Fig. S7.† It can be seen that there are no significant changes in crystal structure compared to fresh Cu-BTC and MGr-3 composite after the fifth regeneration. This result shows that the regeneration performance of the MGr-3 composite is slightly better than that of Cu-BTC, but both show good renewability. Therefore, the adsorbents Cu-BTC and MGr-3 can be regenerated using a relatively simple method and reused at least five times.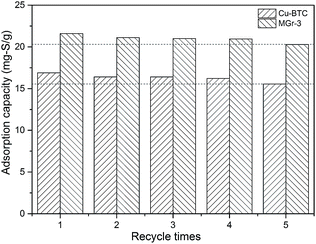 | ||
| Fig. 7 Regeneration performances of Cu-BTC and the MGr-3 composite for removing thiophene from oils (C0 = 277 ppm, at room temperature). | ||
4 Conclusions
In conclusion, composites of MGr-n were successfully synthesized using a hydrothermal method, and we found the introduction of HG has little effect on crystal structure and morphology of Cu-BTC. Meanwhile, with more CUS, relative hydrophobicity, increased pore volume and suitable pore size, the MGr-3 composite showed excellent desulfurization performance. A remarkable improvement in the adsorption capacity (∼48%) was observed in the MGr-3 composite compared to parent Cu-BTC. The improved adsorption performance can be explained by the synergistic effect between HG and Cu-BTC. Furthermore, the MGr-n composites exhibited good recyclability, with more than 90% of the sulfur adsorption capacity recovered after five cycles. In general, the high adsorption capacity and good regenerability make these hybrid materials promising adsorbents for thiophene removal. This work gives us a new idea to design novel structures of MOF hybrid materials and shows the potential of ADS in the future.Conflicts of interest
There are no conflicts to declare.Acknowledgements
We gratefully acknowledge funding support from the Science Foundation of China University of Petroleum (Beijing) (No. 2462016YJRC018) (K. Y.) and the National Natural Science Foundation of China (NSFC) (Grant No. 21501197) (Z. L.). K. Y. and Y. Y. contributed equally to this work.Notes and references
- T. A. Saleh, Applying Nanotechnology to the Desulfurization Process in Petroleum Engineering, 2015 Search PubMed.
- T. A. Saleh, Nanotechnology in Oil and Gas Industries: Principles and Applications, 2018 Search PubMed.
- United States Environmental Protection Agency, Gasoline Sulfur, http://www.epa.gov/gasoline-standards/gasoline-sulfur.
- T. Wang, Y. Fang, W. Dai, L. Hu, N. Ma and L. Yu, RSC Adv., 2016, 6, 105827–105832 RSC.
- T. Jin, S. An, X. Yang, J. Hu, H. Wang, H. Liu, Z. Tian, D.-e. Jiang, N. Mehio and X. Zhu, AIChE J., 2016, 62, 1740–1746 CrossRef.
- I. Ahmed and S. H. Jhung, J. Hazard. Mater., 2016, 301, 259–276 CrossRef PubMed.
- T. A. Saleh, J. Cleaner Prod., 2018, 172, 2123–2132 CrossRef.
- G. I. Danmaliki and T. A. Saleh, Chem. Eng. J., 2017, 307, 914–927 CrossRef.
- T. A. Saleh and G. I. Danmaliki, Process Saf. Environ. Prot., 2016, 102, 9–19 CrossRef.
- G. I. Danmaliki and T. A. Saleh, J. Cleaner Prod., 2016, 117, 50–55 CrossRef.
- M. Yu, N. Zhang, L. Fan, C. Zhang, X. He, M. Zheng and Z. Li, Rev. Chem. Eng., 2015, 31, 27–43 Search PubMed.
- J. Bu, G. Loh, C. G. Gwie, S. Dewiyanti, M. Tasrif and A. Borgna, Chem. Eng. J., 2011, 166, 207–217 CrossRef.
- T. A. Saleh, M. M. Al-Shalalfeh and A. A. Al-Saadi, Sci. Rep., 2016, 6, 32185 CrossRef PubMed.
- R. T. Yang, A. J. Hernándezmaldonado and F. H. Yang, Science, 2003, 301, 79–81 CrossRef PubMed.
- L. Hamon, H. Leclerc, A. Ghoufi, L. Oliviero, A. Travert, J.-C. Lavalley, T. Devic, C. Serre, G. Férey, G. De Weireld, A. Vimont and G. Maurin, J. Phys. Chem. C, 2011, 115, 2047–2056 CrossRef.
- K. A. Cychosz, A. G. Wong-Foy and A. J. Matzger, J. Am. Chem. Soc., 2008, 130, 6938–6939 CrossRef PubMed.
- B. Van de Voorde, B. Bueken, J. Denayer and D. De Vos, Chem. Soc. Rev., 2014, 43, 5766–5788 RSC.
- G. Blanco-Brieva, J. M. Campos-Martin, S. M. Al-Zahrani and J. L. G. Fierro, Fuel, 2011, 90, 190–197 CrossRef.
- Z. H. Huang, G. Liu and F. Kang, ACS Appl. Mater. Interfaces, 2012, 4, 4942–4947 CrossRef PubMed.
- L. Zhu, X. Jia, H. Bian, T. Huo, Z. Duan, Y. Xiang and D. Xia, New J. Chem., 2018, 42, 3840–3850 RSC.
- J.-X. Guo, Y.-F. Qu, S. Shu, X.-J. Wang, H.-Q. Yin and Y.-H. Chu, New J. Chem., 2015, 39, 5997–6015 RSC.
- R. Menzel, D. Iruretagoyena, Y. Wang, S. M. Bawaked, M. Mokhtar, S. A. Al-Thabaiti, S. N. Basahel and M. S. P. Shaffer, Fuel, 2016, 181, 531–536 CrossRef.
- G. I. Danmaliki, T. A. Saleh and A. A. Shamsuddeen, Chem. Eng. J., 2017, 313, 993–1003 CrossRef.
- S. Aslam, F. Subhan, Z. Yan, U. J. Etim and J. Zeng, Chem. Eng. J., 2017, 315, 469–480 CrossRef.
- Y. N. Prajapati and N. Verma, Fuel, 2017, 189, 186–194 CrossRef.
- T. A. Saleh, K. O. Sulaiman, S. A. Al-Hammadi, H. Dafalla and G. I. Danmaliki, J. Cleaner Prod., 2017, 154, 401–412 CrossRef.
- A. A. Alshaheri, M. I. M. Tahir, M. B. A. Rahman, T. B. S. A. Ravoof and T. A. Saleh, Chem. Eng. J., 2017, 327, 423–430 CrossRef.
- C. Petit and T. J. Bandosz, Adv. Funct. Mater., 2010, 20, 111–118 CrossRef.
- C. Petit, B. Mendoza and T. J. Bandosz, ChemPhysChem, 2010, 11, 3678–3684 CrossRef PubMed.
- R.-H. Shi, Z.-R. Zhang, H.-L. Fan, T. Zhen, J. Shangguan and J. Mi, Appl. Surf. Sci., 2017, 394, 394–402 CrossRef.
- I. Ahmed, N. A. Khan and S. H. Jhung, Inorg. Chem., 2013, 52, 14155 CrossRef PubMed.
- J. L. C. Rowsell and O. M. Yaghi, J. Am. Chem. Soc., 2006, 128, 1304 CrossRef PubMed.
- C. Zu and A. Manthiram, Adv. Energy Mater., 2013, 3, 1008–1012 CrossRef.
- J. L. C. Rowsell and O. M. Yaghi, J. Am. Chem. Soc., 2006, 128, 1304–1315 CrossRef PubMed.
- P. Gong, J. Wang, W. Sun, D. Wu, Z. Wang, Z. Fan, H. Wang, X. Han and S. Yang, Nanoscale, 2014, 6, 3316–3324 RSC.
- X.-W. Liu, T.-J. Sun, J.-L. Hu and S.-D. Wang, J. Mater. Chem. A, 2016, 4, 3584–3616 RSC.
- D. Cai and M. Song, J. Mater. Chem., 2007, 17, 3678–3680 RSC.
- C. Petit, B. Mendoza, D. O’Donnell and T. J. Bandosz, Langmuir, 2011, 27, 10234–10242 CrossRef PubMed.
- C. Petit and T. J. Bandosz, Adv. Mater., 2009, 21, 4753–4757 CrossRef.
- C. Petit, J. Burress and T. J. Bandosz, Carbon, 2011, 49, 563–572 CrossRef.
- X. Sun, Q. Xia, Z. Zhao, Y. Li and Z. Li, Chem. Eng. J., 2014, 239, 226–232 CrossRef.
- Q. Wang, Y. Yang, F. Gao, J. Ni, Y. Zhang and Z. Lin, ACS Appl. Mater. Interfaces, 2016, 8, 32477–32487 CrossRef PubMed.
- C. Petit and T. J. Bandosz, Dalton Trans., 2012, 41, 4027–4035 RSC.
- X. Wang, A. Linjie Zhi and K. Müllen, Nano Lett., 2008, 8, 323 CrossRef PubMed.
- C. Petit, M. Seredych and T. J. Bandosz, J. Mater. Chem., 2009, 19, 9176–9185 RSC.
- T. A. Saleh, A. Sarı and M. Tuzen, Chem. Eng. J., 2017, 307, 230–238 CrossRef.
- M. M. Al-Shalalfeh, T. A. Saleh and A. A. Al-Saadi, RSC Adv., 2016, 6, 75282–75292 RSC.
- K. Haruna, T. A. Saleh, M. K. Hossain and A. A. Al-Saadi, Chem. Eng. J., 2016, 304, 141–148 CrossRef.
- Y. Zhao, M. Seredych, Q. Zhong and T. J. Bandosz, RSC Adv., 2013, 3, 9932 RSC.
- B. Levasseur, C. Petit and T. J. Bandosz, ACS Appl. Mater. Interfaces, 2010, 2, 3606–3613 CrossRef PubMed.
- L. Wu, J. Xiao, Y. Wu, S. Xian, G. Miao, H. Wang and Z. Li, Langmuir, 2014, 30, 1080–1088 CrossRef PubMed.
- D. Peralta, G. Chaplais, A. Simon-Masseron, K. Barthelet and G. D. Pirngruber, Energy Fuels, 2012, 26, 4953–4960 CrossRef.
- N. A. Khan and S. H. Jhung, Angew. Chem., Int. Ed., 2012, 51, 1198–1201 CrossRef PubMed.
- T. H. Park, K. A. Cychosz, A. G. Wong-Foy, A. Dailly and A. J. Matzger, Chem. Commun., 2011, 47, 1452–1454 RSC.
- R. G. Pearson, J. Am. Chem. Soc., 1963, 85, 3533–3539 CrossRef.
- P. B. S. Rallapalli, M. C. Raj, D. V. Patil, K. P. Prasanth, R. S. Somani and H. C. Bajaj, Int. J. Energy Res., 2013, 37, 746–753 CrossRef.
- C. Petit, B. Levasseur, B. Mendoza and T. J. Bandosz, Microporous Mesoporous Mater., 2012, 154, 107–112 CrossRef.
Footnotes |
| † Electronic supplementary information (ESI) available. See DOI: 10.1039/c8ra03834a |
| ‡ These authors contributed equally. |
| This journal is © The Royal Society of Chemistry 2018 |


