 Open Access Article
Creative Commons Attribution 3.0 Unported Licence
CuFe2S3 as electrode material for Li-ion batteries
Emmanuel Anger,
Antoine Maignan,
Tristan Barbier and
Valerie Pralong *
*
Normandie Univ, ENSICAEN, UNICAEN, CNRS, CRISMAT, 14000 Caen, France. E-mail: valerie.pralong@ensicaen.fr
First published on 26th July 2018
Abstract
Electrochemical performances of the isocubanite CuFe2S3 tested as electrode material for Li-ion batteries have been investigated. A first discharge capacity of 860 mA h g−1 shows a conversion process leading to Li2S, copper and iron nanoparticles. Interestingly, a reversible capacity of 560 mA h g−1 at 1.5 V is demonstrated with good cyclability up to 30 cycles.
Because of their low cost and high theoretical capacity, metal sulfides are considered as one potential future electrode material for Li-ion batteries (LIBs). Therefore, numerous materials containing sulfur have been studied in the last decades as cathode materials such as MnS,1 CuxS,2 CoS,3 NiS,4 and FexS.5 Moreover, some metal sulfides have also been reported as anode materials such as SnS2 (ref. 6) and ZnS.7 Their reductions happen through a conversion process at low working voltage (under 1 V vs. Li+/Li) leading to formation of lithium sulfide and native metal.8
Among the conversion materials based on transition metal sulfur, copper and iron are the most cost effective, light and non-toxic elements that one can find. For these reasons, CuxS2,9,10 and FexS5,11,12 have been well studied in the last few decades using either polymer or liquid electrolytes. From these studies, we know that the reduction of these transition metal sulfides forms nanoparticles of metal and lithium sulfides through a conversion process.8 Therefore, recent articles have been focusing on improving the electrochemical performance of metal sulfides by using hydrothermal,11 sol–gel13 or ball-milling14 synthetic methods.
Copper/iron sulfides are interesting electrode materials because of their higher electrical conductivity and electrochemical activity compared to monometal sulfides.15 In recent years, only a few studies have been reported on chalcopyrite CuFeS2, first as a cathode in a primary battery16 then as an anode and cathode in a secondary battery.15,17,18 Different synthetic routes from solvothermal to nanocrystal growth and different electrolytes have proven the potential of chalcopyrite as electrode material for lithium batteries.
Herein, we report the electrochemical performance of the cubic cubanite, so-called isocubanite CuFe2S3, as the first ternary metal sulfide electrode material for lithium batteries. This Li/CuFe2S3 system exhibits a high reversibility (up to 560 mA h g−1 at C/20/Li) and a good cyclability over 30 cycles. Ex situ X-ray diffraction (XRD)† measurements allow a better understanding of the electrochemical mechanism.
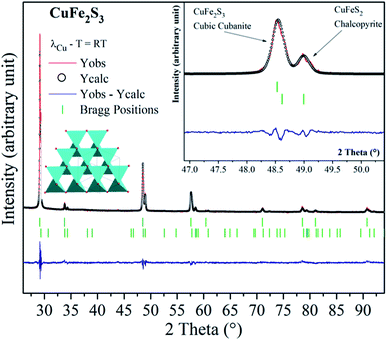
The cubanite CuFe2S3 phase crystallizes within an orthorhombic structure (space group: Pcmn), with a = 6.467 Å, b = 11.110 Å and c = 6.230 Å.19 When the orthorhombic CuFe2S3 is heated above 473 K, an irreversible structural transition occurs and CuFe2S3 adopts a cubic structural type (space group: F![[4 with combining macron]](https://www.rsc.org/images/entities/char_0034_0304.gif) 3m, a = 5.296 Å). It should be noticed that cubanite and its cubic polymorph isocubanite are usually found in their natural states intimately intergrown with other sulfides such as chalcopyrite and pyrrhotite. Synthesis of isocubanite CuFe2S3 has been first reported by S. Pareek et al.20 In this paper, we chose a synthetic protocol recently described by Barbier et al.21 Following precursors: Cu (99.0%), Fe (99.5%), and S (99.5%) from Alfa Aesar, were mixed in the appropriate ratio. After sealing the cold pressed powder in a silica tube, the latter was heated at 873 K for 48 h. The room temperature powder X-ray diffraction pattern of CuFe2S3 (depicted in Fig. 1) shows that CuFe2S3 crystallizes within the cubic form. Rietveld refinements were therefore carried out using F
3m, a = 5.296 Å). It should be noticed that cubanite and its cubic polymorph isocubanite are usually found in their natural states intimately intergrown with other sulfides such as chalcopyrite and pyrrhotite. Synthesis of isocubanite CuFe2S3 has been first reported by S. Pareek et al.20 In this paper, we chose a synthetic protocol recently described by Barbier et al.21 Following precursors: Cu (99.0%), Fe (99.5%), and S (99.5%) from Alfa Aesar, were mixed in the appropriate ratio. After sealing the cold pressed powder in a silica tube, the latter was heated at 873 K for 48 h. The room temperature powder X-ray diffraction pattern of CuFe2S3 (depicted in Fig. 1) shows that CuFe2S3 crystallizes within the cubic form. Rietveld refinements were therefore carried out using F![[4 with combining macron]](https://www.rsc.org/images/entities/char_0034_0304.gif) 3m space group. However, extra peaks and peak shoulders which may be attributed to the chalcopyrite phase can be observed (inset Fig. 1). Thus, from the refinements, the CuFe2S3 isocubanite (around 72 wt% – 63 at%) is the majority phase, while the minority one is the chalcopyrite (around 28 wt% – 37 at%). The structural refinement leads to unit cell parameters a = 5.3018(1) Å and a = 5.2927(3) Å, c = 10.4340 Å for the isocubanite and chalcopyrite phases, respectively. The aforementioned unit cell parameters are close to those reported in the literature and then confirms their good crystallinity.22 The isocubanite structure can be described as a tetragonal close-packed stacking of S2− anions, which occupy the 4a (0, 0, 0) crystallographic site while Cu and Fe cations are randomly distributed over the two structurally equivalent tetrahedral sites 4c (1/4, 1/4, 1/4) and 4d (3/4, 3/4, 3/4). Different Rietveld refinements were therefore performed with both 4c and 4d crystallographic sites, and best result through low isotropic displacement parameters and reliability factors (χ2 = 2.303 and RBragg factor = 6.98%) was obtained with all Cu and Fe atoms on the 4d crystallographic site. Although the obtained sample is intergrown with chalcopyrite; as previously studied, the chalcopyrite phase forms submicronic domains, this isocubanite sample is well crystallized.21 Note that the average particle size is about 1–2 μm without any particular shape.
3m space group. However, extra peaks and peak shoulders which may be attributed to the chalcopyrite phase can be observed (inset Fig. 1). Thus, from the refinements, the CuFe2S3 isocubanite (around 72 wt% – 63 at%) is the majority phase, while the minority one is the chalcopyrite (around 28 wt% – 37 at%). The structural refinement leads to unit cell parameters a = 5.3018(1) Å and a = 5.2927(3) Å, c = 10.4340 Å for the isocubanite and chalcopyrite phases, respectively. The aforementioned unit cell parameters are close to those reported in the literature and then confirms their good crystallinity.22 The isocubanite structure can be described as a tetragonal close-packed stacking of S2− anions, which occupy the 4a (0, 0, 0) crystallographic site while Cu and Fe cations are randomly distributed over the two structurally equivalent tetrahedral sites 4c (1/4, 1/4, 1/4) and 4d (3/4, 3/4, 3/4). Different Rietveld refinements were therefore performed with both 4c and 4d crystallographic sites, and best result through low isotropic displacement parameters and reliability factors (χ2 = 2.303 and RBragg factor = 6.98%) was obtained with all Cu and Fe atoms on the 4d crystallographic site. Although the obtained sample is intergrown with chalcopyrite; as previously studied, the chalcopyrite phase forms submicronic domains, this isocubanite sample is well crystallized.21 Note that the average particle size is about 1–2 μm without any particular shape.
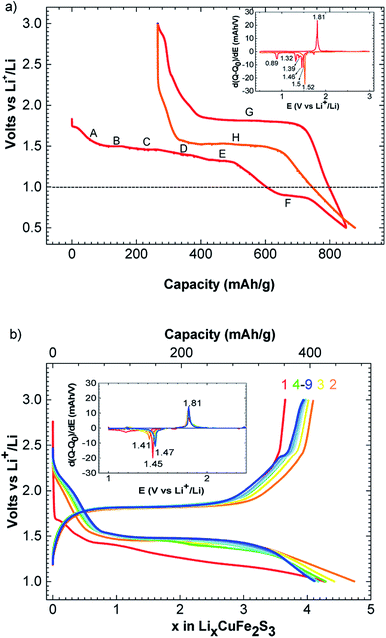
The charge–discharge profiles of Li/CuFe2S3 (Fig. 2a) have been performed by a galvanostatic cycling at C/20/Li per formula unit (f.u.) in the potential window 0.5–3.0 V versus Li+/Li. Starting from our material, the first discharge is fragmented in a series of two main processes happening between 1.80 and 0.50 V. The first one is a slope (A) from 1.80 to 1.50 V, it is attributed to the insertion of one lithium into CuFe2S3 through a solid solution, accordingly to literature.15 This insertion follows the eqn (1):
| CuFe2S3 + Li+ + e− → LiCuFe2S3 | (1) |
Note that the phase LiFeCuS2 has been reported15 and our sample is an intergrowth between chalcopyrite CuFeS2 and isocubanite CuFe2S3, a complete structural resolution of the lithiated phase is not possible. During the second process, we observe 5 plateaus at 1.50 (B), 1.46 V (C), 1.39 (D), 1.32 (E) and 0.82 (F) volt, respectively as shown on the derivative curve (inset Fig. 2a). These processes correspond to the reaction with 5 lithium and could then be assigned to copper and iron reduction to the metallic level as related in the case of Li/CuFeS2 system15 following the eqn (2):
| LiCuFe2S3 + 5Li → Cu0 + 2Fe0 + 3Li2S | (2) |
Because of the nature of our material (intergrowth of isocubanite and chalcopyrite), it is interesting to point out that only two domains are observed in the course of the first discharge of pure CuFeS2 phase (at 1.7 and 1.5 V, respectively16). Charging process occurs mainly through one plateau at 1.80 V (G) as shown on the derivative curve (Red curve, Fig. 2b). This plateau could be attributed to copper and iron oxidation leading to a mixture of cupper iron sulfides CuxFeySz (ref. 15, 23 and 24) and free sulfur formation. Consequently, this system becomes a hybrid between lithium ion and lithium sulfur battery. As observed on Fig. 2, the first discharge process is different than the second one where only one large plateau at 1.50 V (H) is observed. This can be due to SEI formation occurring at the same time than metal reduction in the first discharge. SEI formation has already been mentioned in similar conversion cathode study to be responsible for extra capacity like CuFeS2,15 Co2SiO4 (ref. 25) and CuCo2S4.26 In our case, an extra capacity of 260 mA h g−1 is observed. We particularly have to consider the presence of CuFeS2 in our material. CuFeS2 has been previously investigated and possesses similar electrochemical properties compare to CuFe2S3. Even if our material contains a large amount of CuFeS2, the electrochemical capacity cannot only be due to CuFeS2 activity. Therefore, this indicates that CuFe2S3 is an electroactive material.
A reversible capacity of 560 mA h g−1 (C/20/Li) is observed in the potential window of 1.52 V to 1.80 V. Please, note that an additional phenomenon appears below 1.50 V. This latter could correspond to different phenomena like electrolyte degradation or lithium insertion in the surface electrolyte interface as mentioned in previous report.27,28 We believe that the irreversible capacity is mainly ascribed to this slope and the SEI formation.
Study at a rate of C/2/Li and a cut off at 1.0 V are displayed Fig. 2b. The curve of C/2/Li shows a reversible and stable capacity of 400 mA h g−1 upon 9 cycles. Using this rate, a polarization of 340 mV is observed between formation and conversion of CuxFeySz. This polarization is quite in accordance with previous electrochemical performance obtained for CuFeS2.17 We can notice that cutting off at 1.0 V improves the reversibility of the system. Note that the conversion process is not complete as last discharge plateau at 0.82 V is also cutted off. Consequently, first reduction plateaus appeared at lower voltage and then stabilized at 1.47 V after few cycles (Fig. 2b).
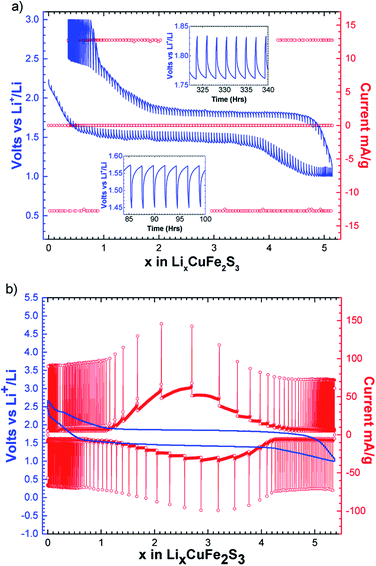
The intermittent galvanostatic titration (GITT) reported in Fig. 3a shows a biphasic process and allows us to access to the equilibrium potential in the course of the reduction with a thermodynamic potential of 1.65 V vs. Li+/Li. A polarization of 300 mV is observed. The potentiodynamic titration curve (PITT, Fig. 3b) reveals a bell-shape-type response on the reversible phenomenon, and confirms together with the sharpness of the peaks in the derivative curve (Fig. 2) that the reversible process is biphasic.
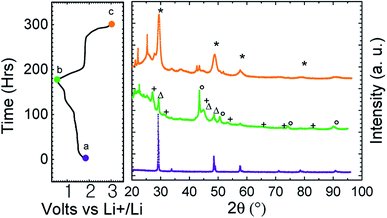
To confirm the structural conversion occurring in the course of the electrochemical process, ex situ X-ray diffraction patterns have been recorded at the end of the first discharge and charge (Fig. 4). We can see on the discharge pattern that CuFe2S3 reflections disappeared (green middle curve, Fig. 4). Reflections on discharge pattern are attributed to copper (○), iron (Δ) and Li2S (+). After recharge (orange upper curve, Fig. 4), reflection close to CuFe2S3 and attributed to CuxFeySz (*) are observed among undefined products (□). This validates the conversion mechanism.
The specific capacity decreases with the increase in current density (Fig. 5a). The reversible capacity is about 425 mA h g−1 at the current density of C/5/Li and decreases down to 30 mA h g−1 at 10C/Li. When the current density is tuned back at C/5/Li, the specific capacity rebounds to 350 mA h g−1. This rate capability is comparable with previously reported CuFeS2 rate capabilities.17 Please note that we observed a capacity fading, which appeared to be not rate depending, and could be attributed to polysulfides formation known to be formed in lithium sulfur battery.8 Those polysulfides are the results of Li2S reduction that can form free sulfur.
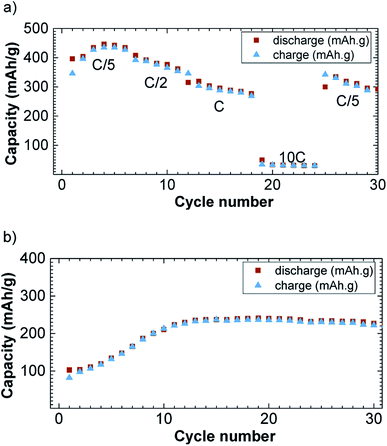 | ||
| Fig. 5 Rate (a) and cycling (b) capability versus cycle number at C/Li in 1.2–3.0 V potential window for the discharge (brown square) and charge (blue triangle) capacity versus cycle number. | ||
On Fig. 5b, we have reported the cycling performances of CuFe2S3 at a current density of C/Li upon 30 cycles and with a cut off at 1.2 V. The cut off was necessary to avoid side reactions to occur as observed on the potential slope observed at the end of the first discharge. The capacity is rising in the first 10 cycles from 100 to 245 mA h g−1 and stabilizes around 250 mA h g−1. We believe this is due to the incomplete reaction together with side reaction despite the high voltage cut off.
The electrochemical behaviour of CuFe2S3 and CuFeS2 are relatively close to each other's. Their working potential is around 1.8 V and similar phenomena (conversion process, SEI formation, extra electrochemical capacity) are observed for both compounds. Furthermore, they are both semi-conductors. Concerning resistivity, our isocubanite sample (containing chalcopyrite) owns a resistivity of 0.7 mohm cm at 300 K while pure chalcopyrite possesses a higher resistivity at room temperature (measured between 20 and 200 mohm cm).29
Conclusions
In this work, we demonstrate the conversion of the intergrowth between the two phases CuFe2S3 and CuFeS2 into Li2S and native copper and iron particles. Moreover, ex situ XRD at the end of the charge showed that a new phase CuxFeySz is formed. This new phase showed common diffraction peaks with the starting intergrowth but a complete structural resolution is not possible due to the low crystallinity of the material. More importantly, a reversible capacity of 425 mA h g−1 at a C/5/Li rate upon 10 cycles and with a cut off at 1.0 V is obtained. The redox potential of 1.65 V vs. Li+/Li gives an energy density of 600 W h kg−1. This result points out that despite the intergrowth nature of the material between isocubanite and chalcopyrite, we obtain comparable performance for this family of materials.Conflicts of interest
There are no conflicts to declare.Notes and references
- K. Zhang, T. Zhang, J. Liang, Y. Zhu, N. Lin and Y. Qian, RSC Adv., 2015, 5, 14828–14831 RSC.
- B. Jache, B. Mogwitz, F. Klein and P. Adelhelm, J. Power Sources, 2014, 247, 703–711 CrossRef.
- A. Débart, L. Dupont, R. Patrice and J.-M. Tarascon, Solid State Sci., 2006, 8, 640–651 CrossRef.
- S.-C. Han, H.-S. Kim, M.-S. Song, P. S. Lee, J.-Y. Lee and H.-J. Ahn, J. Alloys Compd., 2003, 349, 290–296 CrossRef.
- Y. Uetani, K. Yokoyama and O. Okamoto, J. Power Sources, 1980, 5, 89–98 CrossRef.
- H. Mukaibo, A. Yoshizawa, T. Momma and T. Osaka, J. Power Sources, 2003, 119–121, 60–63 CrossRef.
- J. Wang, G. Wang, L. Yang, S. H. Ng and H. Liu, J. Solid State Electrochem., 2006, 10, 250–254 CrossRef.
- J. Cabana, L. Monconduit, D. Larcher and M. R. Palacín, Adv. Mater., 2010, 22, E170–E192 CrossRef PubMed.
- F. Bonino, M. Lazzari, B. Rivolta and B. Scrosati, J. Electrochem. Soc., 1984, 131, 1498–1502 CrossRef.
- J.-S. Chung and H.-J. Sohn, J. Power Sources, 2002, 108, 226–231 CrossRef.
- X. Feng, X. He, W. Pu, C. Jiang and C. Wan, Ionics, 2007, 13, 375–377 CrossRef.
- J.-W. Choi, G. Cheruvally, H.-J. Ahn, K.-W. Kim and J.-H. Ahn, J. Power Sources, 2006, 163, 158–165 CrossRef.
- H. Siyu, L. Xinyu, L. QingYu and C. Jun, J. Alloys Compd., 2009, 472, L9–L12 CrossRef.
- S.-H. Kim, Y.-J. Choi, D.-H. Kim, S.-H. Jung, K.-W. Kim, H.-J. Ahn, J.-H. Ahn and H.-B. Gu, Surf. Rev. Lett., 2008, 15, 35–40 CrossRef.
- P. Guo, H. Song, Y. Liu and C. Wang, ACS Appl. Mater. Interfaces, 2017, 9, 31752–31762 CrossRef PubMed.
- W. Ding, X. Wang, H. Peng and L. Hu, Mater. Chem. Phys., 2013, 137, 872–876 CrossRef.
- X. Wu, Y. Zhao, C. Yang and G. He, J. Mater. Sci., 2015, 50, 4250–4257 CrossRef.
- Y. Wang, X. Li, Y. Zhang, X. He and J. Zhao, Electrochim. Acta, 2015, 158, 368–373 CrossRef.
- M. E. Fleet, Z. Kristallogr., 1970, 132, 276–287 CrossRef.
- S. Pareek, A. Rais, A. Tripathi and U. Chandra, Hyperfine Interact., 2008, 186, 113–120 CrossRef.
- T. Barbier, D. Berthebaud, R. Frésard, O. I. Lebedev, E. Guilmeau, V. Eyert and A. Maignan, Inorg. Chem. Front., 2017, 4, 424–432 RSC.
- J. T. Szymasski, Acta Crystallogr., 1974, 140, 240–248 Search PubMed.
- S.-B. Son, T. A. Yersak, D. M. Piper, S. C. Kim, C. S. Kang, J. S. Cho, S.-S. Suh, Y.-U. Kim, K. H. Oh and S.-H. Lee, Adv. Energy Mater., 2014, 4, 1300961 CrossRef.
- L. Li, M. Cabán-Acevedo, S. N. Girard and S. Jin, Nanoscale, 2014, 6, 2112–2118 RSC.
- F. Mueller, D. Bresser, N. Minderjahn, J. Kalhoff, S. Menne, S. Krueger, M. Winter and S. Passerini, Dalton Trans., 2014, 43, 15013–15021 RSC.
- L. Nie, H. Wang, Y. Chai, S. Liu and R. Yuan, RSC Adv., 2016, 6, 38321–38327 RSC.
- S. Grugeon, S. Laruelle, L. Dupont and J.-M. Tarascon, Solid State Sci., 2003, 5, 895–904 CrossRef.
- S. Laruelle, S. Grugeon, P. Poizot, M. Dollé, L. Dupont and J.-M. Tarascon, J. Electrochem. Soc., 2002, 149, A627 CrossRef.
- R. Lefèvre, D. Berthebaud, M. Y. Mychinko, O. I. Lebedev, T. Mori, F. Gascoin and A. Maignan, RSC Adv., 2016, 6, 55117–55124 RSC.
Footnote |
† The product was characterized by XRD using a Philips X'Pert diffractometer with Bragg–Brentano geometry (CuKα1,2 radiation). Note that due to their instability in air, the reduced phases XRD patterns were registered under vacuum using a chamber attached to a Bruker D8 diffractometer. Electrochemical characterizations of CuFe2S3 have been performed in Swagelok cells. Metallic lithium (Aldrich, 99,9%) has been used as negative electrode, LP30 from Merck [1 M LiPF6 in an ethylene carbonate/dimethyl carbonate 1![[thin space (1/6-em)]](https://www.rsc.org/images/entities/char_2009.gif) : :![[thin space (1/6-em)]](https://www.rsc.org/images/entities/char_2009.gif) 1 (w/w) Selectipur] was used as the electrolyte, and the positive electrode was constituted of approximately 10 mg of a mixture of the active material with 50% weight of carbon (acetylene black). The electrochemical cells were cycled at constant current between 1.2 and 3.0 V at different galvanostatic rates on a VMP II potentiostat/galvanostat (Biologic SA, Claix, France) at room temperature. Potentiostatic intermittent titration technique (PITT) measurements were conducted using a potential step of 10 mV limited by a minimum current equivalent to a C/10 galvanostatic rate. 1 (w/w) Selectipur] was used as the electrolyte, and the positive electrode was constituted of approximately 10 mg of a mixture of the active material with 50% weight of carbon (acetylene black). The electrochemical cells were cycled at constant current between 1.2 and 3.0 V at different galvanostatic rates on a VMP II potentiostat/galvanostat (Biologic SA, Claix, France) at room temperature. Potentiostatic intermittent titration technique (PITT) measurements were conducted using a potential step of 10 mV limited by a minimum current equivalent to a C/10 galvanostatic rate. |
| This journal is © The Royal Society of Chemistry 2018 |

