 Open Access Article
Understanding and improving assays for cytotoxicity of nanoparticles: what really matters?†
Hagar I. Labouta abc,
Christopher Sarsonsb,
Jacob Kennardb,
M. Juliana Gomez-Garciab,
Kenrick Villarb,
Hyungbok Leeb,
David T. Cramb
 *ad and
Kristina D. Rinker
 *bde
*bde
aDepartment of Chemistry, Faculty of Science, University of Calgary, Calgary, Canada. E-mail: dcramb@ucalgary.ca
bBiomedical Engineering, University of Calgary, Calgary, Canada. E-mail: kdrinker@ucalgary.ca
cDepartment of Pharmaceutics, Faculty of Pharmacy, Alexandria University, Alexandria, Egypt
dDepartment of Physiology and Pharmacology, Cumming School of Medicine, University of Calgary, Calgary, Canada
eDepartment of Biochemistry and Molecular Biology, Alberta Children's Hospital Research Institute, Cumming School of Medicine, University of Calgary, Calgary, Canada
First published on 22nd June 2018
Abstract
Despite years of excellent individual studies, the impact of nanoparticle (NP) cytotoxicity studies remains limited by inconsistent data collection and analysis. It is often unclear how exposure conditions can be used to determine cytotoxicity quantitatively. Discrepancies due to using different measurement conditions, readouts and controls to characterize NP interactions with cells lead to further challenges. To examine which parameters are critical in NP cytotoxicity studies, we have chosen to examine two NP types (liposomes and quantum dots) at different concentrations incubated with two primary vascular endothelial cells, HUVEC and HMVEC-C for a standard time of 24 h. We paid close attention to the effects of positive controls and cell association on interpretation of cytotoxicity data. Various cellular responses (ATP content, oxidative stress, mitochondrial toxicity, and phospholipidosis) were measured in parallel. Interestingly, cell association data varied significantly with the different image analyses. However, cytotoxicity responses could all be correlated with exposure concentration. Cell type did have an effect on cytotoxicity reports. Most significantly, NP cytotoxicity results varied with the inclusion or exclusion of positive controls. In the absence of positive controls, one tends to emphasize small changes in cell responses to NPs.
Introduction
As nanoparticles (NPs) continue to be touted for their excellent theranostic potential, there is a growing need to assess their interactions with human cells leading to potential hazards. Yet, there remains a lack of standardized protocols for measuring cell interactions and cytotoxicity of engineered NPs. The different techniques and analyses employed to quantify NP-cell association, potentially limit comparability and reproducibility. Different practices in assessing cytotoxicity signals further contributes to a huge variability in the results of cytotoxicity evaluations. Some examples include using different sets of controls, awareness of interference between reporting chemistry and the NPs themselves and colloidal stability testing of the NPs, could result in different reports of the cytotoxic thresholds for the same NPs. A study is needed to address such discrepancies in previous work, and to correlate cytotoxicity with the different readouts characterizing NPs concentration in relevant terms.One potential explanation for the conflicting published data1 is the deficiency of appropriate controls when using specific assays to investigate cell viability or specific intracellular responses due to exposure to NPs. Positive controls are integral to the assay protocol to validate the assay itself and to determine accurate cytotoxicity data ranges rather than normalizing the data solely to the negative (untreated) control. The latter approach rather determines the “fold decrease or increase from the control experiment”, whereas working up the same data to calculate percentage viability based on both negative and positive controls will result in accurate values for the determined response.2,3 Deficiency of appropriate controls can greatly reduce the explanatory power of cell-based toxicity models and potentially lead to overestimation of toxicity.
Another confounding factor in comparative cytotoxicity studies comes from the differences in cell lines employed. Knowing that most proposed clinical applications of NPs involve intravenous administration,4 human primary vascular endothelial cells (ECs) were used in the present study. HUVEC (human umbilical vein ECs) are a frequently used macrovascular endothelial cell model, being inexpensive, easily accessible, robust in culture and highly proliferative. On the other hand, there is a growing evidence of differences in physiology and pharmacology between microvascular and macrovascular ECs.5,6 For example, HMVEC (human microvascular endothelial cells) were found to be more sensitive to toxicity screening than other cell types7–9 and have been used routinely to test NP cytotoxicity.10–12 To our knowledge there is no comparative study on screening NP cell interactions and cytotoxicity using HUVEC and HMVEC.
In the present study, we first explore the use of different fluorescence-based methods and image analysis approaches to examine the differences in cell-association and internalized NP ratios compared with the bulk solution concentrations that cells were exposed to. We then correlate various toxicity responses of ECs (ATP content, mitochondrial membrane potential, oxidative stress and phospholipidosis) to the relative NP concentrations (exposure, association and internalization) in vitro. Two model NPs, liposomes and quantum dots (QDs), of biomedical significance was employed in this study. Liposomes are drug delivery vehicles of great clinical significance.21 QDs have great potential in cellular, tissue and whole-body multiplexed cancer biomarker imaging.22 Cytotoxicity screening is therefore integral to the development of these biomedical agents. The ultimate objective of this study is to examine important criteria and practices, especially the use of appropriate controls, when correlating these toxicity responses to NP concentrations.
Experimental methods
Our study has followed good practices in developing reliable NP cytotoxicity and cell association data.13,14 This includes checking colloidal stability in acellular15 and cellular conditions, testing NP interference with assay reagents16,17 and use of appropriate controls.2,3 This is further explained in the following paragraphs. A schematic showing an overview of the present study is presented in the ESI methods section.†Preparation of PEG-functionalized liposomes
Liposomes were prepared following a protocol adapted from Tekrony et al.18 A lipid mixture of 1 mM 2-dioleoyl-sn-glycero-3-phosphocholine and 0.05 mM 1,2-dioleoyl-sn-glycero-3-phosphoethanolamine-N-[methoxy(polyethylene glycol)-2000] (Avanti) in 5 ml chloroform was vortexed at 300 rpm for 5 min and dried under nitrogen. The lipid film was hydrated with 5 ml water under constant shaking, 300 rpm, for 45 min. The resulting multilamellar liposomes were extruded using a handheld mini-extruder (Avanti) through 200 nm then 100 nm polycarbonate membranes (Whatman® Nucleopore track-etch membrane), 25 times each. Fluorescently-labelled liposomes were similarly prepared using 5 × 10⁻⁷ M Oregon Green® 488 1,2-dihexadecanoyl-sn-glycero-3-Phosphoethanolamine (ThermoFisher Scientific). Prepared liposomes were protected from light and stored at 4 °C until use.Characterization of liposomes and QDs for colloidal properties
Liposomes were characterized for mean diameter, polydispersity index (PDI) and zeta potential (ZetaSizer Nano DTS 1060, Malvern) at 25 °C, with 173° backscatter measurement angle and 633 nm incident laser wavelength. Measurements were performed in triplicate and reported as mean ± standard deviation. Theoretical calculation of the number concentration of liposomes was determined based on the measured hydrodynamic diameter of the liposomes, as detailed earlier.19 Number concentration was then converted to a molar concentration using Avogadro's number.Commercially available QDs (Qdot® 605 ITK™, Life Technologies) were similarly characterized for mean diameter, PDI and zeta potential. According to the supplier's specifications, the core of these dots is CdSe and the shell is ZnS. These probes are functionalized with amine-derivatized PEG and has emission maxima of ∼605 nm. Further details on these probes could be found on the supplier's website. Molar concentration of QDs (based on the number of NPs) stated by the manufacturer was confirmed by fluorescence correlation experiments as indicated in an earlier study by our group.20
Cell culture
HUVEC and HMVEC-C (Lonza) were cultivated in EGM-2 and EGM-2MV culture media (Lonza), respectively, in gelatin-coated T-flasks, and used until passage 9.Colloidal stability of nanoparticles in culture media
Colloidal stability of liposomes (8 nM) and QDs (200 nM) in both culture media (EGM-2 and EGM-2MV) in terms of size and PDI was tracked for 24 h at 37 °C.Cell association and internalization of liposomes and QDs using confocal microscopy
3D-reconstructions of the confocal Z-stacks were generated using image processing software ScanIP Simpleware (Synopsys). NP adhesion and internalization were quantified in terms voxel numbers and fluorescence intensities within the cell membrane and cell interior volumes, respectively. Detailed description of the 3D re-construction, presumptions used to differentiate between internalization and adhesion and a diagram summarizing the workflow (Fig. S2†), as well as statistical tests used to analyze cell NP association and internalization data are included in ESI methods.†
Cytotoxicity study of liposomes and QDs
HUVEC and HMVEC-C grown to 80–90% confluency in 96-well plates (Thermo Scientific) were exposed to serial concentrations of unlabelled liposomes (0.08–8 nM) and QDs (0.2–200 nM) in culture medium at 37 °C for 24 h. Cell viability, in terms of cell-ATP level, (ViaLight™ Plus, Lonza) on exposure to NPs was measured, as well as specific toxicity mechanisms: oxidative stress (CellROX Assay kit, Life technologies), mitochondrial membrane integrity (Mitochondrial Health Kit, Invitrogen) and phospholipidosis (LipidTOX assay kit, Invitrogen). Brief background on the test markers, detailed protocols, control experiments, interference tests and equations used to quantify cell responses are described in the ESI.† Sigmaplot, version 13 (Systat) was used for data fitting using a sigmoidal dose–response model.Results and discussion
The ultimate goal of this study was to explore the potential for false positive or false negative interpretations of cytotoxicity data based on choice of readout parameters and data analysis methods. This study also focused on discrepancies due to using different image analysis readouts of the concentration of NPs associated with or internalized within the cells, and due to the adequacy or deficiency of appropriate controls in NP cytotoxicity experiments.Characterization of nanoparticles
Two model nanoparticles (liposomes and QDs) were used in our experiments. Reproducibly monodisperse unlabelled and fluorescently-labelled liposomes shared comparable colloidal properties with hydrodynamic diameters of 91 ± 5 and 90 ± 4 nm, PDI of 0.06 ± 0.02 and 0.07 ± 0.02 and zeta potentials of −19 ± 5 and −25 ± 2 mV, respectively. Both liposomes were stable in culture media, EGM-2 and EGM-2MV, for 24 h at 37 °C (Fig. 1A and B). It should be also noted that liposomes were dispersed into the culture medium (using a vortex) at zero time to ensure well distribution of the NPs. No significant changes in size diameters and PDI were observed for all liposomes after 24 h incubation in both culture media. This precludes the formation of aggregates settling down from the culture medium, which would have been accompanied by an increase in PDI (dispersed nanoaggregates) or visual observation of a bigger aggregate or a precipitate.The slight decrease in liposomal mean hydrodynamic diameters in culture media (Fig. 1A and B) relative to water could be attributed to a higher NP stability by means of the proteins present in culture media3 or due to a particle shrinkage or decrease in the hydrodynamic diameter in response to a higher buffer strength of the culture media relative to water.21
Colloidal stability of liposomes was further tracked in presence of cells to investigate the effect of cell milieu and cell excretions as well as the physical barrier of the cell membrane on NP stability. The presence of cells did not affect liposome stability (Fig. S3, refer to the ESI†). To the best of our knowledge, this is the first study to check for colloidal stability of NPs in presence of cells.
Due to unchanged colloidal properties on fluorescent tagging, fluorescent liposomes were used to track cell association and uptake using fluorescence-based techniques. Unlabelled liposomes were used in cytotoxicity assays to avoid optical interference with assay reagents.
Commercially available amine(PEG)-terminated QDs with a hydrodynamic diameter, PDI and zeta potential in water; amine(PEG)-terminated QDs (diameter = 13.9 ± 0.6 nm, PDI = 0.3 ± 0.1, and zeta potential = −1.6 ± 0.4) were also stable in both culture media for 24 h at 37 °C. No significant differences were observed for QDs' size and PDI in water and in both culture media at zero and 24 h.
Cell-NP association study using fluorescence-based techniques
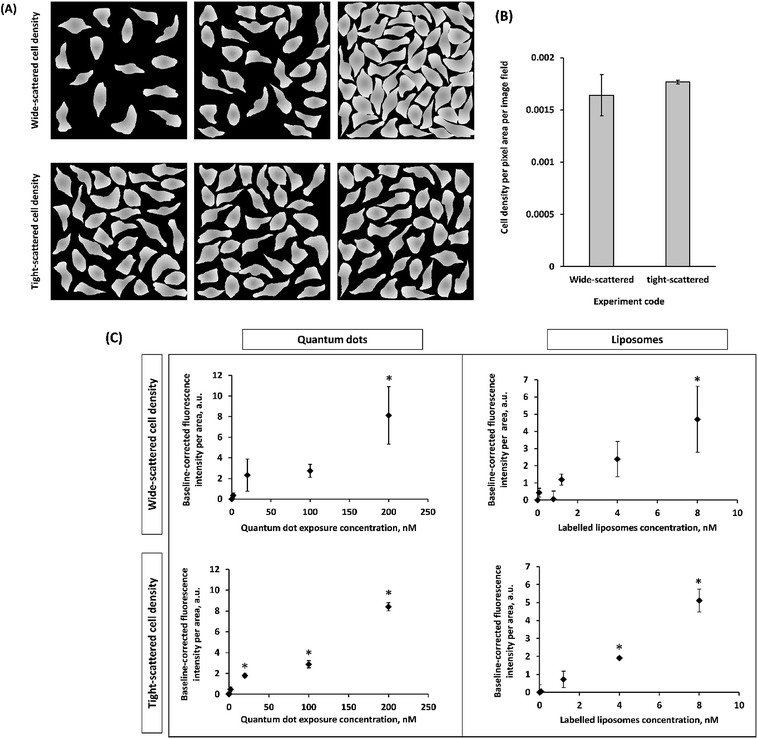
Fluorescence-based imaging techniques are crucial to probe NP-cell association and mechanisms of NP-induced cell toxicity because fluorescence intensity is presumed to be a linear proxy for concentration.22 However, different approaches to image analysis are often used. To address this, the association of different concentrations of liposomes and QDs with HUVEC and HMVEC-C was tracked using confocal microscopy (refer to ESI, Fig. S5–S8†) followed by thorough image analysis of sequestered Z-stacks at 2D and 3D levels with the aim of pinpointing sources of variability in the results due to the different approaches used.Non-homogenous distributions of liposomes and QDs in and on cells were observed using confocal fluorescence microscopy (Fig. S5–S8†). In other works, uneven distributions of NPs have also been consistently published for monolayer cells2,23 and within tissues.24,25 This motivated us to investigate whether analyzing image fields (replicates) that are either of fairly similar (tight-scattered, Fig. 2A, replicates in the lower panel) or varying (wide-scattered, Fig. 2A, replicates in the upper panel) in cell density, would have an impact on NP cell association results. Hypothetically, the wide scatter (replicates or image fields varying in cell density, Fig. 2A, replicates in the upper panel) could produce skewed NP distribution results since lower cell density images may not be statistically representative. This would exacerbate the non-homogeneous NP distribution. In the current study, two groups of images (wide-scattered and tight-scattered cell densities) were analyzed for NP fluorescence per cells area (Fig. 2).
On analyzing tight-scattered image fields, average fluorescence intensity values (per cell area) with smaller standard deviations were measured allowing the more accurate determination of significant differences in fluorescence intensities (per cells area) at the different exposure concentrations. This suggests that using image fields with variable cell densities (wide-scattered) might introduce some error in cell-NP association results. Image analysis hereafter was dependent on using the tight-scattered sets for both HUVEC and HMVEC-C exposed to either of liposomes and QDs.
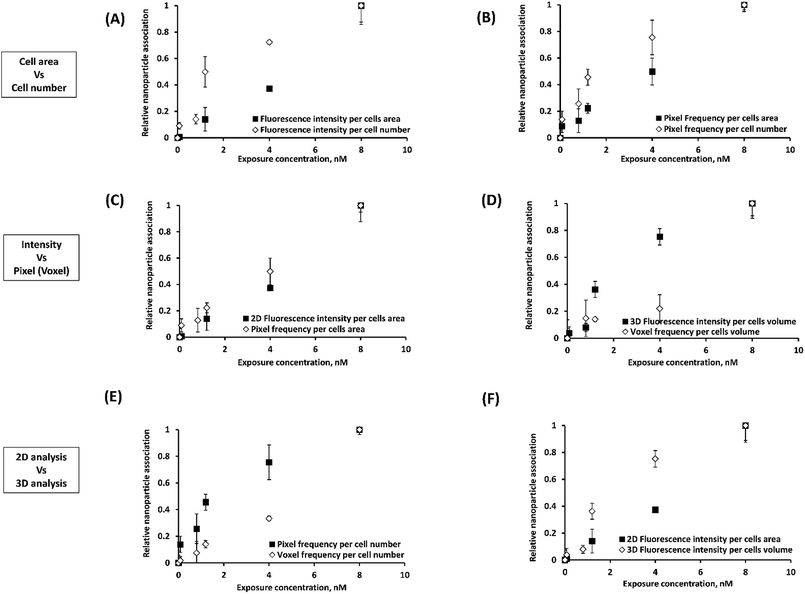
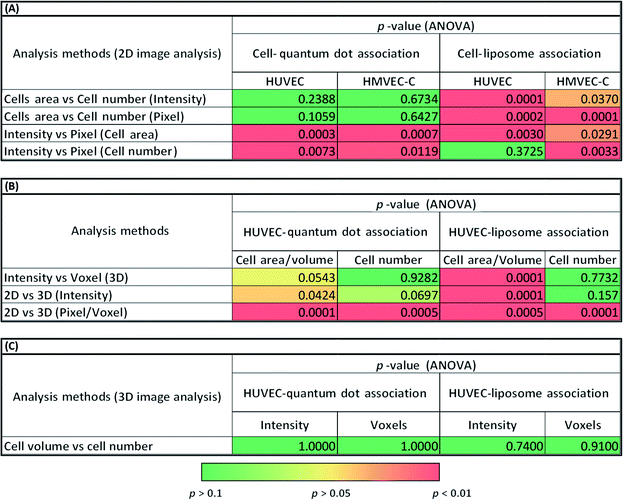
In order to later assess the correlation between NP association and cytotoxicity, confocal Z-stacks were analyzed for NP fluorescence intensity and pixel frequency of NP fluorescent spots. The way in which these data are analysed may also play a role in assessing the effects of NP association. Intensities and (above a fluorescence threshold) pixel counts were estimated per cell area (easier to estimate) and per cell number. Each set of measurements were normalized to compare relative differences. The relative effect of these different approaches to quantifying NP-cell association trends are presented in Fig. 3 and S9–S11.† The statistical significance of the results are summarized in Table 1.
![[thin space (1/6-em)]](https://www.rsc.org/images/entities/char_2009.gif) <
<![[thin space (1/6-em)]](https://www.rsc.org/images/entities/char_2009.gif) 0.05 indicates statistical significance
0.05 indicates statistical significance
The average intensity of NP fluorescence has frequently been used to characterize the relative NP-cell association under various experimental conditions.26–29 The average fluorescence intensity has been expressed as intensity per cell area27 or cell number.28,29 In the present study, we observed significant differences (p < 0.001) between normalized cell association results per cell area and per cell number for certain experiments (liposomes) (Fig. 3A and 2B, S9 (A and B)–S11(A and B)† and Table 1A). A heterogeneous distribution of liposomes among cells within the analyzed image fields could explain the observed differences. These results suggest that such subtleties in the data could be missed depending on the analysis method and thus cytotoxicity mechanism data could be skewed.
Cell association of NPs was also assessed in terms of the frequency of pixels above a certain fluorescence threshold.2,30 This approach was reported as superior over approaches based on intensity measurements because intensities may vary with the location of the NPs in the imaged 3D specimen owing to light scattering. For pixel measurements, imaging settings could be freely adjusted for each measurement individually according to the signal level required to detect NPs at different depths in the examined cells.31 Significant differences between intensity and pixel measurements were often observed for 2D projections of the confocal Z-stack (Fig. 3C and S9(A and B)–S11(A and B)† and Table 1A). In contrast, 3D image analysis resulted in similar HUVEC NP association results (p > 0.05) using either of voxel count or average fluorescence intensity due to NPs (Fig. 3D, S9D† and Table 1B).
Significant differences were also observed between association trends measured from 2D (pixel frequency) and 3D (voxel frequency) image analyses (Fig. 3E, S9F† and Table 1B). It should be noted here that pixels (counts per surface area) and voxels (counts per volume) are entirely different parameters. This was not the case for intensity per cell measurements (p > 0.05) where the intensity per pixel for each XY-slice image is integrated across all slices to create the 3D stack or projected to create a 2D image based on total intensity (Fig. S9E† and Table 1B). Statistical analyses of the differences observed between 2D intensities per cells area and 3D intensities per cells volume (p < 0.001) can be found in Fig. 3F and Table 1B.
Results presented here indicate clear statistical differences between the different approaches of image analysis: 2D and 3D analysis of sequestered Z-stacks analyzed for fluorescence intensity; or pixel frequency of fluorescent spots due to NPs normalized to cell area or cell number (Fig. 3, S9–S11† and Table 1). We submit that future cell-association studies must accurately describe the analysis approaches. Methodological errors in relative NP concentration distributions could also be minimized on analysis of image fields with fairly similar cell density.
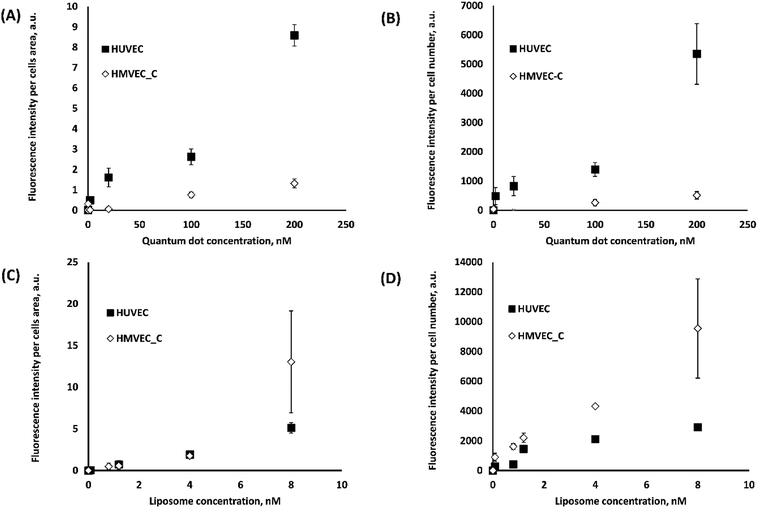
We now examine the effect that different cell lines might have on NP association and ultimately on cytotoxicity results (next section). We first compared NP association with HUVEC and HMVEC-C using fluorescence intensity measurements per cells area (Fig. 4A and C) and cell number (Fig. 4B and D). Both methods of analyses showed significantly (p < 0.0001) higher QD association with HUVEC than HMVEC-C; six-fold higher association was observed at 200 nM QD concentration with HUVEC than HMVEC-C cells. Liposomes associated to a different extent (p < 0.05) with both cells, with more differences observed in terms of intensities per cell number. Similar differences but to a less extent were observed when using pixel measurements as explained in the ESI (Fig. S12†). Differences in association of liposomes and QDs with each of the primary human ECs (HUVEC and HMVEC-C) were observed (Fig. 4) and could lead to different trends in NP-related toxicity. Differences in NP association among the two cells might be explained by differences in culture media, in which the particles were dispersed. For example, the HUVEC media contained 2% fetal bovine serum (FBS) while the HMVEC-C media contained 5% FBS. Different cell-associations of silica NPs were reported in presence and absence of serum proteins.32 Differences between large vessel (HUVEC) and microvascular (HMVEC-C) endothelial cell phenotypes may also explain the observed differences in NP-cell association. For example the expression of key surface receptors, vascular cell adhesion molecule (VCAM-1) and platelet endothelial cell adhesion molecule (PECAM-1) are more expressed in HUVECs than HMVEC-Cs.33 Significant differences were also found in terms of their CD14, CD34 and vascular endothelial growth factor (VEGF) receptor (1, 2 and 3) gene expression.34 It could be that differences in cell surface receptor expression between HUVEC and HMVEC-C are altering their interactions with NPs. The effect of endothelial cell model on their NP uptake efficiency has not been studied directly to the knowledge of the authors. These differences in NP association among the two cells infer that developed NP association and cytotoxicity models are only predictive for the test cell. This however cannot be generalized to the behaviour of other cell types on exposure to these NPs.
In addition to using confocal microscopy as an imaging tool to probe cell-NP association, other fluorescence-based spectroscopic techniques, fluorimetry and fluorescence correlation spectroscopy, were employed to measure NP concentrations of the cell lysate following exposure to NPs and non-associated NPs in the culture medium, respectively. However, the low signal to noise in the lysate and the larger error in the culture medium measurements precluded further use (refer to ESI, Fig. S4†).
Cell-uptake of nanoparticles: 3D reconstruction of confocal Z-stacks
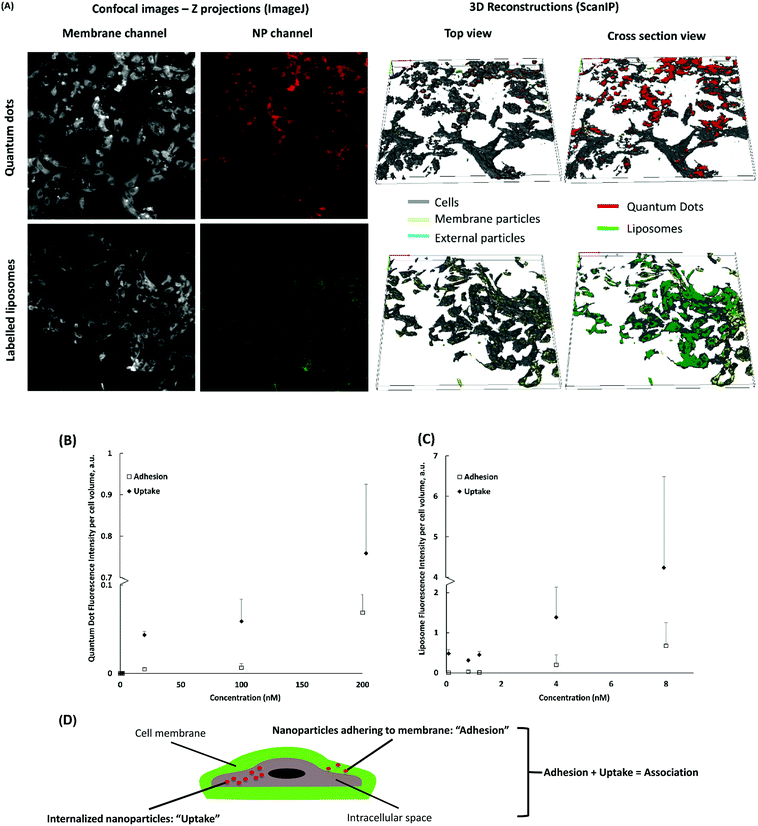
We also wanted to assess the correlation between cell uptake of NPs and cytotoxicity. Quantitative assessment of NP uptake into cells still poses a technical challenge. It is difficult to distinguish between NPs inside the cell and on the cell surface.35 3D modelling and reconstruction of confocal stacks has been successfully used to quantify NP uptake, however, it only allows the analysis of one cell at a time.36–38 Using ScanIP, we attained a higher image analysis throughput to define cell membrane and intracellular regions of interest (ROIs) of all the cells in a stack (Fig. 5). NP adhesion and uptake was quantified as voxel count and fluorescence intensity in each ROI. NP voxels found in the region of the cell membrane were presumed to be adhered, while those found in the intracellular region were considered internalized.Results obtained from analysis of the 3D models of NP-treated HUVEC indicate minimal cell surface adhesion and almost complete uptake of cell-associated NPs (Fig. 5A). This could be attributed to the long exposure time (24 h) and a relatively small NP size.37,39 Cell internalization of QDs and liposomes increased with exposure concentration (Fig. 5). The number of internalized particles at the highest concentration (200 nM for QDs and 8 nM for liposomes) was significantly higher (p < 0.01) than internalization at lower concentrations. Similarly, NP adhesion increased with higher exposure concentration. These plots suggest that the system has not reached NP saturation of the cell membranes and intracellular medium.
In Table 1, a significant difference (p < 0.05) between normalized voxel counts and fluorescence intensities per cell volume for liposomes (Fig. 5C versus Fig. S13A†) is presented. Since quantification by voxel count assumes all voxels have the same fluorescence intensity, discrepancies between both methods could occur owing to a wide range and dispersion of fluorescence intensities per voxel, such as those shown in Fig. S13C† for liposomes. No significant difference was found between the different analyses for QDs likely due to a lower range and dispersion of the fluorescence intensity per voxel (Fig. S13D†). Nevertheless, the overall trend of the results was similar; an increase in concentration generated an (often linear) increase in uptake and adhesion.
Overall, a clear advantage of 3D reconstruction of confocal Z-stacks is that it delivers spatial information. Distinction between membrane-associated and internalized particles was possible via 3D reconstruction of the cell membrane and the intercellular space. Hence, 3D reconstruction should be integral in studies where relative localization information is needed to investigate NP-cell association and cell response mechanisms. We believe that discrepancies between voxel counts and fluorescence intensities per volume will depend on the intensity threshold chosen. The advantage of voxel count is that it vastly reduces the intensity artefacts from light scattering by tissues.
Cytotoxicity study of nanoparticles
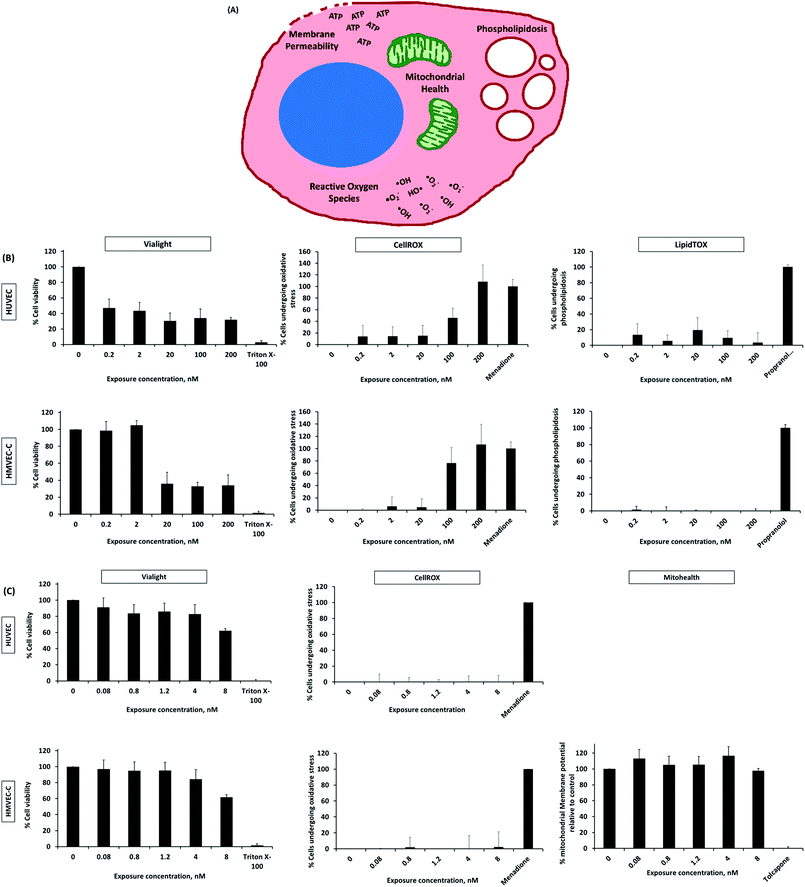
Prior to tracking specific cellular events indicating potential toxicity, possible NP interferences with test reagents, leading to false positive or false negative results were examined. Interference was only observed for QDs and liposomes with Mitohealth and LipidTOX kits, respectively (Fig. S14, refer to the ESI†). QD emission and excitation spectra overlap with those of the Mitohealth reagent. The LipidTOX reagent has high affinity to and detects intracellular accumulation of lipids, which could explain its interaction with the lipid-containing vesicles. These tests were excluded when interference was detected.We now move to the examination of QD cytotoxicity. There are some discrepancies in literature regarding toxicity of QDs possibly owing to the different physicochemical properties of QDs, the different cells used, etc.40–44 Our results show a substantial and step-wise drop in percentage viability of HUVEC and HMVEC-C; on exposure to amine (PEG) terminated QDs over a concentration range of 0.2–200 nM (Fig. 6B). QDs were toxic to HUVEC and HMVEC-C after 24 h at exposure concentrations of 0.2 (46.9% cell viability) and 20 nM (35.8% cell viability), respectively, and toxicity was maintained at the same level up to 200 nM (highest test concentration). Alternatively, liposomes, generally regarded in literature as safe and biocompatible,2,45 resulted in a slight decrease in cell viability with an increase in concentration (Fig. 6C). The percentage viability of HUVEC decreased from 91 to 82% on increasing the exposure liposomal concentration from 0.08 to 4 nM and dropped to about 62% at 8 nM concentration. A similar trend was observed with HMVEC-C cells.
Though HUVEC and HMVEC-C are both ECs with shared morphology, they responded differently to test NPs. Higher toxic responses (viability and oxidative stress) were generally observed for HMVEC-C than HUVEC cells on exposure to QDs (Fig. 6). This is despite the differential extents of cell-association of QDs, whereas significantly higher association of QDs was observed in case of HUVEC than HMVEC-C (Fig. 4). In other words, HMVEC-C cells were found more sensitive to QDs than HUVEC cells. However, the difference in association of liposomes among the two cell types was not pronounced. This, in addition to their minimal cytotoxic effects of liposomes resulted in more or less similar toxic responses of the two cell types on exposure to liposomes. Unsurprisingly, the sensitivity of two cells with common origin and morphology differed in response to NP exposure; this sends a warning to future studies using in vitro cell models for screening NP cytotoxicity.
Further tests were conducted to examine possible cytotoxicity mechanisms (oxidative stress, loss of mitochondrial membrane integrity and phospholipidosis) on exposure of HUVEC and HMVEC-C cells to liposomes and QDs. The liposomes used in this study did not elicit the production of significant oxygen species (tested using both cell types) nor negatively affected the mitochondrial membrane relative to non-treated HMVEC-C cells (Fig. 6C). In other words, release of oxygen species and changes in mitochondrial health are not mechanisms for realizing cytotoxicity by test liposomes under the experimental conditions used in our study. Liposomes were previously reported to interfere and fuse with the cell membrane lipids.2,46,47 We could not, however, test that due to liposomal interference with the phospholipidosis assay reagent. On the other hand, toxicity of QDs was observed to be at least partially attributed to the production of reactive oxygen species (Fig. 6B and Table 2). The generation of reactive oxygen species upon cell internalization of QDs was previously reported as a contributing QD cytotoxicity mechanism.40,43,44 No excessive accumulation of intracellular phospholipids was measured on cell exposure to QDs; phospholipidosis is therefore not a toxicity mechanism for test QDs under the study conditions (Fig. 6B).
After careful analysis of NP-cell association and internalization, and cell responses to NPs, we wanted to respond to the main goal of the paper which was investigating how different measurement techniques and parameters to characterize NP interactions with cells, in addition to different practices in cytotoxicity measurements (using appropriate controls) could affect NP cytotoxicity reports.
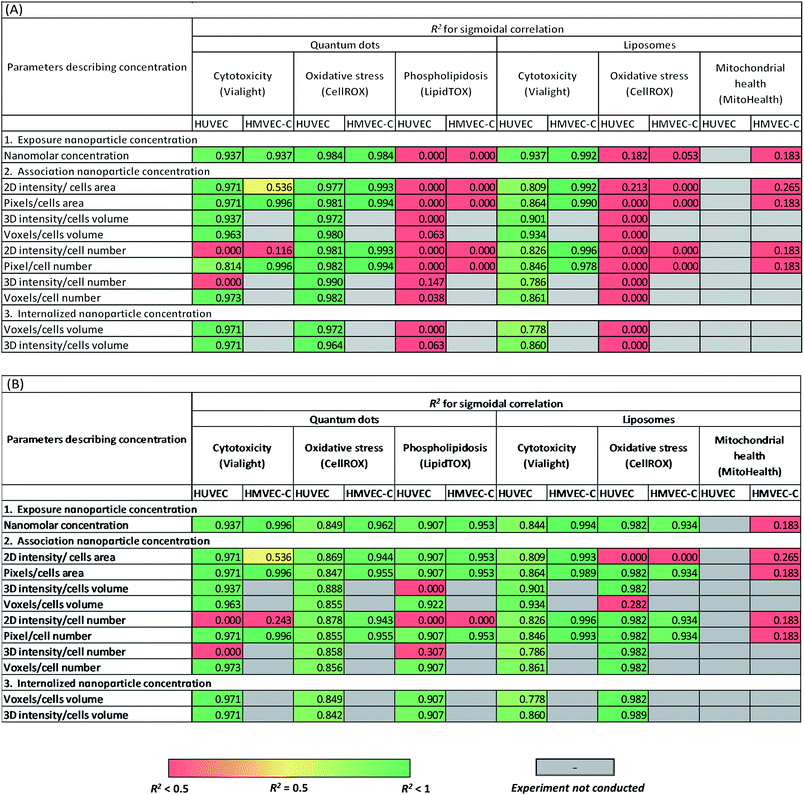
A sigmoidal dose–response model is normally used to describe toxicity trends with respect to toxin concentration. This was employed to test the correlation of NP cytotoxicity and other measured cell responses to NPs, either normalized to both positive and negative controls (Table 2A) or measured as fold decrease or increase from the negative control experiments (Table 2B). In these tests, we did not exclusively rely on exposure NP concentration (concentration in culture medium). Indeed, we further examined these correlations using the different measured readouts of associated and internalized NP concentrations. Results were compared to determine the effect of deficiency of appropriate controls in current common practices when investigating cell viability/toxicity and specific intracellular responses due to exposure to NPs.
In this study, all cytotoxicity assays employed negative (untreated cells) and positive controls. For a positive control with respect to viability, cells underwent irreversible permeabilization of the membrane and structural collapse on exposure to Triton X-100 (non-ionic surfactant) at postmicellar concentration.48 Menadione (100 μM) was recommended by the manufacturer as a positive control in oxidative stress measurement and was reported to induce the generation of reactive oxygen species.49,50 Tolcapone was shown by Haasio et al.51 to reduce the mitochondrial membrane potential in a concentration-dependent manner. When using tolcapone at 12–20 μM concentrations, they observed a reduction in mitochondrial membrane potential to 0–7% of the initial value. Accordingly, tolcapone (20 μM) was used as positive control for Mitohealth kit which measure the mitochondrial membrane potential. Propranolol (30 μM) was recommended by the manufacturer as a positive control for measuring phospholipidosis, being able to induce accumulation of phospholipids.52
When relying on both positive and negative controls (Table 2A) in defining cytotoxic thresholds of QDs (refer to the ESI† for the equations), statistically relevant correlations were observed between either of QD concentration in culture medium or internalized QD concentration and cell responses with sigmoidal dependence on concentration. However, the analyses using total cell associated NPs were not always representative of viability trends depending on the approach used for image analysis. Oxidative stress of HUVEC and HMVEC-C on exposure to QDs was correlated with cell-internalized NP concentration, cell-membrane associated NP concentrations; as well as with QD concentration in culture medium. No correlations were observed between phospholipidosis and the various QD concentrations. On the other hand, measured cytotoxicity versus exposure liposomal concentration also fit to the dose–response sigmoidal function with high R2 of 0.84 and 0.99 for HUVEC and HMVEC-C cells, respectively (Table 2A). Sigmoidal dose–response correlations were also calculated using internalized and associated NP concentration and found to fit the data well. No further sigmoidal correlations were observed between either of oxidative stress and mitochondrial health, and liposomal concentrations. Overall results from Table 2A show that observed toxicity responses were related to exposure concentrations. This confirms that future studies can rely on exposure concentration of NPs as an easy readout when defining cytotoxicity of NPs. However, this is only generalizable for infinite systems where NP concentration is not depleted with time and using long time frame (24 h) to allow for internalization of cell-associated NPs. Future studies on finite systems are needed where toxic cell responses-NP concentration correlations are plotted beyond saturation level (saturation of the cell membrane with adhering NPs or saturation of the intercellular spaces with internalized NPs). Further, NP dose–response relationship could occasionally vary with the approach adopted for image analysis while investigating cell association of nanoparticles. This was observed for few correlations established with intensity-based artefacts of liposome cell-associated concentration. Yet, we don't have an explanation for this observation. Further future experiments on a shorter time scale may also reveal some differences with different practices of image analysis.
Interestingly, when calculating cell responses as fold increase or decrease from negative control experiments, several different correlations were observed (Table 2B). For instance, oxidative stress of HUVEC and HMVEC-C was positively correlated to liposomal concentrations (Table 2B), except for few associated liposomal concentrations readouts. Further, cellular phospholipidosis was also positively correlated to QD concentrations, except in case of few QD association readouts. In other words, small cytotoxic effects of NPs were overemphasized for those tests in absence of positive controls. In contrast, similar correlations were observed between cellular oxidative stress and QD concentrations whether relying or not on positive control measurements, but with relatively lower R2 values in case of HUVEC oxidative stress responses to QDs not normalized to positive controls.
In summary, based on the adequacy or deficiency of use of appropriate controls in cytotoxicity analysis, different correlations were sometimes observed between cell toxic responses and NP concentration among all concentration types tested; exposure concentration of NPs, surface associated NP concentration and internalized NP concentration. Observed toxicity responses were related to exposure concentrations. Further, NP dose–response relationship could occasionally vary with the approach adopted for image analysis while investigating cell association of NPs. A follow-up study focusing on investigating a series of NPs interacting with the cells using different mechanisms leading to either of dominant intracellular localization or surface adhesion of NPs could be of interest, wherein NP cytotoxicity correlations with the different NP concentration readouts are examined in parallel. This will not only highlight the predictive limiting power of each concentration readout but also the potential cytotoxicity mechanism for each NP.
Conclusions
Three variations in common practices of image analysis of confocal Z-stacks to investigate cell association of NPs: normalization per cell or per area, pixel count or fluorescence intensity as an association reporter, and analysis of 2D projections or image stacks, were shown in our study to result in significantly different association trends as well as occasional variations in cytotoxicity reports. This study also provides a methodological approach to distinguish between membrane-associated and internalized NPs on 3D reconstruction of the cell membrane and the intercellular space. Based on comparison of cytotoxicity results defined by exposed, associated and internalized NP concentrations, NP exposure concentration provides an accurate parameter to define NP cytotoxicity.Importantly, this study demonstrated the significance of consolidating general practices of developing reliable data for cytotoxicity of NPs and understanding the discrepancies among the current literature. This includes checking for colloidal stability under experimental conditions, screening for NP interference with assay reagents and use of appropriate controls. Results in this study are believed to direct future research lines towards minimizing the discrepancies in literature on nanotoxicity and to better define cytotoxicity of NPs using in vitro cell-based assays.
Conflicts of interest
There are no conflicts to declare.Acknowledgements
This study was financially supported by an Eyes High Postdoctoral Scholarship from the University of Calgary, an Alberta Innovates-Technology Futures (AITF) Fellowship, NSERC fellowship, NSERC Discovery Grant, CFI grant and NSERC-CIHR Collaborative Health Research Projects (CHRP) grant.References
- N. Lewinski, V. Colvin and R. Drezek, Small, 2008, 4, 26–49 CrossRef PubMed.
- H. I. Labouta, S. Menina, A. Kochut, S. Gordon, R. Geyer, P. Dersch and C.-M. Lehr, J. Controlled Release, 2015, 220(part A), 414–424 CrossRef PubMed.
- N. Nafee, M. Schneider, U. F. Schaefer and C.-M. Lehr, Int. J. Pharm., 2009, 381, 130–139 CrossRef PubMed.
- I. F. Uchegbu and A. Siew, J. Pharm. Sci., 2013, 102, 305–310 CrossRef PubMed.
- H. Patel, J. Chen, K. C. Das and M. Kavdia, Cardiovasc. Diabetol., 2013, 12, 142 CrossRef PubMed.
- L. E. Craig, J. P. Spelman, J. D. Strandberg and M. C. Zink, Microvasc. Res., 1998, 55, 65–76 CrossRef PubMed.
- R. E. Serda, B. Godin, E. Blanco, C. Chiappini and M. Ferrari, Biochim. Biophys. Acta, Gen. Subj., 2011, 1810, 317–329 CrossRef PubMed.
- A. J. Patil, A. L. Gramajo, A. Sharma, G. M. Seigel, B. D. Kuppermann and M. C. Kenney, Toxicology, 2009, 259, 69–76 CrossRef PubMed.
- Y. Huang, A. Obana, Y. Gohto and S. Nakajima, Lasers Surg. Med., 2004, 34, 216–226 CrossRef PubMed.
- J. Sun, S. Wang, D. Zhao, F. H. Hun, L. Weng and H. Liu, Cell Biol. Toxicol., 2011, 27, 333–342 CrossRef PubMed.
- P. L. Apopa, Y. Qian, R. Shao, N. L. Guo, D. Schwegler-Berry, M. Pacurari, D. Porter, X. Shi, V. Vallyathan, V. Castranova and D. C. Flynn, Part. Fibre Toxicol., 2009, 6, 1 CrossRef PubMed.
- B. N. Snyder-Talkington, D. Schwegler-Berry, V. Castranova, Y. Qian and N. L. Guo, Part. Fibre Toxicol., 2013, 10, 35 CrossRef PubMed.
- B. Kong, J. H. Seog, L. M. Graham and S. B. Lee, Nanomedicine, 2011, 6, 929–941 CrossRef PubMed.
- V. Stone, H. Johnston and R. P. F. Schins, Crit. Rev. Toxicol., 2009, 39, 613–626 CrossRef PubMed.
- J. Fatisson, I. R. Quevedo, K. J. Wilkinson and N. Tufenkji, Colloids Surf., B, 2012, 91, 198–204 CrossRef PubMed.
- A. Kroll, M. H. Pillukat, D. Hahn and J. Schnekenburger, Arch. Toxicol., 2012, 86, 1123–1136 CrossRef PubMed.
- S. M. Griffiths, N. Singh, G. J. S. Jenkins, P. M. Williams, A. W. Orbaek, A. R. Barron, C. J. Wright and S. H. Doak, Anal. Chem., 2011, 83, 3778–3785 CrossRef PubMed.
- A. D. Tekrony, N. M. Kelly, B. A. Fage and D. T. Cramb, Photochem. Photobiol., 2011, 87, 853–861 CrossRef PubMed.
- H. Epstein, E. Afergan, T. Moise, Y. Richter, Y. Rudich and G. Golomb, Biomaterials, 2006, 27, 651–659 CrossRef PubMed.
- Y. Kristin, T. Amy, C. Aisling, G. Yiota, W. John, D. Kwin, N. Trinh, D. Amber, R. Kristina, J. X. Yu, C. Sarah and C. David, Small, 2013, 9, 3118–3127 CrossRef PubMed.
- A. Nasti, N. Zaki, P. de Leonardis, S. Ungphaiboon, P. Sansongsak, M. Rimoli and N. Tirelli, Pharm. Res., 2009, 26, 1918–1930 CrossRef PubMed.
- R. Tantra and A. Knight, Nanotoxicology, 2011, 5, 381–392 CrossRef PubMed.
- T. Turnbull, M. Douglass, D. Paterson, E. Bezak, B. Thierry and I. Kempson, Anal. Chem., 2015, 87, 10693–10697 CrossRef PubMed.
- A. J. Giustini, R. Ivkov and P. J. Hoopes, Nanotechnology, 2011, 22, 345101 CrossRef PubMed.
- H. I. Labouta, L. K. El-Khordagui, T. Kraus and M. Schneider, Nanoscale, 2011, 3, 4989–4999 RSC.
- K. Y. Win, C. P. Teng, E. Ye, M. Low and M.-Y. Han, Small, 2015, 11, 1197–1204 CrossRef PubMed.
- L. Shang, K. Nienhaus, X. Jiang, L. Yang, K. Landfester, V. Mailänder, T. Simmet and G. U. Nienhaus, Beilstein J. Nanotechnol., 2014, 5, 2388–2397 CrossRef PubMed.
- L. Štefančíková, E. Porcel, P. Eustache, S. Li, D. Salado, S. Marco, J.-L. Guerquin-Kern, M. Réfrégiers, O. Tillement, F. Lux and S. Lacombe, Cancer Nanotechnol., 2014, 5, 1–15 CrossRef PubMed.
- R. Kalluru, F. Fenaroli, D. Westmoreland, L. Ulanova, A. Maleki, N. Roos, M. Paulsen Madsen, G. Koster, W. Egge-Jacobsen, S. Wilson, H. Roberg-Larsen, G. K. Khuller, A. Singh, B. Nyström and G. Griffiths, J. Cell Sci., 2013, 126, 3043–3054 CrossRef PubMed.
- M.-S. Martina, V. Nicolas, C. Wilhelm, C. Ménager, G. Barratt and S. Lesieur, Biomaterials, 2007, 28, 4143–4153 CrossRef PubMed.
- H. I. Labouta, T. Kraus, L. K. El-Khordagui and M. Schneider, Int. J. Pharm., 2011, 413, 279–282 CrossRef PubMed.
- A. Lesniak, F. Fenaroli, M. P. Monopoli, C. Åberg, K. A. Dawson and A. Salvati, ACS Nano, 2012, 6, 5845–5857 CrossRef PubMed.
- R. G. Bagley, J. Walter-Yohrling, X. Cao, W. Weber, B. Simons, B. P. Cook, S. D. Chartrand, C. Wang, S. L. Madden and B. A. Teicher, Cancer Res., 2003, 63, 5866–5873 Search PubMed.
- E. Rohde, C. Malischnik, D. Thaler, T. Maierhofer, W. Linkesch, G. Lanzer, C. Guelly and D. Strunk, Stem Cells, 2006, 24, 357–367 CrossRef PubMed.
- S. Vranic, N. Boggetto, V. Contremoulins, S. Mornet, N. Reinhardt, F. Marano, A. Baeza-Squiban and S. Boland, Part. Fibre Toxicol., 2013, 10, 1–16 CrossRef PubMed.
- A. A. Torrano, J. Blechinger, C. Osseforth, C. Argyo, A. Reller, T. Bein, J. Michaelis and C. Bräuchle, Nanomedicine, 2013, 8, 1815–1828 CrossRef PubMed.
- A. A. Torrano and C. Bräuchle, Beilstein J. Nanotechnol., 2014, 5, 1616–1624 CrossRef PubMed.
- S.-H. Wang, C.-W. Lee, A. Chiou and P.-K. Wei, J. Nanobiotechnol., 2010, 8, 33 CrossRef PubMed.
- J. Davda and V. Labhasetwar, Int. J. Pharm., 2002, 233, 51–59 CrossRef PubMed.
- K. M. Tsoi, Q. Dai, B. A. Alman and W. C. W. Chan, Acc. Chem. Res., 2013, 46, 662–671 CrossRef PubMed.
- N. A. Monteiro-Riviere, A. O. Inman and L. W. Zhang, Toxicol. Appl. Pharmacol., 2009, 234, 222–235 CrossRef PubMed.
- K. B. Male, B. Lachance, S. Hrapovic, G. Sunahara and J. H. T. Luong, Anal. Chem., 2008, 80, 5487–5493 CrossRef PubMed.
- A. M. Derfus, W. C. W. Chan and S. N. Bhatia, Nano Lett., 2004, 4, 11–18 CrossRef PubMed.
- R. Hardman, Environ. Health Perspect., 2006, 114, 165–172 CrossRef PubMed.
- G. Bozzuto and A. Molinari, Int. J. Nanomed., 2015, 10, 975–999 CrossRef PubMed.
- T. T. Nguyen, J. L. Swift, M. C. Burger and D. T. Cramb, J. Phys. Chem. B, 2009, 113, 10357–10366 CrossRef PubMed.
- E. Mayhew, M. Ito and R. Lazo, Exp. Cell Res., 1987, 171, 195–202 CrossRef PubMed.
- D. Koley and A. J. Bard, Proc. Natl. Acad. Sci. U. S. A., 2010, 107, 16783–16787 CrossRef PubMed.
- D. N. Criddle, S. Gillies, H. K. Baumgartner-Wilson, M. Jaffar, E. C. Chinje, S. Passmore, M. Chvanov, S. Barrow, O. V. Gerasimenko, A. V. Tepikin, R. Sutton and O. H. Petersen, J. Biol. Chem., 2006, 281, 40485–40492 CrossRef PubMed.
- G. Loor, J. Kondapalli, J. M. Schriewer, N. S. Chandel, T. L. Vanden Hoek and P. T. Schumacker, Free Radical Biol. Med., 2010, 49, 1925–1936 CrossRef PubMed.
- K. Haasio, A. Koponen, K. E. Penttilä and E. Nissinen, Eur. J. Pharmacol., 2002, 453, 21–26 CrossRef PubMed.
- U. Leli and G. Hauser, Biochem. Pharmacol., 1987, 36, 31–37 CrossRef PubMed.
Footnote |
| † Electronic supplementary information (ESI) available. See DOI: 10.1039/c8ra03849j |
| This journal is © The Royal Society of Chemistry 2018 |


