 Open Access Article
Enhanced thermoelectric properties of hydrothermally synthesized Bi0.88−xZnxSb0.12 nanoalloys below the semiconductor–semimetal transition temperature
Ahmad Gharleghiab,
Roy-Hung Hunga,
Zong-Ren Yanga,
Rasoul Malekfar b and
Chia-Jyi Liu
 *a
*a
aDepartment of Physics, National Changhua University of Education, Changhua 500, Taiwan. E-mail: liucj@cc.ncue.edu.tw
bDepartment of Physics, Faculty of Basic Science, Tarbiat Modares University, Tehran, I. R. Iran
First published on 6th June 2018
Abstract
Bi0.88−xZnxSb0.12 alloys with x = 0.00, 0.05, 0.10, and 0.15 were prepared using hydrothermal synthesis in combination with evacuating-and-encapsulating sintering. The effects of partial Zn substitution for Bi and different sintering temperatures on the thermoelectric properties of Bi0.88−xZnxSb0.12 alloys were investigated between 25 K and 425 K. Both the electrical conductivity and absolute thermopower are enhanced for the set of alloys sintered at 250 °C. The maximum power factor of 57.60 μW cm−1 K−2 is attained for the x = 0.05 alloy sintered at 250 °C. As compared with Zn-free Bi0.88Sb0.12, both the total thermal conductivity and lattice component are reduced upon Zn doping. Bipolar conduction is observed in both electronic and thermal transport. The maximum zT of 0.47 is attained at 275 K for the x = 0.05 alloy sintered at 250 °C.
1. Introduction
Thermoelectric technology provides possibility for direct conversion of solar heat or waste heat into electricity using the Seebeck effect. The efficiency (ηG) of a thermoelectric generator (TEG), depends mainly on two parameters: the dimensionless figure-of-merit (zT) of a material of which the integrated segments are made and the temperature difference (TH − TC) across the hot (TH) and cold (TC) sides of the module.1,2 Recent efforts of producing high zT materials have led to significant enhancement of the efficiency of TEG modules.3,4 For instance, the heat conversion efficiency of 2.1 watts per square centimeter via nanostructured alloys of half-Heusler is recently reported.3 Although TEG modules are beneficial to energy conversion purposes in a variety of technologies, achieving larger zT magnitudes from cost-effective materials would further widen the horizons of this technology. On the other hand, advancing construction techniques would increase the flexibility of an individual module to operate at high temperature gradients. Various property enhancement strategies for raising zT of potential TE materials beyond traditional and current magnitudes are progressively reported.5–10 Optimization of the electrical conductivity (σ), thermopower (α) and total thermal conductivity (κ = κc + κl) is required to enhance the thermoelectric figure-of-merit, i.e., zT = σα2T/(κc + κl). Previous reports suggest that the electrical conductivity and thermopower of a thermoelectric material could be enhanced via tuning the electronic band structure in order to increase the band degeneracy via doping and/or compositing.5,11 In addition, nanostructuring is widely practiced to reduce the lattice component of the total thermal conductivity.12–15 Synergetic nanocompositing using appropriate inclusions to produce endotaxially embedded additives could facilitate phonon scattering mechanism with less deterioration to the electronic transport of charge carriers.15–18 Furthermore, thermopower enhancement via nanostructuring could be achieved especially for a system possessing high density of carriers.19 Locally formed nano grains would induce electrical barriers that filter low energy charge carriers.18,20 Developing strategies for high zT values in conjunction with searching for new promising materials are the ongoing research efforts in thermoelectrics.15,21,22 Among potential thermoelectric materials, Bi1−xSbx alloys have also attracted great research attention both due to its relatively high zT and their interesting physical properties as topological insulators.3,23,24 Bi1−xSbx alloys crystallize in an A7 type crystal structure, a rhombohedral lattice with space group R
![[3 with combining macron]](https://www.rsc.org/images/entities/char_0033_0304.gif) m (#166) and 6 atoms per hexagonal unit cell.25,26 Similar to single crystals of Bi and Sb elements, Bi1−xSbx alloys also possess semimetal characteristics as a result of valance and conduction bands overlapping for 0.00 ≤ x ≤ 0.05.27,28 It is also found that Bi1−xSbx undergoes a semimetal–semiconductor transition at high Sb content and displays semiconducting characteristics for 0.07 < x ≤ 0.22.28,29 Bi1−xSbx single crystals with 0.05 < x ≤ 0.40 are n-type intrinsic narrow band-gap semiconductors with Eg ≅ 0.014 eV between 30 and 300 K.27–29 Based on the experimental results, a larger power factor could be attained at low Sb concentrations in Bi1−xSbx single crystals.27 It is known that zT of Bi1−xSbx alloys is highly anisotropic and very sensitive to the composition stoichiometry.3,24 Earlier studies of Bi1−xSbx nanowires predicted their potential of displaying relatively high zT magnitudes at low temperatures.30 Recently, the influence of applied magnetic field on the thermoelectric properties of Bi90Sb10 alloy is investigated. It is found that both the electrical resistivity and thermopower increase in the presence of an applied magnetic field.23 Moreover, it is found that a high zT value of 1.35 could be achieved for a slightly Te-doped (on the order of 10−4 at%) Bi1−xSbx single crystal under an applied magnetic field of 0.5 T.31
m (#166) and 6 atoms per hexagonal unit cell.25,26 Similar to single crystals of Bi and Sb elements, Bi1−xSbx alloys also possess semimetal characteristics as a result of valance and conduction bands overlapping for 0.00 ≤ x ≤ 0.05.27,28 It is also found that Bi1−xSbx undergoes a semimetal–semiconductor transition at high Sb content and displays semiconducting characteristics for 0.07 < x ≤ 0.22.28,29 Bi1−xSbx single crystals with 0.05 < x ≤ 0.40 are n-type intrinsic narrow band-gap semiconductors with Eg ≅ 0.014 eV between 30 and 300 K.27–29 Based on the experimental results, a larger power factor could be attained at low Sb concentrations in Bi1−xSbx single crystals.27 It is known that zT of Bi1−xSbx alloys is highly anisotropic and very sensitive to the composition stoichiometry.3,24 Earlier studies of Bi1−xSbx nanowires predicted their potential of displaying relatively high zT magnitudes at low temperatures.30 Recently, the influence of applied magnetic field on the thermoelectric properties of Bi90Sb10 alloy is investigated. It is found that both the electrical resistivity and thermopower increase in the presence of an applied magnetic field.23 Moreover, it is found that a high zT value of 1.35 could be achieved for a slightly Te-doped (on the order of 10−4 at%) Bi1−xSbx single crystal under an applied magnetic field of 0.5 T.31
In this work we have investigated the effects of both partial Zn substitution for Bi and sintering temperature on the thermoelectric properties of Bi0.88−xZnxSb0.12 alloys. Bi0.88−xZnxSb0.12 alloys were fabricated by a combination of hydrothermal synthesis and evacuated-and-encapsulated sintering. The structural/microstructural analyses and transport property measurements are performed for all the samples. We find that partial Zn substitution results in significant enhancement of thermoelectric power factor and reduction of the lattice thermal conductivity.
2. Experimental procedure
Hydrothermal methods were used to synthesize Bi0.88−xZnxSb0.12 alloys (x = 0.00, 0.05, 0.10, and 0.15). Sb, BiCl3 and ZnCl2 were quantitatively mixed to have the molar ratio of (Bi + Zn)/Sb = 0.88/0.12. In a typical reaction, 8 mmol of ethylenediaminetetraacetic acid (EDTA, C10H16N2O8), 64 mmol of NaOH and 40 mmol of NaBH4 together with 150 mL of deionized (DI) water were used. The weighed chemicals were poured into a Teflon cup containing DI water followed by stirring at room temperature. After stirring for 30 min, the Teflon cup containing the solution was loaded into an autoclave and sealed. The autoclave was then heated up to 170 °C at the rate of 2.5 °C min−1 and kept for 48 h. The resulting precipitate was then washed sequentially using DI water and ethanol followed by drying in an oven at 80 °C for 2 h. The crystal structure of the dried powder was examined using a powder X-ray diffractometer (Shimadzu 6000, Fe Kα radiation). The phase pure powders were cold pressed into cuboids. The obtained cuboids were loaded into a Pyrex tube and evacuated using a diffusion pump to reach 10−5 to 10−6 torr and then sealed. The evacuated-and-encapsulated ampoule containing the cuboids was then heated in a box furnace with the rate of 2.5 °C min−1. Different sintering temperatures were adopted for the same duration of 10 h. The lattice constants were refined for all the samples. The morphology of as-sintered samples was characterized by a field emission scanning electron microscope (FE-SEM; JEOL JSM-7800F Prime).The standard four-probe and steady-state techniques were used for simultaneously measuring electrical resistivity and thermopower, respectively, between 25 K and 425 K. The temperature difference between hot and cold ends of the sample was measured using a type E differential thermocouple.32 The temperature gradient between both ends of the sample is produced using a heater connected to one end of the sample. Thermal conductivity measurements were carried out via sandwiching a dual spiral sensor between a couple of pelleted samples using the Hot Disk plane source technique.33,34 In this technique, the dual spiral sensor also acts as a resistance thermometer. A Hot Disk thermal constants analyzer was used to record the time dependent temperature increase measured by the resistance thermometer. The measurements of the electrical resistivity, thermopower, and thermal conductivity have the estimated uncertainty of about ±3%, ±4% and ±5%, respectively. The bulk density of the sintered samples was determined using the Archimedes' method.
3. Results and discussion
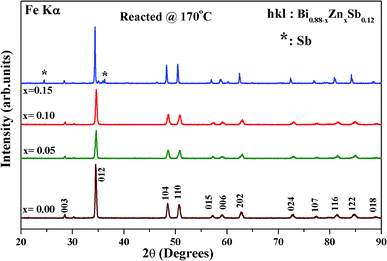
Fig. 1 shows the X-ray diffraction (XRD) patterns of as-hydrothermally synthesized powders of Bi0.88−xZnxSb0.12 alloys with x = 0.00, 0.05, 0.10, and 0.15. All the diffraction peaks could be well indexed using the Miller indices (hkl) based on a rhombohedral unit cell lattice with the space group R![[3 with combining macron]](https://www.rsc.org/images/entities/char_0033_0304.gif) m (#166).26,35 Except for the x = 0.15 sample, all the Bi0.88−xZnxSb0.12 powders are of single phase (Fig. 1). The impurity peak indicated by asterisks in the XRD pattern of x = 0.15 is attributed to the most intense peaks of Sb phase.
m (#166).26,35 Except for the x = 0.15 sample, all the Bi0.88−xZnxSb0.12 powders are of single phase (Fig. 1). The impurity peak indicated by asterisks in the XRD pattern of x = 0.15 is attributed to the most intense peaks of Sb phase.
The hydrothermally synthesized Bi0.88−xZnxSb0.12 powders (x = 0.00, 0.05, 0.10 and 0.15) were sintered at two different temperatures, i.e., 170 °C and 250 °C, for the same duration of 10 h. Fig. 2a and b show the XRD patterns of Bi0.88−xZnxSb0.12 sintered at 170 °C and 250 °C, respectively. All the diffraction peaks of the as-sintered Bi0.88−xZnxSb0.12 samples are well indexed with the Miller indices. It should be noted that the x = 0.15 sample turns into a single phase upon sintering either at 170 °C and 250 °C. Table 1 shows the refined lattice constants of all the Bi0.88−xZnxSb0.12 alloys. The lattice constants in both set of samples shrink with increasing Zn content. This is associated with a smaller effective ionic radius of Zn2+ (0.74 Å for coordination number = 6) than that of Bi3+ (1.03 Å for coordination number = 6).36,37
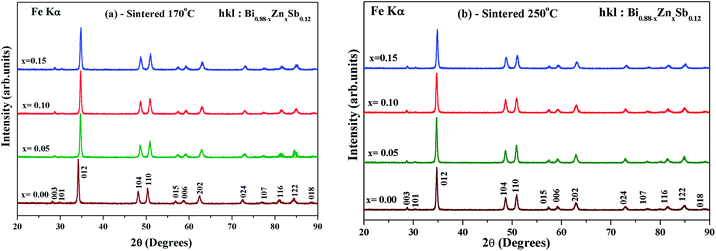 | ||
| Fig. 2 Powder XRD patterns of Bi0.88−xZnxSb0.12 alloys with x = 0.00, 0.05, 0.10, and 0.15 sintered (a) at 170 °C and (b) 250 °C for the same duration of time of 10 h. | ||
| Property | Bi0.88−xZnxSb0.12 | ||||
|---|---|---|---|---|---|
| Unit | x = 0.00 | x = 0.05 | x = 0.10 | x = 0.15 | |
| Lattice constant, a = b, c (sintered @ 170 °C) | Å | 4.5535(2), 11.8034(9) | 4.5064(2), 11.7609(9) | 4.5011(2), 11.7595(8) | 4.4980(1), 11.7517(5) |
| Lattice constant, a = b, c (sintered @ 250 °C) | Å | 4.5126(2), 11.7655(9) | 4.5045(2), 11.7710(9) | 4.5008(2), 11.7698(8) | 4.4906(1), 11.7295(5) |
| Relative density (sintered @ 170 °C) | % | 93.98 | 94.65 | 97.92 | 99.39 |
| Relative density (sintered @ 250 °C) | % | 95.36 | 95.64 | 97.99 | 99.21 |
| Average grain size (sintered @ 170 °C) | nm | 58 | 48 | 49 | 45 |
| Average grain size (sintered @ 250 °C) | nm | 59 | 67 | 53 | 55 |
The relative bulk density of Bi0.88−xZnxSb0.12 alloys falls between 94–99% and 95–99% of the theoretical density for samples sintered at 170 °C and 250 °C, respectively (Table 1). The porosity of Bi0.88−xZnxSb0.12 alloys seems to decrease with increasing Zn content based on the density measurements.
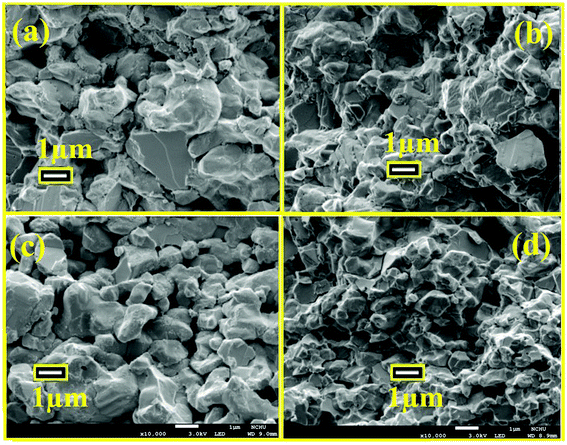
Fig. 3 illustrates the FE-SEM images of the fractured surface of the x = 0.00 and 0.05 samples sintered at 170 °C (Fig. 3a and b) and 250 °C (Fig. 3c and d), respectively. One can readily see that the microstructures are irregularly multi-sized aggregates with porosity. The unevenly distribution of porosity within the present structures is apparent from the micrographs.
Fig. 4a and b illustrates the temperature dependence of the electrical conductivity for Bi0.88−xZnxSb0.12 alloys (x = 0.00, 0.05, 0.10, and 0.15) sintered at 170 °C and 250 °C, respectively, between 25 K and 425 K. Except for the x = 0.15 sample sintered at 170 °C, it can be readily seen that the electrical conductivity exhibits a hump behavior and is nonmetal-like below 300–325 K. As compared with the x = 0.00 sample, the electrical conductivity increases for the x = 0.05 and 0.10 alloys for all the investigated temperatures, while it decreases for x = 0.15 for most of the investigated temperatures. For the same Zn content, the electrical conductivity is larger for the set of alloys sintered at 250 °C than that sintered at 170 °C. For both sets of samples, the electrical conductivity is largest for the x = 0.10 alloy with its maximum occurring at 300 K. Similar temperature dependence of the electrical conductivity is also observed for Bi0.88Sb0.12 alloys synthesized via quenching and annealing procedures.38,39 The temperature dependence of the electrical conductivity for the x = 0.15 alloy is similar to that of Bi0.85Sb0.15 fabricated using mechanical alloying combined with high-pressure sintering procedure.40 The temperature dependence of the electrical conductivity for Bi0.88−xZnxSb0.12 is expected to be closely associated with the relative shifting of the T, Ls, and La bands.41,42 The downturn of electrical conductivity above 300–325 K could be attributed to the semiconductor–semimetal transition, which will be discussed in the following section.
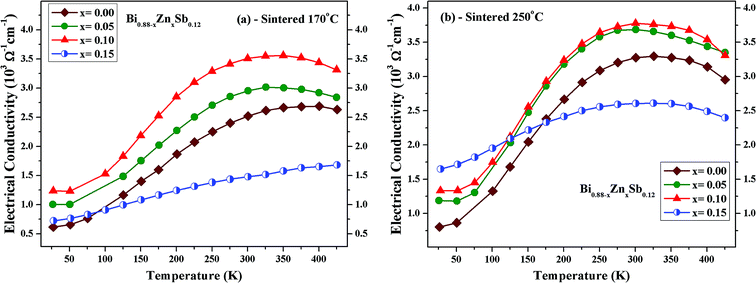 | ||
| Fig. 4 Temperature dependence of the electrical conductivity of Bi0.88−xZnxSb0.12 alloys (x = 0.00, 0.05, 0.10, and 0.15) sintered at (a) 170 °C and (b) 250 °C. | ||
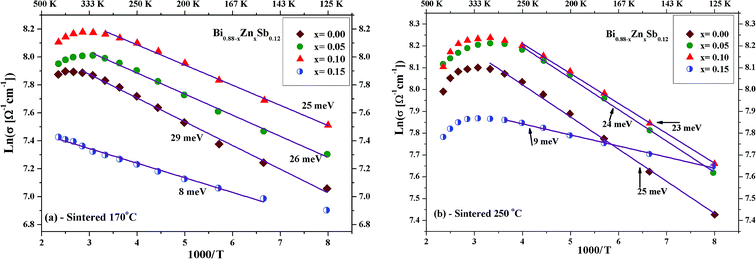
Fig. 5a and b displays ln(σ) versus T−1 for Bi0.88−xZnxSb0.12 alloys with x = 0.00, 0.05, 0.10, and 0.15 sintered at 170 °C and 250 °C, respectively. The corresponding transition temperature of each alloy is shown in the plot. The semiconductor–semimetal transition temperature is lower for the alloys sintered at 250 °C than at 170 °C. Moreover, the transition temperature for the x = 0.00 alloy is ∼400 K, while the x = 0.15 alloy displays no transition within the investigated temperature region (Fig. 5a). For the set of alloys sintered at 250 °C, the semiconductor–semimetal transition temperature varies between 300 K (x = 0.05 and 0.10) and 326 K (x = 0.00 and 0.15).
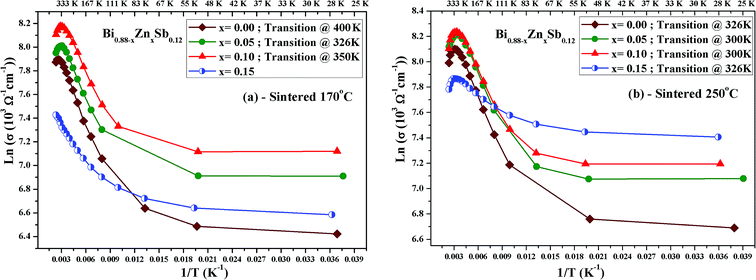 | ||
| Fig. 5 Plot of ln(σ) versus T−1 for Bi0.88−xZnxSb0.12 alloys with x = 0.00, 0.05, 0.10, and 0.15, sintered (a) at 170 °C and (b) at 250 °C. | ||
Furthermore, to explore the influence of Zn dopants on the electronic structure of Bi0.88−xZnxSb0.12 alloys, the electrical conductivity curves are fitted using the Arrhenius relationship,  , in the activated conduction region, where σ is the electrical conductivity, σ0 the pre-exponential factor, Eg the energy band gap, kB the Boltzmann's constant, and T the absolute temperature. Fig. 6a and b shows the fitted curves of ln(σ) versus T−1 for Bi0.88−xZnxSb0.12 alloys with x = 0.00, 0.05, 0.10, and 0.15 sintered at 170 °C and 250 °C, respectively. Obviously, the Arrhenius relationship could only be satisfied for limited temperature intervals below the semiconductor–semimetal transition temperature. The magnitudes of Eg are estimated from the slop of the fitted curves and indicated in the vicinity of the fitting lines. The magnitudes of Eg for both set of alloys display no systematic trend with Zn content. As shown in Fig. 6a, the magnitude of Eg for the set of alloys sintered at 170 °C is slightly larger than that for the set of alloys sintered at 250 °C. Among Bi0.88−xZnxSb0.12, the x = 0.15 alloy has the narrowest band gap. The magnitude of Eg is comparable with that of nanosized Bi1−xSbx alloys for 0.12 ≤ x ≤ 30.41 Moreover, the diminished electrical conductivity of the x = 0.15 alloys could be partly attributed to the increased offset between the light hole and heavy hole bands. This effect would weaken the contribution of heavy bands to the electronic properties.41,42 Similar scenario is provided for explaining the influence of valence band offset on electronic properties of p-type PbTe1−xSex alloys.11
Fig. 7a and b shows the temperature dependence of thermopower for Bi0.88−xZnxSb0.12 alloys with x = 0.00, 0.05, 0.10, and 0.15 sintered at 170 °C and 250 °C, respectively. The thermopower of all the samples is negative indicating that electrons are the majority charge carriers. In addition, the thermopower curves in both set of alloys display similar temperature dependence for the same Zn content x. The temperature dependences of thermopower for Bi0.88−xZnxSb0.12 alloys are similar to that of Bi0.85Sb0.15 fabricated using melt-spinning combined with spark plasma sintering and of a Bi88Sb12 single crystal grown by a modified Bridgman method.35,43 As shown in Fig. 8a, the absolute thermopower for the set of samples sintered at 170 °C increases with increasing temperature between 25 and 150 K, while it keeps increasing even up to 275 K for x = 0.15. Besides, the thermopowers of all the samples only show small differences and display similar temperature dependence between 275 K and 425 K. Among the set of alloys sintered at 250 °C, the x = 0.05 alloy exhibits the largest absolute thermopowers between 75 and 375 K. It is noted that the variation of thermopower with temperature for the x = 0.15 alloy is slower than other alloys, which resembles that of Bi0.85Sb0.15 fabricated using mechanical alloying combined with high-pressure sintering.40
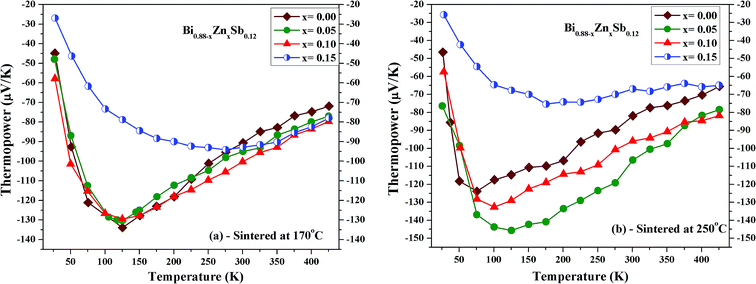 | ||
| Fig. 7 Temperature dependence of thermopower of Bi0.88−xZnxSb0.12 alloys with x = 0.00, 0.05, 0.10, and 0.15 sintered at (a) 170 °C and (b) 250 °C for the same duration of 10 h. | ||
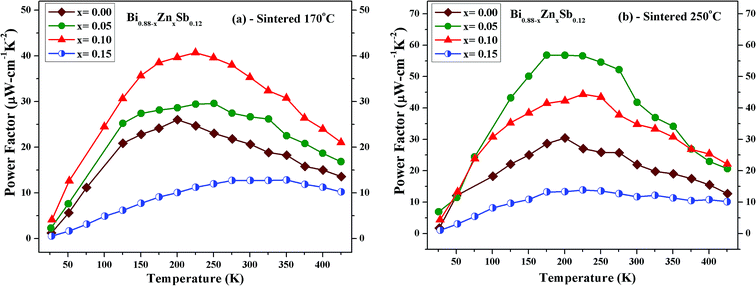 | ||
| Fig. 8 Temperature dependence of power factor (σα2) of Bi0.88−xZnxSb0.12 alloys with x = 0.00, 0.05, 0.10, and 0.15 sintered at (a) 170 °C and (b) 250 °C for the same duration of 10 h. | ||
Fig. 8 shows the thermoelectric power factor (σα2) of Bi0.88−xZnxSb0.12 alloys with x = 0.00, 0.05, 0.10, and 0.15 as a function of temperature from 50 K to 425 K. It can be readily seen that the set of alloys sintered at 250 °C (Fig. 8b) has larger power factors than those for the set of alloys sintered at 170 °C (Fig. 8a). For the former, the x = 0.05 alloy reaches the maximum power factor of 57.6 μW cm−1 K−2 at 175 K; for the latter, the x = 0.10 alloy reaches the maximum power factor of 40.8 μW cm−1 K−2 at 225 K.
Fig. 9 displays the temperature dependence of the total thermal conductivity (κ) of Bi0.88−xZnxSb0.12 alloys with x = 0.00, 0.05, 0.10, and 0.15 between 125 K and 300 K. The x = 0.00 alloy has the highest κ in both set of alloys, which however is still lower than that of a polycrystalline sample of Bi88Sb12 fabricated using evacuating-and-encapsulating heating followed by water quenching.43 It can be readily seen that κ decreases upon partial replacement of Zn for Bi in both set of alloys. For the set of alloys sintered at 170 °C, the x = 0.05 alloy has the κ of 2.31 W m−1 K−1 at 125 K and 2.72 W m−1 K−1 at 300 K, while the x = 0.00 alloy has the κ of 3.35 W m−1 K−1 at 125 K and 3.67 W m−1 K−1 at 300 K. For the set of alloys sintered at 250 °C, the x = 0.15 alloy has the κ of 2.68 W m−1 K−1 at 125 K and 3.06 W m−1 K−1 at 300 K, while the x = 0.00 alloy has the κ of 3.21 W m−1 K−1 at 125 K and 3.48 W m−1 K−1 at 300 K.
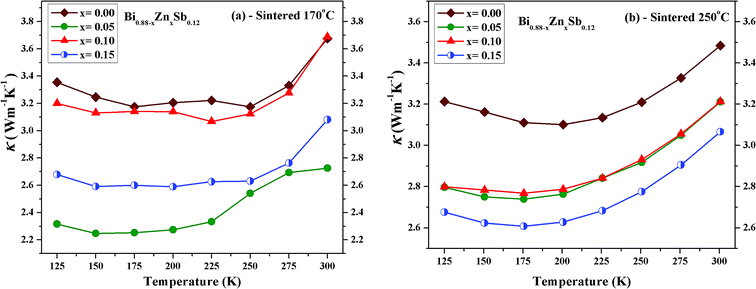 | ||
| Fig. 9 Temperature dependence of the total thermal conductivity (κ) of Bi0.88−xZnxSb0.12 alloy with x = 0.00, 0.05, 0.10, and 0.15 sintered at (a) 170 °C and (b) 250 °C for the same duration of 10 h. | ||
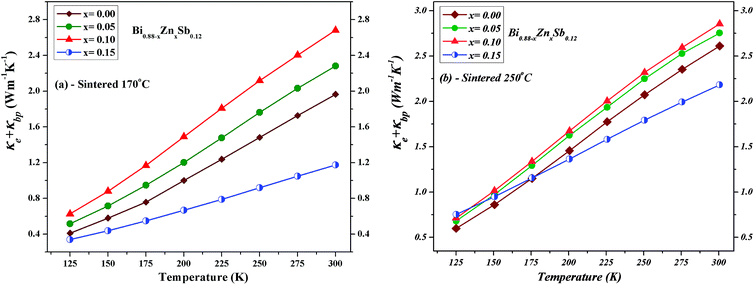
To derive the contribution of charge carriers to the total thermal conductivity, the electronic component (κe + κbp) are separately estimated. The Wiedemann–Franz law is applied to estimate κe = σLT, where L = 2.44 × 10⁻⁸ W Ω K−2 denotes the Lorenz number and σ the measured electrical conductivity at a given temperature T. The upturn behavior of κ can be attributed to bipolar contribution to the electronic thermal conductivity. Hence, we consider the bipolar contribution of the thermal conductivity κbp, which can be expressed using the following equation44,45
 | (1) |
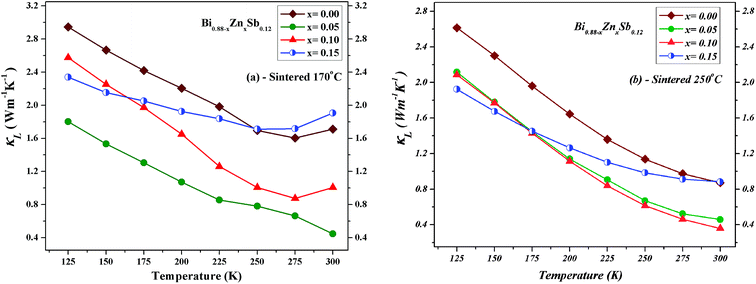
The lattice phonon component (κL) is obtained by subtracting the electronic contribution from the total thermal conductivity (κL = κ − κe − κbp). The results are plotted in Fig. 11 for both set of alloys sintered at 170 °C and 250 °C, respectively. One can readily see that the κL of alloys sintered at 170 °C is slightly lower than that sintered at 250 °C because the latter might have better crystallinity. The magnitude of κL decreases upon Zn doping for both set of alloys and dominates at low temperatures but becomes smaller than electronic contribution as the temperature approaches 300 K. Point defects can account for the reduction of κL upon Zn doping due to the mass difference between Zn and Bi.33,46,47 Moreover, the smallest κL occurs at the Zn doping content of x = 0.05 and x = 0.10 sintered at 170 °C and 250 °C, respectively. As the temperature increases up to 300 K, unlike the x = 0.05 and 0.10 alloys, the κL of the x = 0.15 alloy gradually approach that of the x = 0.00 alloy.
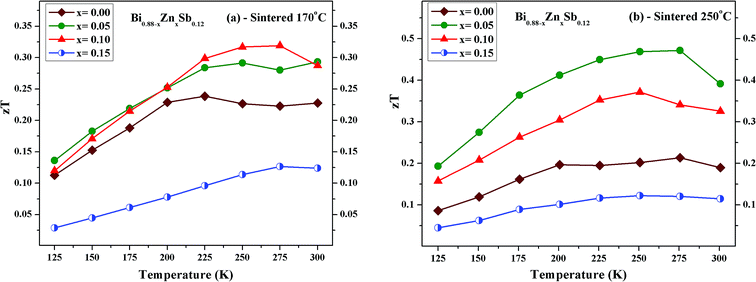
Fig. 12 displays the temperature dependence of zT for Bi0.88−xZnxSb0.12 alloys with x = 0.00, 0.05, 0.10, and 0.15. The maximum zT value is 0.32 and 0.47 both occurring at 275 K for x = 0.10 alloy sintered at 170 °C and the x = 0.05 alloy sintered at 250 °C, respectively. The value of zT = 0.47 is comparable or even higher as compared with other reports for Bi–Sb alloys in the absence of magnetic field.23,24,27 Moreover, the maximum zT value is smaller than 0.25 for the x = 0.00 alloy in both set of samples, while it is enhanced as compared with that of mechanically alloyed Bi88Sb12.48 For comparison with other similar bismuth antimony alloy systems, a maximum value of zT ≈ 0.23 was attained for Sn-doped (Bi85Sb15)1−xSnx with x = 0.00 fabricated using pressureless sintering techniques;49 a maximum value of zT ≈ 0.26 was attained at 260 K for (Bi85Sb15)1−xPbx with x = 0.00 fabricated using mechanical alloying in combination with pressureless sintering.50 For Bi85Sb13Nb2 fabricated using high-press sintering, a maximum of zT = 0.36 was attained at 200 K.40 It should be noted that zT > 1 could be attained for Bi–Sb–Te alloys around room temperature.51,52
4. Conclusions
A series of Bi0.88−xZnxSb0.12 alloys with x = 0.00, 0.05, 0.10, and 0.15 was fabricated via hydrothermal synthesis in combination with evacuating-and-encapsulated sintering. The effects of partially replacing Bi by Zn and different sintering temperatures on electronic and thermal transport of Bi0.88−xZnxSb0.12 alloys were investigated. The XRD patterns of as-synthesized Bi0.88−xZnxSb0.12 alloys indicate that Bi0.88−xZnxSb0.12 with x = 0.00, 0.05, and 0.10 are of single phase, while the x = 0.15 alloy contains an impurity phase of Sb. The lattice constant refinements show the shrinkage of the lattice constants, which confirms the partial replacement of Zn on Bi sites.The downturn temperature dependence of the electrical conductivity around room temperature is attributed to semiconductor–semimetal transition, which is observed for all the alloys except the x = 0.15 alloy sintered at 170 °C. For the effects of Zn doping, the power factors are enhanced for all Bi0.88−xZnxSb0.12 alloys, except that for the x = 0.15 alloy. For the effects of sintering temperature, larger power factors could be attained for alloys sintered at 250 °C as compared to 170 °C. The largest power factor of 57.60 μW cm−1 K−2 is attained for the x = 0.05 alloy sintered at 250 °C. The total thermal conductivity in both sets of the Bi0.88−xZnxSb0.12 alloys is reduced as compared with the Zn-free Bi0.88Sb0.12 alloy.
Bipolar transport plays a significant role both in the electronic and thermal transport. It is found that the electronic thermal conductivity dominates the heat conduction in the vicinity of 273 K. The largest zT of 0.47 is attained at 275 K for the x = 0.05 alloy sintered at 250 °C.
Conflicts of interest
There are no conflicts of interest to declare.Acknowledgements
This work was supported by Ministry of Science and Technology of Taiwan under the Grant No. 104-2112-M-018-002-MY3. Ahmad Gharleghi would like to express thanks for the postdoctoral fellowship sponsored by MOST during the stay in Taiwan and by Iran National Elite Association.References
- D. M. Rowe, Thermoelectrics Handbook: Macro to Nano, CRC/Taylor & Francis, Boca Raton, 2006 Search PubMed.
- H. J. Goldsmid, Thermoelectric refrigeration, Plenum Press, New York, 1964 Search PubMed.
- Y. Zhang, X. Wang, M. Cleary, L. Schoensee, N. Kempf and J. Richardson, Appl. Therm. Eng., 2016, 96, 83–87 CrossRef.
- M. Jaworski, M. Bednarczyk and M. Czachor, Appl. Therm. Eng., 2016, 96, 527–533 CrossRef.
- T. Fu, X. Yue, H. Wu, C. Fu, T. Zhu, X. Liu, L. Hu, P. Ying, J. He and X. Zhao, Journal of Materiomics, 2016, 2, 141–149 CrossRef.
- A. Mehdizadeh Dehkordi, M. Zebarjadi, J. He and T. M. Tritt, Mater. Sci. Eng., R, 2015, 97, 1–22 CrossRef.
- P. Sun, B. Wei, J. Zhang, J. M. Tomczak, A. M. Strydom, M. Søndergaard, B. B. Iversen and F. Steglich, Nat. Commun., 2015, 6, 7475 CrossRef PubMed.
- X. Zhang, C. Chang, Y. Zhou and L.-D. Zhao, Materials, 2017, 10, 198 CrossRef PubMed.
- W.-T. Chiu, C.-L. Chen and Y.-Y. Chen, Sci. Rep., 2016, 6, 23143 CrossRef PubMed.
- J. G. Park and Y. H. Lee, Curr. Appl. Phys., 2016, 16, 1202–1215 CrossRef.
- Y. Pei, X. Shi, A. LaLonde, H. Wang, L. Chen and G. J. Snyder, Nature, 2011, 473, 66–69 CrossRef PubMed.
- D.-B. Zhang, H.-Z. Li, B.-P. Zhang, D.-D. Liang and M. Xia, RSC Adv., 2017, 7, 10855 RSC.
- J.-F. Li, W.-S. Liu, L.-D. Zhao and M. Zhou, NPG Asia Mater., 2010, 2, 152–158 CrossRef.
- G. Joshi, H. Lee, Y. Lan, X. Wang, G. Zhu, D. Wang, R. W. Gould, D. C. Cuff, M. Y. Tang, M. S. Dresselhaus, G. Chen and Z. Ren, Nano Lett., 2008, 8, 4670–4674 CrossRef PubMed.
- K. Biswas, J. He, I. D. Blum, C.-I. Wu, T. P. Hogan, D. N. Seidman, V. P. Dravid and M. G. Kanatzidis, Nature, 2012, 489, 414–418 CrossRef PubMed.
- Z.-H. Ge, D. Song, X. Chong, F. Zheng, L. Jin, X. Qian, L. Zheng, R. E. Dunin-Borkowski, P. Qin, J. Feng and L.-D. Zhao, J. Am. Chem. Soc., 2017, 139, 9714–9720 CrossRef PubMed.
- K. Biswas, J. He, Q. Zhang, G. Wang, C. Uher, V. P. Dravid and M. G. Kanatzidis, Nat. Chem., 2011, 3, 160–166 CrossRef PubMed.
- J.-H. Bahk, Z. Bian and A. Shakouri, Phys. Rev. B: Condens. Matter Mater. Phys., 2013, 87, 075204 CrossRef.
- Y.-M. Lin and M. S. Dresselhaus, Phys. Rev. B: Condens. Matter Mater. Phys., 2003, 68, 075304 CrossRef.
- J. Martin, L. Wang, L. Chen and G. S. Nolas, Phys. Rev. B: Condens. Matter Mater. Phys., 2009, 79, 115311 CrossRef.
- L.-D. Zhao, C. Chang, G. Tan and M. G. Kanatzidis, Energy Environ. Sci., 2016, 9, 3044–3060 Search PubMed.
- Z. Liu, H. Geng, J. Mao, J. Shuai, R. He, C. Wang, W. Cai, J. Sui and Z. Ren, J. Mater. Chem. A, 2016, 4, 16834–16840 Search PubMed.
- M. Murata, A. Yamamoto, Y. Hasegawa and T. Komine, J. Electron. Mater., 2016, 45(3), 1875–1885 CrossRef.
- H. Zhang, J. S. Son, J. Jang, J.-S. Lee, W.-L. Ong, J. A. Malen and D. V. Talapin, ACS Nano, 2013, 7(11), 10296–10306 CrossRef PubMed.
- M. Hansen and K. Anderko, Constitution of binary alloys, McGraw-Hill Book Company, New York, 1958, pp. 332–334 Search PubMed.
- R. J. Cava, H. Ji, M. K. Fuccillo, Q. D. Gibson and Y. S. Hor, J. Mater. Chem. C, 2013, 1, 3176–3189 RSC.
- G. E. Smith and R. Wolfe, J. Appl. Phys., 1962, 33(3), 841–846 CrossRef.
- Y.-M. Lin, O. Rabin, S. B. Cronin, J. Y. Ying and M. S. Dresselhaus, Appl. Phys. Lett., 2002, 81(13), 2403–2405 CrossRef.
- B. Lenoir, A. Dauscher, X. Devaux, Y. I. Ravich, R. Martin-Lopez, H. Scherrer and S. Scherrer, in Proceedings of the 15th international conference on thermoelectrics, IEEE, Pasadena, CA, Piscataway, NJ, 1996, p. 1 Search PubMed.
- O. Rabina, Y.-M. Lin and M. S. Dresselhaus, Appl. Phys. Lett., 2001, 79(1), 81–83 CrossRef.
- V. S. Zemskov, A. D. Belaya, U. S. Beluy and G. N. Kozhemyakin, J. Cryst. Growth, 2000, 212, 161–166 CrossRef.
- A. Gharleghi and C.-J. Liu, J. Alloys Compd., 2014, 592, 277–282 CrossRef.
- A. Gharleghi, Y.-H. Chu, F.-H. Lin, Z.-R. Yang, Y.-H. Pai and C.-J. Liu, ACS Appl. Mater. Interfaces, 2016, 8, 5205–5215 Search PubMed.
- C.-J. Liu, H.-C. Lai, Y.-L. Liu and L.-R. Chen, J. Mater. Chem., 2012, 22, 4825–4831 RSC.
- T. Luo, S. Wang, H. Li and X. Tang, Intermetallics, 2013, 32, 96–102 CrossRef.
- X.-Y. Zha, L.-J. Gao, H.-C. Bai, J.-L. Wang and S.-F. Wang, Chin. Phys. B, 2017, 26(10), 107202 CrossRef.
- D. M. Freik, S. I. Mudryi, I. V. Gorichok, V. V. Prokopiv, O. M. Matkivsky, I. O. Arsenjuk, O. S. Krynytsky and V. M. Bojchyk, Ukr. J. Phys., 2016, 61, 155–159 CrossRef.
- K. Malik, D. Das, S. K. Neogi, A. K. Deb, A. Dasgupta, S. Bandyopadhyay and A. Banerjee, J. Phys. Chem. Solids, 2016, 91, 7–12 CrossRef.
- H. Kitagawa, H. Noguchi, T. Kiyabu, M. Itoh and Y. Noda, J. Phys. Chem. Solids, 2004, 65, 1223–1227 CrossRef.
- C. Song, R. Huang, M. Zhou, L. Gong and L. Li, J. Phys. Chem. Solids, 2010, 71, 999–1003 CrossRef.
- C. H. Will, M. T. Elm, P. J. Klar, B. Landschreiber, E. Günes and S. Schlecht, J. Appl. Phys., 2013, 114, 193707 CrossRef.
- A. L. Jain, Phys. Rev., 1959, 114(6), 1518 CrossRef.
- C. M. Orovets, A. M. Chamoire, H. Jin, B. Wiendlocha and J. P. Heremans, J. Electron. Mater., 2012, 41, 1648–1652 CrossRef.
- A. R. Regel, I. A. Smirnov and E. V. Shadrichev, J. Non-Cryst. Solids, 1972, 8–10, 266–271 CrossRef.
- J. He, M. G. Kanatzidis and V. P. Dravid, Mater. Today, 2013, 16, 166–176 CrossRef.
- P. G. Klemens, Proc. Phys. Soc., London, Sect. A, 1955, 68, 1113–1128 CrossRef.
- J. Callaway and H. C. von Baeyer, Phys. Rev., 1960, 120, 1149–1154 CrossRef.
- R. Martin-Lopez, A. Dauscher, H. Scherrer, J. Hejtmanek, H. Kenzari and B. Lenoir, Appl. Phys. A, 1999, 68, 597–602 CrossRef.
- Z. Chen, M. Zhou, R. Huang, C. Huang, C. Song, Y. Zhou and L. Li, J. Electron. Mater., 2012, 41(6), 1725–1729 CrossRef.
- Z. Chen, M. Zhou, R. J. Huang, C. M. Song, Y. Zhou and L. F. Li, J. Alloys Compd., 2012, 511, 85–89 CrossRef.
- B. Poudel, Q. Hao, Y. Ma, Y. Lan, A. Minnich, B. Yu, X. Yan, D. Wang, A. Muto, D. Vashaee, X. Chen, J. Liu, M. S. Dresselhaus, G. Chen and Z. Ren, Science, 2008, 320, 634–638 CrossRef PubMed.
- Y. Luo, J. Yang, Q. Jiang, W. Li, D. Zhang, Z. Zhou, Y. Cheng, Y. Ren and X. He, Acta Mater., 2017, 127, 185–191 CrossRef.
| This journal is © The Royal Society of Chemistry 2018 |

