 Open Access Article
Dual-modal imaging and excellent anticancer efficiency of cisplatin and doxorubicin loaded NaGdF4:Yb3+/Er3+ nanoparticles†
Zhiyang Zhang,
Jiayi Sheng ,
Miaomiao Zhang,
Xiaoyan Ma,
Zhirong Geng
 * and
Zhilin Wang
 *
*
State Key Laboratory of Coordination Chemistry, Collaborative In-novation Center of Advanced Microstructure, School of Chemistry and Chemical Engineering, Nanjing University, Nanjing 210023, P. R. China. E-mail: gengzr@nju.edu.cn; wangzl@nju.edu.cn; Fax: +86-25-89687761; Tel: +86-25-89689026
First published on 18th June 2018
Abstract
NaGdF4:Yb3+/Er3+ nanoparticles were synthesized via a modified hydrothermal route. The dependence of structure and morphology on the dosage of sodium polyacrylate was studied by X-ray diffraction (XRD) and transmission electron microscopy (TEM). The as-prepared nanoparticles could be used for T2 weighted magnetic resonance imaging due to the paramagnetism of Gd3+. cis-dichlorodiamineplatinum (CDDP) could be loaded onto NaGdF4:Yb3+/Er3+ nanoparticles through binding carboxyl in the form of Pt–O bonds, and doxorubicin (DOX) could be loaded via hydrogen bonding. DOX could also be loaded onto the NaGdF4–CDDP composite in the same manner, and the loading efficiency of both drugs remained unchanged. Three as-prepared drug delivery systems were used for tumor inhibition both in vitro and in vivo, and the results indicated that NaGdF4–CDDP–DOX displayed the greatest inhibitory capacity.
Introduction
Anti-tumor drugs can be toxic to normal tissues and organs when killing tumor cells.1,2 However, drug delivery system based on drug-loaded nanoparticles can enter tumors due to their enhanced permeability and retention effects,3,4 release drugs, and inhibit tumor growth while reducing side effects to normal tissues and organs caused by the nonspecific accumulation of drugs.5,6 Many types of nanoparticles with excellent biocompatibility have been chosen to establish such drug delivery systems, such as Au,7 SiO2,8,9 polymers,4,6,10 carbon nanomaterials,11 magnetic nanoparticles,12,13 rare-earth fluoride nanoparticles,14,15 and others. Because rare-earth nanoparticles exhibit superb luminescence properties originating from the f–f electronic transition in the 4f electrons of rare-earth ions, these nanoparticles can be used to trace nanoparticles loaded with drugs. Therefore, rare-earth nanoparticles rank among the most common nanoparticles used to establish drug-delivery systems.16 Due to their weak auto-fluorescence background, minimum photodamage to organs and depth of light-penetration in tissues when infrared radiation is used as the emission light,17–19 rare-earth doped upconversion nanoparticles are especially suitable for tracing and drug delivery.20As a familiar matrix, NaGdF4 nanoparticles doped with various rare-earth ions can emit various upconversion luminescence spectra.17,21,22 In addition to a superb upconversion luminescence property, the paramagnetism of Gd3+ ions makes rare-earth doped NaGdF4 nanoparticles suitable for both upconversion luminescence imaging and magnetic resonance imaging.23,24 Chemotherapy drugs,25 photodynamics therapy drugs,26 gene segments,27 and other molecules, can be loaded onto rare-earth doped NaGdF4 nanoparticles to build drug delivery systems, which have been confirmed to be useful for tumor inhibition. Chemotherapy is the most common clinical cancer treatment, and usually, two or more chemotherapy drugs are used simultaneously during treatment. Although NaGdF4 nanoparticles loaded with two drugs for cancer treatment have been reported,28 the preparation process was complicated, and the loading efficiency could be influenced during the loading process by the hydrophobic interactions of both drugs. Thus, using a simple method to prepare nanoparticles for loading two drugs simultaneously is essential.
Herein, a revised solvothermal method in which sodium polyacrylate (PAAs), acting as a chelating agent, was used to synthesize NaGdF4:Yb3+/Er3+ nanoparticles.29 Carboxyl groups of PAAs on the surface rendered these as-prepared NaGdF4:Yb3+/Er3+ nanoparticles hydrophilic and thus suitable for biological application. Green upconversion luminescence, which was used to monitor the cellular uptake process of the drug-loaded nanoparticles could be observed upon excitation with a 980 nm CW laser. NaGdF4:Yb3+/Er3+ nanoparticles could also be used as a magnetic resonance imaging agent, due to the paramagnetism of Gd3+ ions.
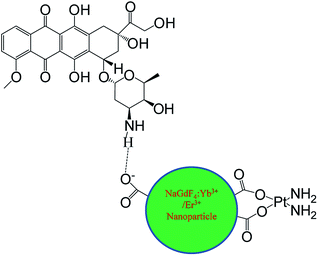
cis-Dichlorodiamineplatinum (CDDP) loaded NaGdF4:Yb3+/Er3+ nanoparticles (NaGdF4–CDDP) were prepared through the binding of CDDP to carboxyl groups at the surface of the nanoparticles by Pt–O bonds. Doxorubicin (DOX) could bind to NaGdF4:Yb3+/Er3+ nanoparticles and the NaGdF4–CDDP compound via hydrogen bond interactions with the carboxyl groups to prepare DOX loaded NaGdF4:Yb3+/Er3+ nanoparticles (NaGdF4–DOX) and DOX loaded NaGdF4–CDDP compounds (NaGdF4–CDDP–DOX) (Scheme 1). The as-loaded drugs could be released in both physiological and subacid conditions, and they were released more rapidly under sub-acid conditions, which were similar to the tumor microenvironment. These as-prepared drug delivery systems were demonstrated to be effective for tumor inhibition both in vitro and in vivo, and the two-drug-loaded NaGdF4–CDDP–DOX compounds exhibited a more pronounced therapeutic effect.
Materials and methods
Materials
Gd(NO3)3·6H2O, Yb(NO3)3·6H2O, and Er(NO3)3·6H2O were purchased from Shanghai Diyang Chemical Co., Ltd. Sodium polyacrylate (PAAs) was purchased from Sigma-Aldrich Co., Ltd. CDDP was obtained from Shandong Boyuan Chemical Co., Ltd. DOX was purchased from Adamas Co., Ltd. Ethylene glycol (EG) was obtained from Nanjing Chemical Reagent Co., Ltd. Other chemical reagents were purchased from Sinopharm Chemical Reagent Co., Ltd. All reagents were used as received without further purification.Preparation of NaGdF4:Yb3+/Er3+ nanoparticles
NaGdF4:Yb3+/Er3+ nanoparticles were prepared through a modified solvothermal route. A total of 1.2 mmol of Ln(NO3)3·6H2O (Ln = Gd, Yb, Er, Gd![[thin space (1/6-em)]](https://www.rsc.org/images/entities/char_2009.gif) :
:![[thin space (1/6-em)]](https://www.rsc.org/images/entities/char_2009.gif) Yb
Yb![[thin space (1/6-em)]](https://www.rsc.org/images/entities/char_2009.gif) :
:![[thin space (1/6-em)]](https://www.rsc.org/images/entities/char_2009.gif) Er = 78
Er = 78![[thin space (1/6-em)]](https://www.rsc.org/images/entities/char_2009.gif) :
:![[thin space (1/6-em)]](https://www.rsc.org/images/entities/char_2009.gif) 20
20![[thin space (1/6-em)]](https://www.rsc.org/images/entities/char_2009.gif) :
:![[thin space (1/6-em)]](https://www.rsc.org/images/entities/char_2009.gif) 2) and 2.4 mmol of NaCl were dissolved in 20 mL of EG. Then, a certain amount of PA PAAs As was added to the solution. After stirring for 1 h, 10 mL of EG containing 5 mmol NH4F was added to the mixture under stirring. The mixture was then transferred into a 50 mL Teflon-lined stainless steel autoclave and heated at 200 °C for 12 h. After the autoclave was cooled to room temperature, the white powders were collected by centrifugation, washed with ethanol three times and kept in ethanol.
2) and 2.4 mmol of NaCl were dissolved in 20 mL of EG. Then, a certain amount of PA PAAs As was added to the solution. After stirring for 1 h, 10 mL of EG containing 5 mmol NH4F was added to the mixture under stirring. The mixture was then transferred into a 50 mL Teflon-lined stainless steel autoclave and heated at 200 °C for 12 h. After the autoclave was cooled to room temperature, the white powders were collected by centrifugation, washed with ethanol three times and kept in ethanol.
CDDP loading to NaGdF4:Yb3+/Er3+ nanoparticles
A NaGdF4–CDDP composite was obtained by the following procedure: 25 mg of NaGdF4:Yb3+/Er3+ nanoparticles was dispersed in 10 mL of phosphate buffered saline (PBS buffer) (pH = 6.0). After 5 min of ultrasonic pulsation, 7.5 mg of CDDP was added to the above mixture, which was then stirred in the dark for 12 h. The as-prepared NaGdF4–CDDP composite was centrifuged and washed with distilled water several times to remove the residual CDDP. All of the supernatants were collected, and the CDDP concentration in the supernatant was detected by inductively coupled plasma mass spectrometry. The drug loading content was calculated by subtraction.DOX loading to NaGdF4:Yb3+/Er3+ nanoparticles and NaGdF4–CDDP composite
A total of 2 mg of NaGdF4:Yb3+/Er3+ nanoparticles and 2 mg of NaGdF4–CDDP composite (NaGdF4:Yb3+/Er3+ equivalent) were each dispersed in 1 mL of PBS buffer (pH = 8.0). After 5 min of ultrasonic pulsation, 200 μL of DOX (2 mM) was added to each mixture, and the mixtures were shaken in the dark at the speed of 200 rpm overnight. NaGdF4–DOX and NaGdF4–CDDP–DOX were collected by centrifugation. The concentrations of DOX in the supernatants were measured using ultraviolet and visible spectrophotometry, and the DOX loading contents were assessed by subtraction.In vitro release of CDDP and DOX from NaGdF4–CDDP–DOX composite
The releases of CDDP and DOX from the NaGdF4–CDDP–DOX composite were evaluated using PBS buffer with various pH values (7.4 and 5.5). Typically, 1 mg of NaGdF4–CDDP–DOX composite was dispersed in 1 mL of PBS buffer, and the mixture containing Eppendorf tubes were shaken in the dark at 37 °C for various time periods. After 5 min centrifugation, the supernatants were collected. The amounts of released CDDP and DOX were detected using inductively coupled plasma mass spectrometry and ultraviolet and visible spectrophotometry, respectively.Cellular uptake of NaGdF4–CDDP, NaGdF4–DOX and NaGdF4–CDDP–DOX
The cellular uptake of the NaGdF4–CDDP composite was monitored by detecting the upconversion luminescence of the NaGdF4:Yb3+/Er3+ nanoparticles. Briefly, HeLa cells were planted on coverslips in a 6-well plate at a density of 2.0 × 10⁵ cells per well overnight for attachment. After being rinsed with PBS buffer, the cells were incubated in culture medium containing NaGdF4–CDDP (500 μg mL−1) for 24 h at 37 °C in 5% CO2. Then, the coverslip were washed with PBS three times to remove residual nanoparticles, and the cells were fixed using a 4% paraformaldehyde solution for 10 min. After being washed with PBS buffer, the side of the coverslip that contained cells was turned onto a glass slide containing glycerol. The upconversion luminescence imaging was performed using an optical microscope, with a CW NIR laser at λex = 980 nm as an additional excitation source. The cellular uptake process of NaGdF4–DOX and NaGdF4–CDDP–DOX was assessed using laser confocal fluorescence microscopy to detect the luminescence of DOX. A total of 1.0 × 10⁵ HeLa cells were planted in a 35 mm Petri dish at 37 °C in 5% CO2 overnight until attachment. Then the cells were washed with PBS buffer twice, and incubated with NaGdF4–DOX and NaGdF4–CDDP–DOX (125 μg mL−1) for various time periods. After the excess nanoparticles were washed off with PBS, the cells were observed using a laser confocal fluorescence microscope at the excitation wavelength of 488 nm.In vitro cytotoxicity assay
The cytotoxicity of sodium polyacrylate, polyacrylate and acrylate, CDDP, DOX, NaGdF4:Yb3+/Er3+ nanoparticles, NaGdF4–CDDP, NaGdF4–DOX and NaGdF4–CDDP–DOX was measured using the 3-(4,5-dimethylthiazol-2-yl)-2,5-diphenyltetrazolium bromide (MTT) assay against HeLa cells. HeLa cells were seeded in 96-well plates at a density of 2.0 × 10⁴ cells per well in culture medium at 37 °C in 5% CO2 overnight until attachment. Then, fresh medium containing various quantities of determinants was added to the wells, and the cells were subsequently incubated for 24 or 48 h. Next, 20 μL of MTT (5 mg mL−1) was added to the wells, and the mixtures were incubated for another 4 h. After the medium was extracted, 150 μL of DMSO was added to resolve formazan. The absorbance of formazan was monitored at 570 nm using an automatic enzyme-linked immunosorbent assay plate reader, and the cytotoxicity was expressed as the percentage of cell viability based on the data of four replicate tests.In vivo tumor inhibition
ICR mice were obtained from the Model Animal Research Centre of Nanjing University and maintained in animal facilities of Jiangsu Province Hospital of Chinese Medicine. The mice were allowed free access to rodent feed and tap water, under the Chinese Guidance of Humane Use of Laboratory Animals. The mice were sacrificed by cervical vertebra dislocation after anesthesia (pentobarbital sodium, 40 mg kg−1), and tumors were collected. The protocol was approved by the Committee on the Ethics of Animal Experiments of Jiangsu Province Hospital of Chinese Medicine (Permit number: 2017-DWLL-8). H22 tumor cells were dispersed in normal saline and inoculated subcutaneously into ICR mice at the armpit of the left forelimb at a density of 1.0 × 10⁷ cells per mouse. On the fifth day after inoculation, when the tumor volume (V = a × b2/2, where a and b are the longest and shortest diameter of the tumor, respectively) reached 80 to 100 mm3, the mice were randomly allocated into 8 groups with 5 mice in each group. As bovine serum albumin (BSA) could contribute to the dispersion of drug loaded nanoparticles and is compatible with mice, all the determinants were dispersed in a 1.5% BSA solution.30,31 Tumor bearing mice were injected via the tail vein on the 1st and 7th day with BSA solution, NaGdF4:Yb3+/Er3+ nanoparticles, CDDP (1.1 mg kg−1), DOX (0.75 mg kg−1), CDDP (1.1 mg kg−1) + DOX (0.75 mg kg−1), NaGdF4–CDDP (1.1 mg kg−1 on CDDP basis), NaGdF4–DOX (0.75 mg kg−1 on DOX basis) and NaGdF4–CDDP–DOX (1.1 mg kg−1 on CDDP basis, 0.75 mg kg−1 on DOX basis). For the tumor volume calculations, the two dimensions of the tumors were measured using Vernier caliper every other day for 13 days. After the mice were sacrificed on the 13th day, the tumors were peeled off and weighted to assess the tumor inhibition efficiency.Characterization
X-ray powder diffraction (XRD) of the as-prepared NaGdF4:Yb3+/Er3+ nanoparticles was performed on a Bruker D8 Advanced instrument with Cu Kα radiation (λ = 0.15406 nm). The morphology of the products was assessed using JEM-1011 transmission electron microscopy (TEM) with an acceleration voltage of 100 kV. Ligand on the surface of the products was analyzed using a Bruker IR vector22 infrared spectrometer. Thermogravimetric analysis (TGA) was carried out on a PerKinElmer Pyris 1 thermo-analytical instrument. X-ray photoelectron spectroscopy (XPS) was performed using Thermo Scientific K-Alpha equipment. The concentration of Pt in the supernatant was detected by inductively coupled plasma mass spectrometry (ICP-MS) using a standard Plasma-Quad II instrument. Ultraviolet and visible spectrophotometry (UV) performed on a Bruker UV-3600 was used to measure the concentration of DOX in the supernatant. Upconversion luminescent spectra were acquired on a Zolix luminescence spectrometer equipped with a 980 nm laser device. Magnetic resonance imaging (MRI) was performed using a Burker PharmaScan 7.0T small animal MRI scanner. The cellular uptake of NaGdF4–CDDP was observed using a Zeiss primo star optical microscope equipped with 980 nm CW laser, and images were taken with a Samsung pad. The uptake process of NaGdF4–DOX and NaGdF4–CDDP–DOX was observed using a Zeiss LSM 710 confocal laser fluorescence microscope at the exaction wavelength of 488 nm.Results and discussion
The crystal structures of the as-obtained NaGdF4:Yb3+/Er3+ nanoparticles were influenced by the dosage of PAAs. As shown in Fig. 1a, when the dosage of PAAs was 100 mg, the products were primarily cubic phase NaGdF4 (JCPDS no. 27-0697) with hexagonal phase NaGdF4 (JCPDS no. 27-0699) sparsely mixed in. The product was a mixture of cubic and hexagonal phase NaGdF4 (Fig. 1b) when the dosage of PAAs was 200 mg. When the dosage of PAAs was raised to 300 mg, the product was primarily hexagonal phase NaGdF4 (Fig. 1c). As reported previously,29,32 hexagonal phase NaGdF4 was more commonly achieved when the crystallization process was slow. Raising the dosage of PAAs decreased the effective concentration of Gd3+ cations, and further reduced the crystallization velocity of NaGdF4. Therefore, the proportion of hexagonal phase NaGdF4 increased when more NaOH was used.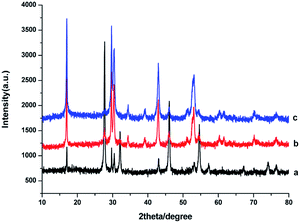 | ||
| Fig. 1 XRD patterns of products prepared in the presence of various amount of PAAs (a) 100 mg, (b) 200 mg, (c) 300 mg. | ||
The morphology of the as-prepared NaGdF4:Yb3+/Er3+ nanoparticles was observed using TEM. The NaGdF4:Yb3+/Er3+ nanoparticles were small particles with a diameter less than 20 nm when the dosage of PAAs was 100 mg (Fig. 2a). Fig. 2b shows that when the amount of PAAs was increased to 200 mg, hexagonal prisms and nanospheres with an agglomerated structure were obtained. According to the XRD patterns, these prisms and nanospheres were hexagonal phase NaGdF4:Yb3+/Er3+. When the dosage of PAAs was increased to 300 mg, the number of nanoparticles with a size of 20 nm decreased and the product were primarily nanospheres with a cluster structure (Fig. 2c).
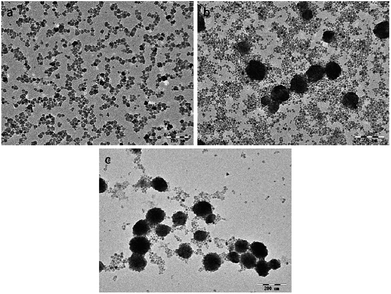 | ||
| Fig. 2 TEM images of products prepared in the presence of various amount of PAAs (a) 100 mg, (b) 200 mg, (c) 300 mg. PAAs. | ||
IR spectra were used to identify the capping ligands on the surface of these NaGdF4:Yb3+/Er3+ nanoparticles (Fig. 3). The peaks at 2953 and 2880 cm−1 correspond to the asymmetric and symmetric stretching vibrations of the C–H bond in PAAs. The peaks at 1575 and 1458 cm−1 represent the asymmetric and symmetric stretching vibrations of bound carboxyl groups respectively, suggesting the binding of carboxyl to rare earth ions on the surface of these NaGdF4:Yb3+/Er3+ nanoparticles.29,33 The strong peak at 1728 cm−1 is assigned to the C![[double bond, length as m-dash]](https://www.rsc.org/images/entities/char_e001.gif) O asymmetric vibration of the free carboxyl groups of PAAs which improve the hydrophilicity of the as-obtained NaGdF4:Yb3+/Er3+ nanoparticles.29,34
O asymmetric vibration of the free carboxyl groups of PAAs which improve the hydrophilicity of the as-obtained NaGdF4:Yb3+/Er3+ nanoparticles.29,34
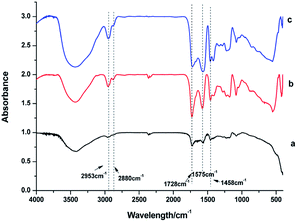 | ||
| Fig. 3 IR spectra of products prepared in the presence of various amount of PAAs (a) 100 mg, (b) 200 mg, (c) 300 mg. | ||
Thermogravimetric analysis was used to assess the amount of capped ligands on the surface of the as-prepared NaGdF4:Yb3+/Er3+ nanoparticles. Fig. 4 shows that all of the products lost weight at the temperature of 371.1 °C, indicating that the capped PAAs were oxidized. The degree of weight loss increased with increasing PAAs. However, the size of the particles was smaller and the specific surface area of the particles was larger when the dosage of PAAs was 200 mg, accordingly the particles could bind more PAAs. Thus, the weight loss of products obtained under the condition of 200 mg PAAs (Fig. 4b) was higher than that of nanoparticles obtained under the condition of 300 mg of PAAs (Fig. 4c).
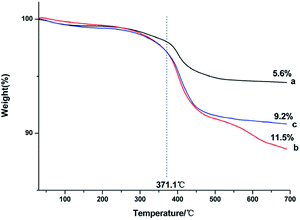 | ||
| Fig. 4 TGA curves of products prepared in the presence of various amount of PAAs (a) 100 mg, (b) 200 mg, (c) 300 mg. | ||
Upconversion luminescence spectra were measured at room temperature (Fig. 5). When excited using a 980 nm CW laser, theses as-prepared NaGdF4:Yb3+/Er3+ nanoparticles emitted green lights. Emission peaks at ∼520, ∼538 and ∼652 nm correspond to the 2H11/2 → 4I15/2, 4S3/2 → 4I15/2 and 4F9/2 → 4I15/2 transition in Er3+, respectively.35 At the same concentration, the luminescence intensity of products prepared with differing amount of PAAs was variable. It has been reported that rare-earth doped hexagonal phase NaGdF4 exhibits a preferable luminescence property.36,37 In this study, the luminescence intensity decreased as the content of hexagonal phase NaGdF4:Yb3+/Er3+ nanoparticles increased, primarily because the agglomerated structure of these hexagonal phase NaGdF4:Yb3+/Er3+ nanoparticles could lead to larger surface defect, which results in luminescence quenching.38
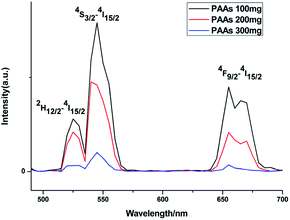 | ||
| Fig. 5 Upconversion luminescence spectra of products prepared in the presence of various amount of PAAs. | ||
More amount of free carboxyl groups on the surface of the particles enable nanoparticles to bind more molecules, such as anticancer drugs, and stronger luminescence intensity enhances the cell imaging of drug-loaded nanoparticles. Thus, NaGdF4:Yb3+/Er3+ nanoparticles synthesized with 200 mg PAAs were chosen to establish the drug delivery system.
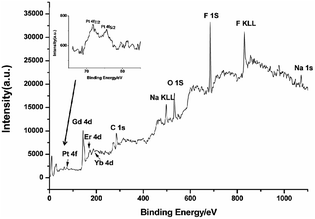
XPS was used to study the loading process of CDDP in NaGdF4:Yb3+/Er3+ nanoparticles. As shown in Fig. 6, the binding energy of Gd 4d, Er 4d, Yb 4d, F 1s and Na 1s in NaGdF4:Yb3+/Er3+ was located at 142.9, 172.8, 187.4, 685.1, and 1072.2 eV respectively. The photoelectron peaks at 284.9 and 532.3 eV correspond to the C 1s and O 1s respectively. The peak at 74 eV is assigned to Pt 4f, indicating the binding of CDDP. The close-up view of the Pt 4f region (inset of Fig. 6) exhibited two peaks at 71.8 and 75.6 eV, which are peaks of Pt 4f7/2 and Pt 4f5/2, viz., the binding energy of Pt II in Pt–O–C(O)–NaGdF4:Yb3+/Er3+ nanoparticles.39,40 Therefore, CDDP loaded to NaGdF4:Yb3+/Er3+ nanoparticles through a Pt–O bond. The content of residual CDDP in the supernatant was detected using ICP-MS, and the loading capacity was calculated using the subtraction method. The mass percentage of CDDP in NaGdF4–CDDP composite was determined to be ca. 12.9%.
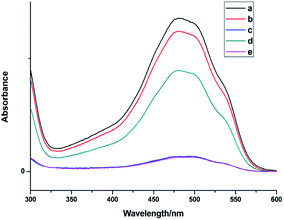
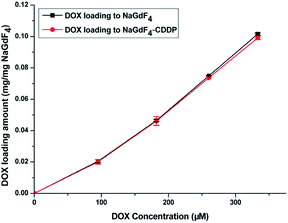
Fig. 7 shows the UV spectra of DOX in the supernatant before and after DOX loading onto NaGdF4:Yb3+/Er3+ nanoparticles and NaGdF4–CDDP respectively. In ddH2O (Fig. 7b and d), when keeping the amount the same (NaGdF4:Yb3+/Er3+ equivalent), the NaGdF4:Yb3+/Er3+ nanoparticles loaded more DOX compared with the NaGdF4–CDDP composite. However, the loading capacity was almost equal in PBS buffer (pH = 8.0). Moreover, the loading amounts of both nanoparticles in PBS buffer (pH = 8.0) were much larger than those in ddH2O. Fig. 8 shows the loading amounts of NaGdF4:Yb3+/Er3+ nanoparticles and the NaGdF4–CDDP composite with various concentrations of DOX in PBS buffer (pH = 8.0), illustrating that the loading capacity of DOX is almost equal, and therefore, the loading of CDDP has no influence on the carrying of DOX.
In ddH2O, –NH2 in DOX·HCl was protonated, and could bind –COO− in PAAs via electrostatic interactions.41 However, due to the weak electrolyte property of PAAs, –COO− would hydrolyze into –COOH, which could weaken the electrostatic interaction between –NH3+ and –COO−. In addition, because CDDP was bound in the form of Pt–O bond, occupying –COO− in PAAs would also decrease the loading amount of DOX. In PBS buffer (pH = 8.0), –NH3+ in DOX·HCl lost H+ and bound to –COO− in PAAs through hydrogen-bond interaction. Moreover, the ionization of –COO− contributed to the swelling of PAAs, which exposed more –COO−,42 resulting in an increased DOX loading amount. The subtraction method was used to calculate the DOX loading capacity and the mass percentages of DOX in the NaGdF4–DOX composite and the NaGdF4–CDDP–DOX composite were 8.9% and 7.8%, respectively. ICP-MS was introduced to detect CDDP in the supernatant after the NaGdF4–CDDP was loaded with DOX, and only 1.5% of the loaded CDDP could be detected, indicating that the loading of DOX scarcely influenced the loading amount of CDDP.
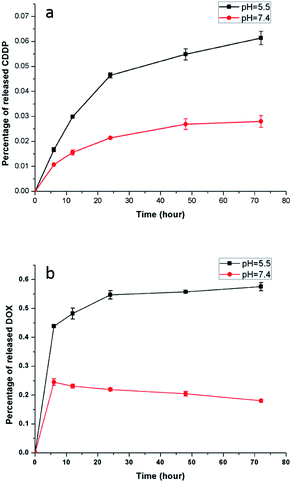
An acidic environment resembles the microenvironment of tumor cells,43 and the pH value of the physiological environment is approximately 7.3 to 7.4. Accordingly, PBS buffer with a pH value of 5.5 and 7.4 was used to simulate the environment of tumor cells and normal physiology, respectively. Fig. 9 shows the CDDP and DOX release from the NaGdF4–CDDP–DOX composite (mass concentration of DOX is 7.8%) in PBS buffer with pH = 5.5 and pH = 7.4. Similar to a previous study,44 the release of CDDP from the NaGdF4–CDDP–DOX composite in PBS buffer with a pH of 5.5 was much faster compared with PBS buffer with a pH of 7.4, indicating that the acidic environment enhanced the release of CDDP. Similarly, for DOX, the release rate was higher in PBS with a pH of 5.5 than in PBS with a pH of 7.4. In the case of pH 5.5, H+ in PBS buffer could disrupt hydrogen-bond interactions between –NH2 in DOX and –COO− in PAAs, inducing the quick release of DOX. The hydrogen-bond interaction was partly weakened when the pH value of PBS buffer was 7.4, so a small amount of DOX could release at first. However, decreasing the pH value would enhance the protonation of –NH2, which could strengthen the static electricity with –COO−, inducing further binding of DOX as the time extended. In short, an acidic environment enhances the release of anti-cancer drugs, making the NaGdF4–CDDP–DOX composite suitable for drug delivery.
HeLa cells were used to monitor the cellular uptake process of the NaGdF4–CDDP composite by detecting the upconversion luminescence of NaGdF4:Yb3+/Er3+. HeLa cells incubated with the composite were examined with a microscope equipped with a 980 nm CW laser. After incubation with the NaGdF4–CDDP composite for 24 h, compared with the bright field image (Fig. 10a), cells in the upconversion luminescence image (Fig. 10b) exhibited green luminescence, revealing that the NaGdF4–CDDP composite could be internalized by HeLa cells.
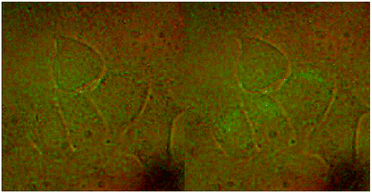 | ||
| Fig. 10 Upconversion luminescence images of HeLa cells stained with NaGdF4–CDDP composite at 37 °C. Bright field image in the left and upconversion luminescence image on the right. | ||
Upon excitation at 488 nm, DOX emitted intense red luminescence. Accordingly, the cellular uptake processes of DOX loaded NaGdF4:Yb3+/Er3+ nanoparticles and the NaGdF4–CDDP composite could be monitored via observing the luminescence of DOX.45 Fig. 11 and 12 show the laser confocal fluorescence microscope images of HeLa cells incubated with NaGdF4–DOX and the NaGdF4–CDDP–DOX composite for various durations. The confocal laser scanning microscope (CLSM) images on the left shows that after incubation for 1 h, red light could be observed in HeLa cells, indicating the uptake of NaGdF4–DOX and the NaGdF4–CDDP–DOX composite. When the incubation time was prolonged to 2 h, the luminescence intensity enhanced, which indicating that more of the drug loaded nanoparticles entered the cells. Merged images combining the laser confocal fluorescence microscope images and bright field images revealed that red light was primarily observed in the cytoplasm. When the incubation time was increased to 6 h, intense red light could be detected both the cytoplasm and the cell nucleus, revealing that DOX released from drug loaded nanoparticles and entered cell nucleus. Therefore, NaGdF4–DOX and the NaGdF4–CDDP–DOX composite could be internalized into cells in a time-dependent manner.
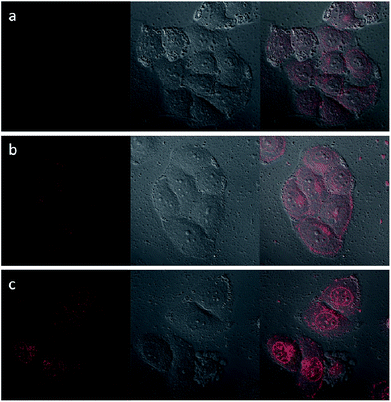 | ||
| Fig. 11 CLFM images of HeLa cells stained with NaGdF4–DOX for (a) 1 h, (b) 2 h, (c) 6 h on the left, bright field images in the middle, and merged images on the right. | ||
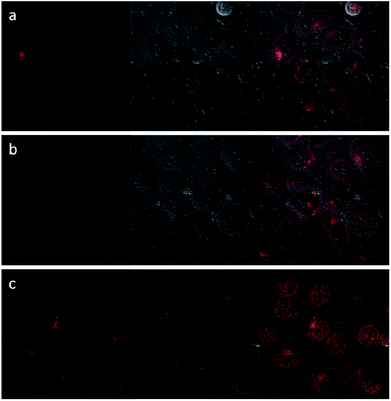 | ||
| Fig. 12 CLFM images of HeLa cells stained with NaGdF4–CDDP–DOX for (a) 1 h, (b) 2 h, (c) 6 h on the left, bright field images in the middle, and merged images on the right. | ||
MTT assays were used to estimate the cytotoxicity of CDDP, DOX and a combination of CDDP and DOX. As shown in Fig. 13a, the half-maximal inhibitory concentration (IC50) of CDDP against HeLa cells was 7.30 μM and 2.46 μM after 24 h and 48 h of incubation respectively, and the IC50 value of DOX against HeLa cells was 0.42 μM and 0.09 μM (Fig. 13b) when the incubation time was 24 h and 48 h respectively. When the mass percentage of DOX in the NaGdF4–CDDP–DOX composite was 7.8%, the molar ratio of loaded CDDP and DOX was 2.86![[thin space (1/6-em)]](https://www.rsc.org/images/entities/char_2009.gif) :
:![[thin space (1/6-em)]](https://www.rsc.org/images/entities/char_2009.gif) 1. This was the ratio chosen to assess the antitumor capacity of a combination of CDDP and DOX. When CDDP and DOX were used simultaneously, the IC50 values were 0.27 μM and 0.05 μM (DOX equivalent, Fig. 13c), which were less than the IC50 value for each component alone, indicating that CDDP also had an inhibiting effect.
1. This was the ratio chosen to assess the antitumor capacity of a combination of CDDP and DOX. When CDDP and DOX were used simultaneously, the IC50 values were 0.27 μM and 0.05 μM (DOX equivalent, Fig. 13c), which were less than the IC50 value for each component alone, indicating that CDDP also had an inhibiting effect.
 | (1) |
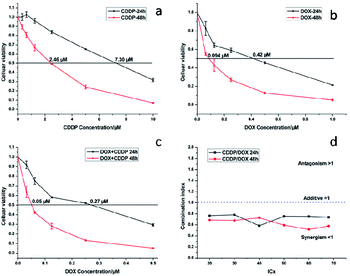 | ||
| Fig. 13 Cytotoxicity of CDDP (a), DOX (b) and CDDP/DOX combination (c) against HeLa cancer cell lines at 24 and 48 h, combination index (CI) curves (d) of CDDP/DOX combinations. | ||
The Combination Index (CI) and equivalent diagram analysis method were used to study the mechanism of action when these two drugs were used simultaneously.46 The CI can be calculated using formula (1), in which D1 and D2 are the dosages of drug 1 and drug 2 in combination when producing some specified effect (such as half-maximal inhibitory), and Dm1 and Dm2 are the dosages that have the same antitumor effect of the drugs when they are used alone. CI values higher than, equal to and lower than 1 reveal antagonism, additivity and synergism, respectively. As shown in Fig. 13d, the CI values under different ICX conditions are lower than 1, indicating the synergism of CDDP and DOX when they are combined. Therefore, combining CDDP and DOX effectively enhances their antitumor capacity.
NaGdF4:Yb3+/Er3+ nanoparticles exhibited high biocompatibility.47,48 As shown in Fig. S1,† sodium polyacrylate, polyacrylate and acrylate are almost no toxic towards Hela cells. More than 75% of the cells survived even after incubation with a high concentration of NaGdF4:Yb3+/Er3+ nanoparticles (2000 μg mL−1) for 48 h (Fig. 14), suggesting the feasibility of these nanoparticles for drug delivery. NaGdF4–CDDP and NaGdF4–DOX exhibited obvious cytotoxicity when compared with NaGdF4:Yb3+/Er3+ nanoparticles, revealing the establishment of a drug delivery system. The IC50 value of NaGdF4–CDDP against HeLa cells was 131 μM and 27 μM after 24 h and 48 h of incubation, respectively (Fig. 15a), and that of the NaGdF4–DOX composite against HeLa cells was 1.18 μM and 0.31 μM after 24 h and 48 h of incubation, respectively (Fig. 15b). The IC50 values of the as- obtained composites were larger than those of CDDP and DOX alone, likely because the composites required time to enter the cells, and they released drugs slowly due to the favorable releasing profile in the acidic environment of cancer cells. In addition, the cytotoxicity of NaGdF4–CDDP was much less than that of CDDP, primarily because CDDP released very slowly due to the strength of the Pt–O bond. Because the cytotoxicity of NaGdF4–DOX was more pronounced than that of NaGdF4–CDDP, the NaGdF4–CDDP–DOX composite carrying less DOX (50 μL of DOX·HCl solution was used in preparation of NaGdF4–CDDP–DOX, and the mass percentage of DOX in NaGdF4–CDDP–DOX composite was approximately 1.7%) was chosen to study the antitumor capacity of the two-drug-loaded composite against HeLa cells. As shown in Fig. 15c, the IC50 value of the NaGdF4–CDDP–DOX composite was 0.96 μM and 0.27 μM (DOX equivalent) after 24 h and 48 h of incubation, respectively, which were less than that of the nanoparticles loading DOX only. Compared with NaGdF4–CDDP and NaGdF4–DOX, the NaGdF4–CDDP–DOX composite exhibited a stronger anticancer effect, indicating the successful construction of a two-drug-loaded delivery system.
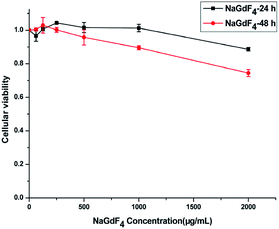 | ||
| Fig. 14 Cytotoxicity of NaGdF4:Yb3+/Er3+ nanoparticles against HeLa cancer cell lines at 24 and 48 h. | ||
 | ||
| Fig. 15 Cytotoxicity of NaGdF4–CDDP (a), cytotoxicity of NaGdF4–DOX and NaGdF4–CDDP–DOX at 24 (b) and 48 h (c), respectively. | ||
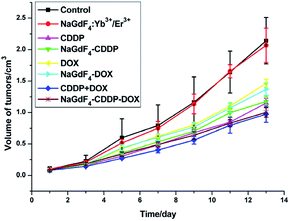
NaGdF4:Yb3+/Er3+ nanoparticles could be used as carriers for drug delivery in vivo because they are highly biocompatible. All of the drugs were injected via the tail vein on the first and seventh day, and the tumor volumes from different groups varied as time went on, as shown in Fig. 16. The CDDP, DOX and CDDP + DOX groups showed superb antitumor capacities, and the combination of CDDP and DOX exhibited the best antitumor effect. Similar to unloaded drugs, the group that received NaGdF4–CDDP–DOX presented a better inhibitory effect when compared with NaGdF4–CDDP and NaGdF4–DOX.
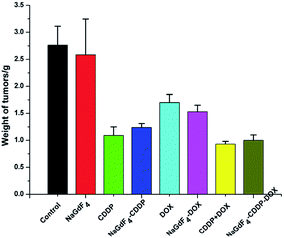
The tumor weights directly reflected the inhibitory effect of the various treatments. After the tumors were peeled off and weighed on the last day (Fig. 17), consistent with the tumor volumes, CDDP + DOX and NaGdF4–CDDP–DOX showed the strongest antitumor effect. In addition, drug-loaded nanoparticles showed a similar inhibitory capacity similar to the corresponding drugs, revealing the effectiveness of drug delivery systems.
| 1/T = 1/T° + r × [Gd] | (2) |
The magnetic resonance relaxivity of the NaGdF4:Yb3+/Er3+ nanoparticles (obtained with 200 mg PAAs) was measured on a 7.0 T small animal MRI scanner. The relaxivity value of r can be calculated using formula (2), in which T and [Gd] are relaxation time and concentration of Gd, respectively. Fig. 18 shows the relaxivity curves of the NaGdF4:Yb3+/Er3+ nanoparticles, and the relaxivity values of r1 and r2 were 0.95 mM−1 S−1 and 113.04 mM−1 S−1, respectively. The ratio of the transversal (r2) to longitudinal (r1) magnetic resonance relaxivity was 119, which ranked these NaGdF4:Yb3+/Er3+ nanoparticles among the high-performance T2 contrast agents.25,49
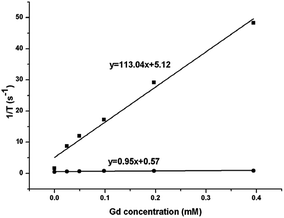 | ||
| Fig. 18 The r1 (●) and r2 (■) relaxivity curves of NaGdF4:Yb3+/Er3+ nanoparticles at room temperature. | ||
Fig. 19 shows the T2 weighted MR images of as-prepared NaGdF4:Yb3+/Er3+ nanoparticles at various concentrations, and the brightness of the image decreased as the concentration of Gd3+ increased, indicating that the as-prepared nanoparticles were suitable T2 contrast agents.
 | ||
| Fig. 19 T2-weighted MRI contrast images of NaGdF4:Yb3+/Er3+ nanoparticles with various Gd-concentrations from zero to 0.394 mM collected using a 7.0 T animal MRI scanner. | ||
Conclusion
NaGdF4:Yb3+/Er3+ nanoparticles coated with carboxyl groups were prepared using a one-step solvothermal method, and the structure, morphology and luminescence influenced by the dosage of PAAs was also studied. CDDP and DOX could be loaded onto NaGdF4:Yb3+/Er3+ nanoparticles through Pt–O bonding and hydrogen bonding, respectively. DOX could also be loaded onto NaGdF4–CDDP via hydrogen bonding, and the loading capacity of CDDP and DOX was not influenced by each other. Anticancer assays in vitro and in vivo indicated that CDDP and DOX loaded nanoparticles exhibited a higher antitumor capacity when compared with single-drug-loaded nanoparticles. In addition, the paramagnetism of Gd3+ made the NaGdF4:Yb3+/Er3+ nanoparticles suitable as T2 weighted MRI agents.Conflicts of interest
There are no conflicts to declare.Acknowledgements
This work is supported by the National Natural Science Foundation of China (21527809, 21475059 and 21775069).Notes and references
- D. Böhme and A. G. Beck-Sikinger, J. Pept. Sci., 2015, 21, 186–200 CrossRef PubMed.
- K. Strebhardt and A. Ullrich, Nat. Rev. Cancer, 2008, 8, 473–480 CrossRef PubMed.
- D. Peer, J. M. Karp, S. Hong, O. C. Farokhzad, R. Margalit and R. Langer, Nat. Nanotechnol., 2007, 2, 751–760 CrossRef PubMed.
- X. Zhen, X. Wang, C. Xie, W. Wu and X. Q. Jiang, Biomaterials, 2013, 34, 1372–1382 CrossRef PubMed.
- H. Maeda, Adv. Enzyme Regul., 2001, 41, 189–207 CrossRef PubMed.
- Y. R. Xiong, W. W. Jiang, Y. Shen, H. Y. Li, C. M. Sun, A. Ouahab and J. S. Tu, Biomaterials, 2012, 33, 7182–7293 CrossRef PubMed.
- V. Shanmugam, Y. H. Chien, Y. S. Cheng, T. Y. Liu, C. C. Huang, C. H. Su, Y. S. Chen, U. Kumar, H. F. Hsu and C. S. Yeh, ACS Appl. Mater. Interfaces, 2014, 6, 4382–4393 CrossRef PubMed.
- J. L. Gu, S. S. Su, Y. S. Li, Q. J. He, J. Y. Zhong and J. L. Shi, J. Phys. Chem. Lett., 2010, 1, 3446–3450 CrossRef.
- C. Y. Lai, B. G. Trewyn, D. M. Jeftinija, K. Jeftinija, S. Xu, S. Jeftinija and V. S. Y. Lin, J. Am. Chem. Soc., 2003, 125, 4451–4459 CrossRef PubMed.
- R. Haag and F. Kratz, Angew. Chem., Int. Ed., 2006, 45, 1198–1215 CrossRef PubMed.
- M. Raoof, B. T. Cisneros, A. Guven, S. Phounsavath, S. J. Corr, L. J. Wilson and S. A. Curley, Biomaterials, 2013, 34, 1862–1869 CrossRef PubMed.
- J. Z. Wang, X. Y. Wang, Y. J. Song, C. C. Zhu, J. Wang, K. Wang and Z. J. Guo, Chem. Commun., 2013, 49, 2786–2788 RSC.
- D. F. Liu, W. Wu, X. Chen, S. Wen, X. Z. Zhang, Q. Ding, G. J. Teng and N. Gu, Nanoscale, 2012, 4, 2306–2310 RSC.
- Y. Wu, D. M. Yang, X. J. Kang, P. A. Ma, S. S. Huang, Y. Zhang, C. X. Li and J. Lin, Dalton Trans., 2013, 42, 9852–9861 RSC.
- R. C. Lv, S. L. Gai, Y. L. Dai, N. Niu, F. He and P. P. Yang, ACS Appl. Mater. Interfaces, 2013, 5, 10806–10818 CrossRef PubMed.
- D. M. Yang, P. A. Ma, Z. Y. Hou, Z. Y. Cheng, C. X. Li and J. Lin, Chem. Soc. Rev., 2015, 44, 1416–1448 RSC.
- G. Chen, T. Y. Ohulchanskyy, S. Liu, W. C. Law, F. Wu, M. T. Swihart, H. Ågren and P. N. Prasad, ACS Nano, 2012, 6, 2969–2977 CrossRef PubMed.
- M. Haase and H. Schäfer, Angew. Chem., Int. Ed., 2011, 50, 5808 CrossRef PubMed.
- H. H. Gorris, R. Ali, S. M. Saleh and O. S. Wolfbeis, Adv. Mater., 2011, 23, 1652 CrossRef PubMed.
- G. Y. Chen, H. L. Qiu, P. N. Prasad and X. Y. Chen, Chem. Rev., 2014, 114, 5161–5214 CrossRef PubMed.
- Q. Zhao, B. Q. Shao, W. Lu, W. Z. Lv, M. M. Jiao, L. F. Zhao and H. P. You, Dalton Trans., 2015, 44, 3745–3752 RSC.
- F. He, N. Niu, L. Wang, J. Xu, Y. Wang, G. X. Yang, S. L. Gai and P. P. Yang, Dalton Trans., 2013, 42, 10019–10028 RSC.
- F. Evanics, P. R. Diamente, F. C. J. M. van Veggel, G. J. Stanisz and R. S. Prosser, Chem. Mater., 2006, 18, 2499–2505 CrossRef.
- J. Zhou, Y. Sun, X. X. Du, L. Q. Xiong, H. Hu and F. Y. Li, Biomaterials, 2010, 31, 3287–3295 CrossRef PubMed.
- J. N. Liu, W. B. Bu, L. M. Pan, S. J. Zhang, F. Chen, L. P. Zhou, K. L. Zhao, W. J. Peng and J. L. Shi, Biomaterials, 2012, 33, 7282–7290 CrossRef PubMed.
- Y. Park, H. M. Kim, J. H. Kim, K. C. Moon, B. Yoo, K. T. Lee, N. Lee, Y. Choi, W. Park, D. Ling, K. Na, W. K. Moon, S. H. Choi, H. S. Park, S. Y. Yoon, Y. D. Suh, S. H. Lee and T. Hyeon, Adv. Mater., 2012, 24, 5755–5761 CrossRef PubMed.
- X. Wang, K. Liu, G. B. Yang, L. Cheng, L. He, Y. M. Liu, Y. G. Li, L. Guo and Z. Liu, Nanoscale, 2014, 6, 9198–9205 RSC.
- G. Tian, W. Y. Yin, J. J. Jin, X. Zhang, G. M. Xing, S. J. Li, Z. J. Gu and Y. L. Zhao, J. Mater. Chem. B, 2014, 2, 1379–1389 RSC.
- Z. Wang, C. H. Liu, L. J. Chang and Z. P. Li, J. Mater. Chem., 2012, 22, 12186–12192 RSC.
- D. Elgrabli, S. Abella-Gallart, O. Aguerre-Chariol, F. Robidel, F. Rogerieux, J. Boczkowski and G. Lacroix, Nanotoxicology, 2012, 1, 266–278 CrossRef.
- X. Wang, T. Xia, M. C. Duch, Z. X. Ji, H. Y. Zhang, R. B. Li, B. B. Sun, S. J. Lin, H. Meng, Y. P. Liao, M. Y. Wang, T. B. Song, Y. Yang, M. C. Hersam and A. E. Nel, Nano Lett., 2012, 12, 3050–3061 CrossRef PubMed.
- Y. Wei, F. Q. Lu, X. R. Zhang and D. P. Chen, Chem. Mater., 2006, 18, 5733–5737 CrossRef.
- L. Y. Wang, Y. Zhang and Y. Y. Zhu, Nano Res., 2010, 3, 317–325 CrossRef.
- X. J. Wu, Q. B. Zhang, X. Wang, H. Yang and Y. M. Zhu, Eur. J. Inorg. Chem., 2011, 2158–2163 CrossRef.
- G. S. Yi and G. M. Chow, Adv. Funct. Mater., 2006, 16, 2324–2329 CrossRef.
- G. S. Yi and G. M. Chow, Chem. Mater., 2007, 19, 341–343 CrossRef.
- F. Wang, Y. Han, C. S. Lim, Y. H. Lu, J. Wang, J. Xu, H. Y. Chen, C. Zhang, M. H. Hong and X. G. Liu, Nature, 2010, 463, 1061–1065 CrossRef PubMed.
- H. X. Mai, Y. W. Zhang, L. D. Sun and C. H. Yan, J. Phys. Chem. C, 2007, 111, 13721–13729 CrossRef.
- R. M. Xing, X. Y. Wang, C. L. Zhang, J. Z. Wang, Y. M. Zhang, Y. Song and Z. J. Guo, J. Mater. Chem., 2011, 21, 11142–11149 RSC.
- T. C. Deivaraj, W. X. Chen and J. Y. Lee, J. Mater. Chem., 2003, 13, 2555–2560 RSC.
- M. Q. Li, Z. H. Tang, S. X. Lv, W. T. Song, H. Hong, X. B. Jing, Y. Y. Zhang and X. S. Chen, Biomaterials, 2014, 35, 3851–3864 CrossRef PubMed.
- S. C. Chen, Y. C. Wu, F. L. Mi, Y. H. Lin, L. C. Yu and H. W. Sung, J. Controlled Release, 2004, 96, 285–300 CrossRef PubMed.
- I. F. Tannock and D. Rotin, Cancer Res., 1989, 49, 4373–4384 Search PubMed.
- J. Z. Wang, X. Y. Wang, Y. J. Song, J. Wang, C. L. Zhang, C. J. Chang, J. Yan, L. Qiu, M. M. Wu and Z. J. Guo, Chem. Sci., 2013, 4, 2605–2612 RSC.
- Y. L. Dai, P. A. Ma, Z. Y. Cheng, X. J. Kang, X. Zhang, Z. Y. Hou, C. X. Li, D. M. Yang, X. F. Zhai and J. Lin, ACS Nano, 2012, 6, 3327–3338 CrossRef PubMed.
- L. Zhao, M. G. Wientjes and J. L. S. An, Clin. Cancer Res., 2004, 10, 7994–8004 CrossRef PubMed.
- H. Y. Xing, S. J. Zhang, W. B. Bu, X. P. Zheng, L. J. Wang, Q. F. Xiao, D. L. Ni, J. M. Zhang, L. P. Zhou, W. J. Peng, K. L. Zhao, Y. Q. Hua and J. L. Shi, Adv. Mater., 2014, 26, 3867–3872 CrossRef PubMed.
- C. X. Li, D. M. Yang, P. A. Ma, Y. Y. Chen, Y. Wu, Z. Y. Hou, Y. L. Dai, J. H. Zhao, C. P. Sui and J. Lin, Small, 2013, 9, 4150–4159 CrossRef PubMed.
- M. S. Martina, J. P. Fortin, C. Ménager, O. Clément, G. Barratt, C. Grabielle-Madelmont, F. Gazeau, V. Cabuil and S. Lesieur, J. Am. Chem. Soc., 2005, 127, 10676–10685 CrossRef PubMed.
Footnote |
| † Electronic supplementary information (ESI) available. See DOI: 10.1039/c8ra03898h |
| This journal is © The Royal Society of Chemistry 2018 |

