 Open Access Article
An approach toward miRNA detection via different thermo-responsive aggregation/disaggregation of CdTe quantum dots†
Yasaman Sadat Borghei and
Morteza Hosseini *
*
Department of Life Science Engineering, Faculty of New Sciences & Technologies, University of Tehran, Tehran, Iran. E-mail: smhosseini@khayam.ut.ac.ir
First published on 24th August 2018
Abstract
MicroRNA-155 regulates the expression of 147 target genes that are involved in cancer pathways, and its expression level has been shown to be up-regulated in breast cancer. Thus, it is necessary to investigate the value of microRNA-155 for early diagnosis and prognosis of breast cancer. Here we present a novel and “light shift” spectral method for the detection of miRNA based on different thermo-responsive aggregation/disaggregation of CdTe quantum dots (CdTe QDs) by using single stranded DNA or a DNA/RNA heteroduplex as a template after heat treatment. In this method upon addition of the DNA/RNA heteroduplex, the CdTe QDs aggregate strongly due to their strong interaction with the double stranded nucleic acid, which results in fluorescence quenching. By applying the melting temperature (Tm), the DNA/RNA heteroduplex denatures and two strands are dissociated, which disaggregates the QDs, effectively switching to fluorescence emission of QDs. These processes were investigated with Atomic Force Microscopy (AFM) and fluorescence spectroscopy. The proposed method has been used also for the determination of miR-155 in total RNAs extracted from the human breast carcinoma SK-BR-3 cells and normal human embryonic kidney cell line (HEK 293).
1. Introduction
MicroRNAs (miRNAs or miRs) are small single stranded non-coding RNA that regulate the expression of multiple genes.1 The difference in the expression level of miRNAs causes the onset of diseases, including several cancers, such as breast cancer (BC).2 In general, miRNAs are often classified into two categories: oncogenic miRNAs (“oncomir”) (act by expression of tumor suppressor genes) and the tumor suppressor miRNAs (act by silencing oncogenes).3 MiR-155 is an oncogenic miRNA or a tumor suppressor.4 Recently, several studies showed that up-regulation of miR-155 occurred in BC and which make it an appropriate biomarker for BC diagnosis.3,5 Conventional techniques for detecting miRNAs are northern blotting, reverse-transcription polymerase chain reaction (RT-PCR), and miRNA arrays. However, all of these methods display some limitations and do not meet the current demands. So, there is an urgent need to develop efficient and low-cost miRNA detection methods. To that end, the rapid development of nanotechnology has resulted in new tools for DNA and miRNA detection, including nanoparticle-derived probes, isothermal amplification, electrochemical methods, and DNAzyme based reporters.6–15Recently, the unique photophysical and electronic properties of semiconductor nanoparticles or quantum dots (QDs) have attracted extensive application studies in many fields, especially in biosensing and biomedicine imaging.16 Similar to other nanoparticle colloids such as gold nanoparticle, the disturbance in the surface charge of QDs exerts a great influence on the stability of its corresponding suspension, and meanwhile, fluorescence change and a bathochromatic shift (also commonly called a red shift) of the fluorescence emission peak happens due to the particle aggregation caused by this impaired stability in surface charge.17 There are several advantages in using QDs such as narrow excitation bands, small effective Stokes shifts, broad emission bands, and susceptibility to photobleaching.18 The fluorescence transduction of QDs to the direct interactions occurring at the surface is very sensitive in such a way that these interactions have significant importance in the efficiency of the radiative recombination, either leading fluorescence activation or quenching. These changes allow us to specifically identify a particular analyte in a complex mixture.19 Previously, researchers described hydrogen-bonding interactions between oligonucleotides and quantum dots capped with mercaptoacetic acid ligands.20 Other results showed that the chalcogenide QDs interact electrostatically through their own metallic center of the with the oxygen or nitrogen site of DNA bases. On the other hand, The chalcogenide QDs interact strongly with negatively-charged phosphate groups on the DNA backbones due to their positive charge of metal ions.21–27
We used aggregation assay of CdTe QDs using heteroduplex as a new fluorescent nanosensor to achieve the objectives of the miRNA analysis. We showed that both the quenching and a bathochromatic shift mechanisms could be occurred before and after denaturation of heteroduplex, respectively, through aggregation/disaggregation between QDs and DNA/miRNA heteroduplex. Here, this nucleic acid heteroduplex aggregates thioglycolic acid (TGA)-stabilized CdTe QDs; and as a result, fluorescence quenching occurs.28–32 Applying melting temperature (Tm: is defined as the temperature at which half of the double strand begins to dissociate), resulted in a larger Stoke's shift emission change upon the de-aggregation,32–36 which depends on the concentration of miRNA. This is due to the shorter distances between the CdTe QDs in the heteroduplex than that of the single strand and free CdTe QDs, which can increase the dipole–dipole interaction between the CdTe QDs, resulting in a larger Stoke's shift emission change (Schemes 1–3). The proposed method can be used as a highly selective nanosensor for duplex/heteroduplex nucleic acid detection. The present assay was successfully applied for the determination of miRNA-155 in human breast cancer cells (SK-BR-3). The implemented miRNA can also be replaced with other miRNAs.
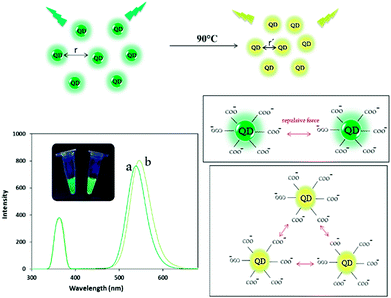 | ||
| Scheme 1 Schematic representation of the fluorescent behavior of bare QDs before (a) and after (b) heating and their spectra and photographs of them before and after heat treatment. | ||
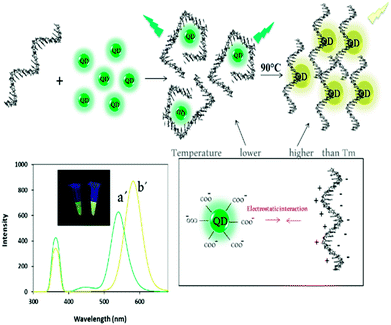 | ||
| Scheme 2 Schematic representation of the fluorescent behaviour of ssDNA–QDs complex before (a′) and after (b′) heating and their spectra and photographs of them before and after heat treatment. | ||
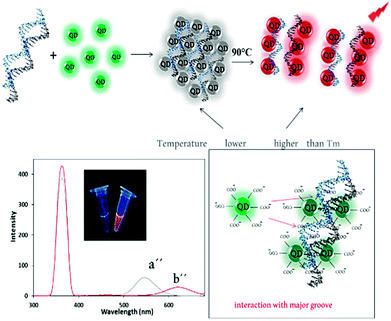 | ||
| Scheme 3 Schematic representation of the fluorescent behavior of dsDNA/miR-155–QDs complex before (a′′) and after (b′′) heating and their spectra. Photographs of them before and after heat treatment. | ||
2. Experimental
2.1 Apparatus
All fluorescence measurements were monitored using a Perkin Elmer LS-55 fluorescence spectrometer with a xenon lamp as source of excitation while the spectral band widths of monochromators for excitation and emission were 10 nm. (Buckinghamshire, UK). The size and morphology of CdTe QDs were measured by Atomic Force Microscopy (AFM) (NT-MDT, Zelenograd, Russia). UV-vis spectroscopy was performed by a Specord 250 spectrophotometer (Analytik Jena, Germany).2.2 Materials and reagents
Fetal bovine serum (FBS), Dulbecco's modified Eagle medium (DMEM), and penicillin/streptomycin were purchased from Gibco (USA). Oligonucleotides were synthesized and purified by Pishgam Biotech Co (Tehran, Iran), and their sequences were listed in Table S1.† All DNA samples were purified by PAGE and prepared with TE buffer (1 M Tris–HCl, 0.5 M EDTA). Cd(NO3)2, tellurium powder, thioglycolic acid (TGA) and sodium borohydride (NaBH4) were purchased from Merck and cell culture lysis reagent (CCLR), 5X was purchased from Sigma Aldrich. All other commercially available substances were purchased from Aldrich, Merck and Acros and used without further purification. All other reagents were of analytical reagent grade and ultrapure water (Milli-Q plus, Millipore Inc., Bedford, MA) was used in the reactions.SK-BR-3 cells (human breast cancer cell line) and HEK 293 cells (from normal human embryonic kidney cell line) were used in this study. SK-BR-3 and HEK 293 cells were received from Pasteur Institute, National cell bank of Iran.
2.3 Preparation of samples for atomic force microscopy (AFM) imaging
AFM imaging was performed on DNA probes and DNA/miR-155 heteroduplex samples were deposited on freshly cleaved mica sheets. For this, 1 × 1 cm mica slides were soaked in 5 mM MgCl2. 2 min after, the surface was rinsed with ultra-pure distilled water and dried at room temperature. Then, 50 μl of samples in 1 mM MgCl2 were spotted onto mica plates and dried at room temperature. After washing the samples with deionized water and drying, AFM imaging was done on a Solver PRO AFM system (NT-MDT, Russia), in a semi-contact (tapping) mode, using Si-gold-coated cantilevers (NT-MDT, Zelenograd, Russia) with a resonance frequency of 375 kHz. Images were recorded in height mode, and Nova image processing software (NT-MDT, Zelenograd, Russia) was used for data processing and particle analysis.2.4 Preparation of TGA capped-CdTe quantum dots
The experimental procedure was based on previously reported works.27,37,38 In summary, Cd solution (0.4 mmol) and thioglycolic acid (TGA) (1.4 mmol) were solvated in 80 ml distilled water with pH adjusted to 10.0 using NaOH solution. Next, sodium borohydrate (0.8 mmol) and Te powder were diluted in 10 ml distilled water in a flask, with vigorous stirring under argon flow. The mixture was heated to 80 °C to get a clear red NaHTe solution. Cd-TGA solution was heated at 100 °C under argon flow in a 250 ml three-neck flask. Then the freshly prepared NaHTe solution (4.0 ml) was added to the flask, and the resulting solution was refluxed at 100 °C for 2 hours.2.5 Cell culture
SK-BR-3 cells (human breast cancer cell line) and HEK 293 cells (from normal human embryonic kidney) were cultured in 25 cm2 tissue culture flasks (SPL, Korea) with 5 ml Dulbecco's modified Eagle's medium (Sigma, UK) containing 10% heat inactivated fetal bovine serum (Gibco), 100 U ml−1 penicillin (Sigma, UK). Cell lines were grown at 37 °C in a humidified atmosphere of 5% CO2 and 95% air for 5 days until the cell monolayer became confluent. Growth medium was replaced with fresh media every 2 days or as required, indicated by color change due to production of lactic acid and CO2, which leads to low pH. Upon reaching at least 80% confluence, the cells were washed with phosphate buffered saline (PBS) and trypsinized for 10 min at 37 °C with 0.05% trypsin.2.6 Total RNA extraction
Cell samples was disrupted and total RNA was extracted from SK-BR-3 and HEK 293 cell lines using Cell Culture Lysis Reagent (CCLR). Approximately 2.0 × 10⁶ cells were collected by low-speed centrifugation at 1000 rpm for 10 min. Culture medium was carefully removed and the pellet was washed twice with PBS. After carefully removing the PBS, 600 μl CCLR buffer was added. Cells were gently resuspended in CCLR buffer with a vortex and incubated for 20 min. Subsequently, 0.2 ml chloroform was added followed by a 20 s violently vortex. Next, the mixture was centrifuged for 20 min at 13![[thin space (1/6-em)]](https://www.rsc.org/images/entities/char_2009.gif) 000 rpm at 4 °C by refrigerated centrifugation. Adding the same volume of isopropyl alcohol to the upper water which has been taken out and mixing evenly in −20 °C precipitation for the night. Afterward, centrifugation for 20 min at 13
000 rpm at 4 °C by refrigerated centrifugation. Adding the same volume of isopropyl alcohol to the upper water which has been taken out and mixing evenly in −20 °C precipitation for the night. Afterward, centrifugation for 20 min at 13![[thin space (1/6-em)]](https://www.rsc.org/images/entities/char_2009.gif) 000 rpm at 4 °C was carried out. Next, the supernatant was removed and the rest was washed by 80% ethanol with DEPC water followed by centrifugation for 20 min at 13
000 rpm at 4 °C was carried out. Next, the supernatant was removed and the rest was washed by 80% ethanol with DEPC water followed by centrifugation for 20 min at 13![[thin space (1/6-em)]](https://www.rsc.org/images/entities/char_2009.gif) 000 rpm at 4 °C. The ethanol was volatilized (letting the tube dry) and the purified RNA was dissolved in an appropriate volume of DEPC water.
000 rpm at 4 °C. The ethanol was volatilized (letting the tube dry) and the purified RNA was dissolved in an appropriate volume of DEPC water.
2.7 Assay procedure
In order to determine the hybridization effects of miRNA targets on fluorescence intensities, different concentrations of miR-155 targets (from 20 to 100 pM) were added to 10 μl of the probe DNA (100 pM) in 40 μl of phosphate buffer (20 mM, pH = 6.5) and heated to 90 °C for 10 min (denaturation step). The hybridization was carried out by incubation at 37 °C for 1 h (annealing step). After incubation, 10 μl of green QDs (100 pM) was added to above solutions. All samples were heated to the set temperature (90 °C) in hot plate. All fluorescence experiments were carried out for all samples before and after heat treating at room temperature.2.8 Agarose gel electrophoresis analysis of oligonucleotide–QDs interaction
Agarose gel (3% v/v, high melt, medium fragments, Chemos CZ, s.r.o., Prague, Czech Republic) was prepared with 1× TAE buffer (40 mM Tris, 20 mM acetic acid and 1 mM ethylene diamine tetraacetic acid). 5 μl of samples were prepared with 5% (v/v) bromophenol blue and 3% (v/v) glycerol and loaded into a gel. The electrophoresis was run at 60 V and 6 °C for 20 min and visualized by UV trans illuminator (312 nm). The mixture samples including ssDNA, dsDNA/miRNA and their corresponding interacted samples (with QDs) were loaded into the gel lanes.3. Results and discussion
3.1 Thermo-responsive based aggregation/disaggregation of CdTe QDs
In this paper, we report a novel single – color fluorescence “off–on” switch system by applying melting temperature (Tm) for sensitive miRNA detection. The system was composed of TGA-capped CdTe QDs (TGA-capped CdTe QDs characterized in Fig S1†) in presence of ssDNA and DNA/miRNA heteroduplex and their different thermo-responsive at Tm. Quantitative detection of miRNA could be achieved by measuring the intensity and color change in fluorescence of the reaction solution before and after heat treating, respectively. Firstly, the CdTe QDs with maximum emission of 530 nm (green QDs) and disperse nanoparticles was prepared (Scheme 1a). After heating, the bare QDs solution emitted at 536 nm (green-yellow fluorescence) due to repulsion force reduction between the QDs (Scheme 1b).Upon addition of the single-stranded DNA probe to QDs solution, no significant difference was observed in the emission of QDs (Scheme 2a′). It has been suggested that ssDNA (with positive charge of bases) can be rapidly adsorbed onto negatively charged thioglycolic acid capped CdTe QDs surface to act as a coating and stabilizer and therefore by applying melting temperature, the fluorescence emission was completely changed to yellow emission (at 575 nm) (Scheme 2b′).
But after addition of miR-155 and duplex formation with DNA probe, the interaction between chalcogenide QDs and DNA/miRNA heteroduplex21–27 results in aggregation of the QD nanoparticles and their UV-vis absorption coefficient is reduced and therefore, their fluorescence intensity also is reduced (“signal off”)28–32 (Scheme 3a′). Then, by applying melting temperature, DNA probe strand dissociated from miRNA and red emission (at 615 nm) can be observed (“signal on”)32–36 (Scheme 3b′). This is due to the shorter distances between the CdTe QDs in the dsDNA/miRNA than that of the ssDNA and free CdTe QDs, which can increase the dipole–dipole interaction between the CdTe QDs resulting in a larger Stoke's shift emission change.19
3.2 Atomic force microscopy (AFM) analysis
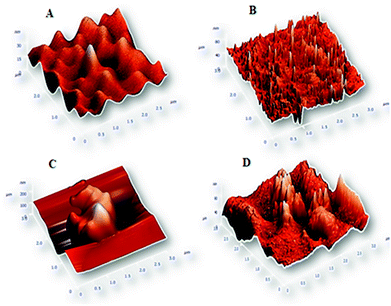
In order to confirm the hypothesis of CdTe QDs aggregation in the presence of double-stranded nucleic acid (DNA/miR-155 heteroduplex), and measuring the amount of QDs disaggregation in high temperature, AFM has been carried out on samples (Fig. 1). AFM spectroscopy was expected to confirm these interpretations by direct imaging of surface topographies.As shown in Fig. 1B, AFM results indicate that by applying Tm the CdTe QDs are dissociated (uncovered) from DNA probe and free DNAs can provide a short inter QDs distance with larger dimensions with a mean diameter of 80 nm in comparison to DNA-probe@QDs (Fig. 1A) in normal conditions with a mean diameter of 30 nm.
In the presence of miR-155 target and duplex formation with DNA probe, the QDs aggregate and induce a super-molecular structure with a mean diameter of 200 nm (Fig. 1C). But after applying Tm, the double-strands begins to dissociate from each other and following that the QDs de-aggregated relatively reaching a mean diameter of 80 nm (Fig. 1D). These results are in good agreement with fluorescence emission data in Schemes 2 and 3. And also we took TEM images (Fig. S2†) from aggregation/disaggregation phases of double stranded DNA/miR-155@QDs.
3.3 Optimization conditions
In order to obtain the best performance, some effective conditions such as different CdTe QDs concentration, heating time duration and high temperature were optimized.The efficiency of this assay is greatly dependent on the appropriate molar ratio between the quantum dot and DNA probe. Fig. S3(A)† exhibits the fluorescent emission spectra at different molar ratios of QDs to DNA probe (10, 1 and 0.1, respectively). Molar ratio 1![[thin space (1/6-em)]](https://www.rsc.org/images/entities/char_2009.gif) :
:![[thin space (1/6-em)]](https://www.rsc.org/images/entities/char_2009.gif) 1 was chosen as the optimum ratio, because it led to significant difference in fluorescence intensity between ssDNA and dsDNA/miR-155. In fact, we chose a concentration of the CdTe QDs in which the ratio has the most quenching effect in the presence of dsDNA/miRNA and the smallest quenching in the presence of a single strand DNA probe.
1 was chosen as the optimum ratio, because it led to significant difference in fluorescence intensity between ssDNA and dsDNA/miR-155. In fact, we chose a concentration of the CdTe QDs in which the ratio has the most quenching effect in the presence of dsDNA/miRNA and the smallest quenching in the presence of a single strand DNA probe.
Fig. S3(B)† shows the effect of different temperature (50 °C to 100 °C) with the addition of dsDNA/miR to CdTe QDs. When the temperature was at 90 °C, the color change of fluorescence (red shift) was maximized. It seems that at this temperature the DNA strand is dissociated from RNA strand well.
Finally the effect of heating time duration for dsDNA/miR-155 and CdTe QDs over the range of 1–20 min was studied. As shown in the Fig. S3(C),† incubation times which were about 15 min resulted in complete red shift of the QDs fluorescence signal. On the other hand, those more than 15 min had no significant difference compared to incubation time of 15 min. Therefore, 15 min was regarded as the best choice.
As shown in Fig. 2A, the hybridization with increasing amounts of target miR-155 can specifically decrease the fluorescence intensity of the TGA-CdTe QDs. The decrease fluorescence intensities are linearly proportional to the concentrations of target miR-155. After applying Tm, with increasing miR-155 concentration the maximum photoluminescence (PL) emission wavelength showed a red-shift from 580 nm to 615 nm, while the PL emission wavelength also exhibited a red-shift and the fluorescent color under UV irradiation changed from green to green-yellow, yellow and finally red. The red-shift of the maximum PL emission wavelength was due to the increasing of relative aggregation of QDs, while the increasing PL emission intensity was due to the improvement of the crystallization. The decrease of the PL intensity after heat treating resulted from the high concentration, large size and relatively small surface-to-volume ratio of the obtained QDs (Fig. 2B). A linear relationship between the emission intensity of QDs and the miR-155 concentration was obtained the range of 10–100 pM. The detection limit is 0.42 pM (S/N = 3). In addition, compared with other QDs based-sensing methods for miRNA detection39–44 the proposed biosensor exhibited acceptable sensitivity while other methods have used labeled probes, enzymes, immobilization (Table 1).
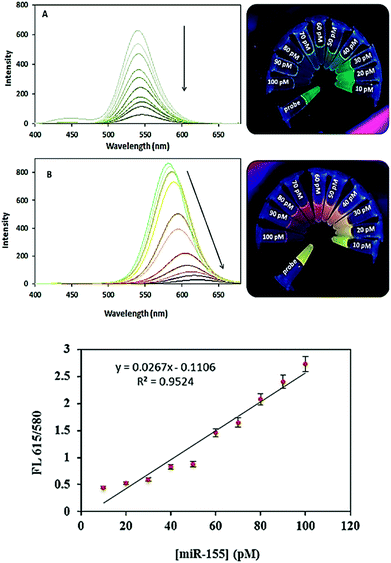 | ||
| Fig. 2 Emission spectra of dsDNA–QDs complex formed with miR-155 target in a concentration ranging 10, 20, 30, 40, 50, 60, 70, 80, 90 and 100 pM, before (A) and after (B) heat treatment. | ||
| Method | Quantum dot | LOD | Ref. |
|---|---|---|---|
| Electrochemiluminescence resonance energy transfer | CdSe@ZnS QDs | 0.03 fM | 39 |
| Catalytic hairpin assembly | CdTe/CdS/ZnS QDs | 37 fM | 40 |
| Resonance light scattering | CdTe QDs | 9.4 pM | 41 |
| Electrochemiluminescence | Nitrogen doped carbon QDs | 10 aM | 42 |
| Fluorescence resonance energy transfer | MoS2 QDs | 0.38 nM | 43 |
| Photoelectrochemical aptasensor | CdSe QDs | 5.6 fM | 44 |
| Thermo-responsive | CdTe QDs | 0.42 pM | This work |
To study aggregation/disaggregation kinetics before and after heating, the S–V plot obtained (Fig. S4†) by a Stern–Volmer equation:
| F0/F = 1 + KSV[Q] |
3.4 Gel electrophoresis
To further confirm the interaction of CdTe QDs with dsDNA/miRNA, agarose gel electrophoresis was carried out in phosphate buffer. The agarose gel electrophoresis image demonstrated the impact of the binding of CdTe QDs with ssDNA (lane b) and dsDNA/miR-155 (lane d) which is shown in Fig. 3. Different molecular mass or different conformation of DNA will appear as different stripes. As shown in Fig. 3, the ssDNA probe was loaded to lane a. In the lane b there were mixture samples of lane 1 contents with QDs in ratio 1![[thin space (1/6-em)]](https://www.rsc.org/images/entities/char_2009.gif) :
:![[thin space (1/6-em)]](https://www.rsc.org/images/entities/char_2009.gif) 1. The lane c was loaded by dsDNA formed by miR-155 target (after hybridization) and finally in the lane d there was mixture sample of lane c contents with QDs in ratio 1
1. The lane c was loaded by dsDNA formed by miR-155 target (after hybridization) and finally in the lane d there was mixture sample of lane c contents with QDs in ratio 1![[thin space (1/6-em)]](https://www.rsc.org/images/entities/char_2009.gif) :
:![[thin space (1/6-em)]](https://www.rsc.org/images/entities/char_2009.gif) 1. The low or no brightness of the lane was dependent on the amount of QDs that had interaction with dsDNA/miRNA–QDs (Fig. 3, line d). This is probably due to the fact that DNA–QDs interactions are preventing the DNA to be stained. These results illustrated that gel electrophoresis also could prove the interaction of dsDNA/miRNA and CdTe QDs and help us to distinguish between DNA probe and DNA/miRNA heteroduplex.
1. The low or no brightness of the lane was dependent on the amount of QDs that had interaction with dsDNA/miRNA–QDs (Fig. 3, line d). This is probably due to the fact that DNA–QDs interactions are preventing the DNA to be stained. These results illustrated that gel electrophoresis also could prove the interaction of dsDNA/miRNA and CdTe QDs and help us to distinguish between DNA probe and DNA/miRNA heteroduplex.
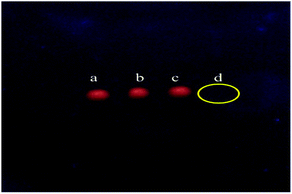 | ||
| Fig. 3 Gel electrophoresis of (a) the ssDNA probe, (b) the ssDNA complex formed by QDs, (c) the dsDNA formed by miR-155 target, (d) the dsDNA/miR-155 complex formed by QDs. | ||
3.5 Specificity
Selectivity is another important quality index in evaluating performance for the sensing platform described here, as it is a significant challenge for miRNA assays to accurately recognize a specific miRNA in the presence of other miRNAs. DNA probes complementary to miR-155 were designed to distinguish miR-155 from non-complementary target DNA, miR-21, Let 7a and mixture of all sequences at the same concentration of 100 pM. As the results are shown in Fig. 4, the fluorescence shift of the DNA probe toward the perfectly matched target miR-155 was much larger than that other sequences which were closed to that of the blank sample. Also, this method is specifically capable of detecting miR-155 in the presence of other miRNAs and DNA sequence. These results confirm the high specificity for miRNA detection in this method.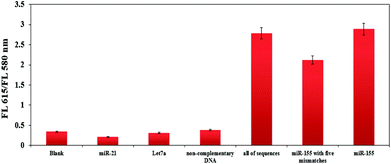 | ||
| Fig. 4 Plot of FL 615/FL 580 nm ratio obtained with different miRNA and non-complementary DNA at the same concentration (100 pM). | ||
3.6 Detection of cellular microRNA-155
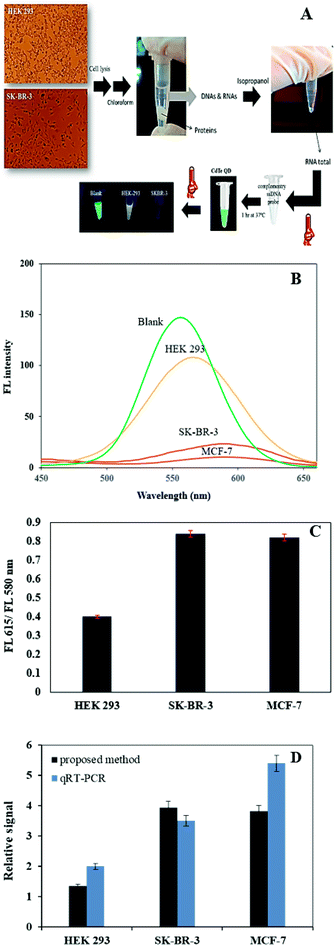
To investigate the feasibility of this proposed assay to biological samples, we applied this method to detect miR-155 in total RNA extraction from human breast carcinoma SK-BR-3, MCF-7 cells and normal HEK 293 cells. The fluorescence response of the CdTe QDs based system in total RNA extracts was recorded (Fig. 5). RNA extracts obtained from SK-BR-3 (73.8 ng μl−1), MCF-7 (103.2 ng μl−1) and HEK 293 (63.4 ng μl−1) were mixed with hybridization ssDNA probe and the QDs and then we initialized the temperature treatment. As shown in Fig. 5, the wavelength emission of the system for the SK-BR-3 and MCF-7 was around 595 nm and for HEK 293 was around 565 nm. The same samples were also tested by quantitative real-time PCR (qRT-PCR) method. The results show that miR-155 had different expression levels in HEK 293 (human normal cell) and MCF-7, SK-BR-3 (human breast cancer cells). The cell lysate from SK-BR-3 and MCF-7 had a higher concentration of miR-155 than that of HEK 293. The results obtained by the suggested strategy in this work were in good agreement with RT-PCR and also consistent with previously published data by standard methods.45,464. Conclusion
In summary, we developed a facile switchable fluorescent CdTe QD probe for microRNA-155 detection. The switching mechanism is based on QDs aggregation in the presence of double stranded DNA/miR-155 (due to interaction between dsDNA/miR-155 and QDs) and applying melting temperature triggered QDs disaggregation (due to dissociation of miR strand from DNA probe). Taking advantage of the flexible processability of QDs, this switchable fluorescent probe has great promise for the detection of various targets, such as other microRNAs and gene detection.Conflicts of interest
There are no conflicts to declare.Acknowledgements
The authors are grateful to the Iran National Science Foundation (INSF 96010584) and the Tehran University (Grant 28645/01/02) for the financial support of this work.References
- G. Higgs and F. Slack, J. Clin. Bioinf., 2013, 3, 17 CrossRef PubMed.
- G. Bertoli, C. Cava and I. Castiglioni, Theranostics, 2015, 5, 1122 CrossRef PubMed.
- S. C. Eastlack and S. K. Alahari, Non-Coding RNA, 2015, 1, 7 CrossRef PubMed.
- Z. Chen, T. Ma, C. Huang, T. Hu and J. Li, J. Cell. Physiol., 2014, 229, 545 CrossRef PubMed.
- K. Zhang, Y. Zhang, C. Liu, Y. Xiong and J. Zhang, Int. J. Oncol., 2014, 45, 950 CrossRef PubMed.
- S. Persano, M. L. Guevara, J. Wolfram, E. Blanco, H. Shen, M. Ferrari and P. P. Pompa, ACS Omega, 2016, 1, 448 CrossRef PubMed.
- T. Tian, J. Wang and X. Zhou, Org. Biomol. Chem., 2015, 13, 2226 RSC.
- E. A. Hunt, D. Broyles, T. Head and S. K. Deo, Annu. Rev. Anal. Chem., 2015, 8, 217 CrossRef PubMed.
- Y. S. Borghei, M. Hosseini, M. Khoobi and M. R. Ganjali, J. Fluoresc., 2017, 27, 529 CrossRef PubMed.
- Y. S. Borghei, M. Hosseini, M. R. Ganjali and S. Hosseinkhani, J. Pharm. Biomed. Anal., 2018, 15, 81 CrossRef PubMed.
- Y. S. Borghei, M. Hosseini and M. R. Ganjali, Microchim. Acta, 2017, 184, 4713 CrossRef.
- Y. S. Borghei, M. Hosseini, M. R. Ganjali and S. Hosseinkhani, Sens. Actuators, B, 2017, 248, 133 CrossRef.
- M. Hosseini, A. Akbari, M. R. Ganjali, M. Dadmehr and A. H. Rezayan, J. Fluoresc., 2015, 25, 925 CrossRef PubMed.
- M. Hosseini, S. Mohammadi, Y. S. Borghei and M. R. Ganjali, J. Fluoresc., 2017, 27, 1443 CrossRef PubMed.
- M. Dadmehr, M. Hosseini, S. Hosseinkhani, M. R. Ganjali and R. Sheikhnejad, Biosens. Bioelectron., 2015, 73, 108 CrossRef PubMed.
- R. Zhang, D. Zhao, H. G. Ding, Y. X. Huang, H. Z. Zhong and H. Y. Xie, Biosens. Bioelectron., 2014, 56, 51 CrossRef PubMed.
- Y. Yuan, J. Zhang, G. Liang and X. Yang, Analyst, 2012, 137, 1775 RSC.
- K. D. Wegner and N. Hildebrandt, Chem. Soc. Rev., 2015, 44, 4792 RSC.
- S. K. Kailasa, K. H. Cheng and H. F. Wu, Materials, 2013, 6, 5763 CrossRef PubMed.
- W. R. Algar and U. J. Krull, J. Colloid Interface Sci., 2011, 359, 148 CrossRef PubMed.
- Z. Wang, H. He, W. Slough, R. Pandey and S. P. Karna, J. Phys. Chem. C, 2015, 119, 25965 CrossRef.
- W. R. Algar and U. J. Krull, Langmuir, 2006, 22, 11346 CrossRef PubMed.
- S. S. Narayanan, S. S. Sinha, P. K. Verma and S. K. Pal, Chem. Phys. Lett., 2008, 463, 160 CrossRef.
- Q. Xu, J. H. Wang, Z. Wang, Z. H. Yin, Q. Yang and Y. D. Zhao, Electrochem. Commun., 2008, 10, 1337 CrossRef.
- S. Anandampillai, X. Zhang, P. Sharma, G. C. Lynch, M. A. Franchek and K. V. Larin, Comput. Methods Appl. Mech. Eng., 2008, 197, 3378 CrossRef.
- L. Y. Zhang, H. Z. Zheng, Y. J. Long, C. Z. Huang, J. Y. Hao and D. B. Zhou, Talanta, 2011, 83, 1716 CrossRef PubMed.
- Y. S. Borghei, M. Hosseini and M. R. Ganjali, Microchim. Acta, 2017, 1 Search PubMed.
- V. Poderys, M. Matulionyte, A. Selskis and R. Rotomskis, Nanoscale Res. Lett., 2010, 6, 9 Search PubMed.
- A. A. Ensafi, N. Kazemifard and B. Rezaei, Biosens. Bioelectron., 2016, 77, 499 CrossRef PubMed.
- M. Hosseini, M. R. Ganjali, A. Jarrahi, Z. vaezi, F. Mizani and F. Faridbod, Spectrochim. Acta, Part A, 2014, 132, 629 CrossRef PubMed.
- M. Noh, T. Kim, H. Lee, C. K. Kim, S. W. Joo and K. Lee, Colloids Surf., A, 2010, 359, 39 CrossRef.
- J. Liu, X. Yang, K. Wang, R. Yang, H. Ji, L. Yang and C. Wu, Chem. Commun., 2011, 47, 935 RSC.
- S. D. Quinn and S. W. Magennis, RSC Adv., 2017, 7, 24730 RSC.
- M. Gilic, N. Romcevic, M. Romcevic, D. Stojanovic, R. Kostic, J. Trajic, W. D. Dobrowolski, G. Karczewski and R. Galazka, J. Alloys Compd., 2013, 579, 330 CrossRef.
- A. Polimeni, A. Patane, M. Henini, L. Eaves and P. C. Main, Phys. Rev. B, 1999, 59, 5064 CrossRef.
- A. J. Chiquito, Y. A. Pusep, S. Mergulhão, Y. G. Gobato, J. C. Galzerani and N. Moshegov, Mater. Res., 2004, 7, 459 CrossRef.
- M. Hosseini, M. R. Ganjali, Z. Vaezi, B. Arabsorkhi, M. Dadmehr, F. Faridbod and P. Norouzi, Sens. Actuators, B, 2015, 210, 349 CrossRef.
- F. S. Sabet, M. Hosseini, H. Khabbaz, M. Dadmehr and M. R. Ganjali, Food Chem., 2017, 220, 527 CrossRef PubMed.
- P. Zhang, Z. Li, H. Wang, Y. Zhuo, R. Yuan and Y. Chai, Nanoscale, 2017, 9, 2310 RSC.
- R. Yuan, X. Yu, Y. Zhang, L. Xu, W. Cheng, Z. Tu and S. Ding, Biosens. Bioelectron., 2017, 92, 342 CrossRef PubMed.
- S. Lv, F. Chen, C. Chen, X. Chen, H. Gong and C. Cai, Talanta, 2017, 165, 659 CrossRef PubMed.
- Q. Liu, C. Ma, X. P. Liu, Y. P. Wei, C. J. Mao and J. J. Zhu, Biosens. Bioelectron., 2017, 92, 273 CrossRef PubMed.
- X. Yu, L. Hu, F. Zhang, M. Wang, Z. Xia and W. Wei, Microchim. Acta, 2018, 185, 239 CrossRef PubMed.
- X. Cong, M. Zhou, T. Hou, Z. Xu, Y. Yin, X. Wang and M. Yin, Electroanalysis, 2018, 30, 1140 CrossRef.
- R. Dinami, C. Ercolani, E. Petti, S. Piazza, Y. Ciani, R. Sestito, A. Sacconi, F. Biagioni, C. Le Sage, R. Agami and R. Benetti, Cancer Res., 2014, 74, 4145 CrossRef PubMed.
- M. C. Casey, K. J. Sweeney, J. A. Brown and M. Kerin, Int. J. Cancer, 2016, 139, 12 CrossRef PubMed.
Footnote |
| † Electronic supplementary information (ESI) available. See DOI: 10.1039/c8ra04257h |
| This journal is © The Royal Society of Chemistry 2018 |

