DOI:
10.1039/C8RA04396E
(Paper)
RSC Adv., 2018,
8, 26978-26986
Fast removal of methylene blue from aqueous solution using coal-based activated carbon
Received
23rd May 2018
, Accepted 23rd July 2018
First published on 30th July 2018
Abstract
Coal-based activated carbons (CACs) were prepared from three long flame coals with different ash and volatile matter content. CACs prepared by coal with high ash (6.74%) and volatile matter content (34.31%) showed better adsorption efficiency towards MB (547.35 mg g−1) due to higher surface area and pore volume. The effect of coal to activating agent ratio (CAR) was also investigated in a batch reactor. The porosity development is closely related to the CAR. The calculated monolayer adsorption amount (714.29 mg g−1) was found on YLC-AC-3 with a surface area of 1212.50 m2 g−1. The equilibrium data were favorably described by the Langmuir and Freundlich isotherm models, and adsorption kinetics fitted well to the pseudo-second order model. The removal efficiency remains at 98.21% after five runs. The results of the present study suggest that CACs are potential and effective adsorbents in fast removal of dyes from aqueous solution.
1. Introduction
Nowadays, organic dyes are widely used in many industries such as textiles, leather, paper, wool, printing and cosmetics.1 Large amounts of wastewater containing complex dyes are generated during the coloring process from industries, causing severe environmental problems due to the toxic and carcinogenic effects on living creatures.2,3 Thus, great attention has been paid to develop an effective method to remove dyes from wastewater efficiently. Methylene blue (MB), as shown in Fig. 1, a stable cationic dye, is difficult to decolorize due to its complex structure and stable chemical properties.4 However, MB is widely used in the dyeing industry and could cause permanent injury to the eyes of humans and animals.5
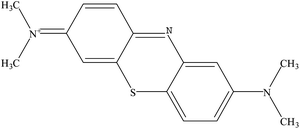 |
| | Fig. 1 The molecular structure of MB. | |
Various physical and chemical methods, including adsorption, filtration, ion-exchange, ozonation and oxidation have been employed to remove dyes from wastewater.6 Many disadvantages are coupled with most of these methods. Typically, oxidation method requires high energy costs and will produce by-products. The ion-exchange method has the problems of adsorbent regeneration and disposal requirements. The coagulation/flocculation method will cause high sludge production and formation of large particles. The halflife in the ozonation method is short and the membrane filtration method will produce concentrated sludge.7 Due to the high efficiency, simplicity of design and flexibility in operation, adsorption is one of the most economical and effective techniques.8 Various adsorbents have been reported to remove dyes from wastewater, among which, activated carbons (ACs) are most widely used because of their high adsorption capacity, extremely large surface area, micropore volumes and high surface reactivity.9,10
ACs could be obtained from various sources of raw materials, such as coal, petroleum, wood, and agricultural wastes. Owning to the advantages of its low cost, and relatively abundant resources, coal is one of the most commonly used precursor for ACs production.11 Meanwhile, the unique properties, such as well-developed surface area, high mechanical and chemical resistance and easy degradation, coal is sometimes much better than those of synthetic and mineral substances.12 Thus, coal has been widely selected as a stable alternative precursor for ACs preparation. El Qada and his co-workers reported that AC produced from steam activated bituminous coal showed a equilibrium adsorption capacity of 580 mg g−1 for MB.13 Gao et al. prepared a magnetic CAC using bituminous coal in the presence of Fe2O3 which exhibited a capacity of 871 mg g−1 in MB adsorption at optimized conditions.14 Duan et al. regenerated the spent CAC with a adsorption capacity of 375.93 mg g−1 for MB.15 Li et al. found that AC prepared from anthracite through microwave assisted activation could obtain a capacity of 132.03 mg g−1 for MB.16
Chemical activation is widely used for the preparation of ACs. The broadly used activating agents are KOH, H3PO4, ZnCl2, NaOH and K2CO3. Jibril et al. found AC prepared using KOH as activating agent led to higher surface area, more porous structure with wider pore size distributions than that of H3PO4.17 Gao and co-workers studied the effect of different activating agents in preparation of AC from crab shell, AC activated by KOH exhibited high surface area of 2197 m2 g−1.18 Kopac et al. prepared two samples using Zonguldak region coal, and found that the samples activated by KOH showed better color removal performance than commercial AC and the sample activated by physical method.19 According to the previous reports, KOH is the one of the most commonly used activating agent. KOH activation process mainly involves the redox reaction of potassium, carbon oxidation and additional reactions between the active intermediates and the carbon surface, which could produce gas to generate porosity, thus leading to higher surface area, more porous structure with wider pore size distributions.20 The reactions involved are shown in the following equations:
| | |
6KOH + C → 2K + 3H2 + 2K2CO3
| (1) |
| | |
K2CO3 + C → K2O + 2CO2
| (2) |
The main purpose of the present study is to find the relationship between raw coal and the physic-chemical nature of activated carbon materials. The results show that adsorption ability is closely related to the ash and volatile matter content of coal and the CAR. Also, a high MB monolayer adsorption amount (714.29 mg g−1) was recorded on YLC-AC-3 with large surface area (1212.50 m2 g−1) and pore volume and the optimal CAR is 1![[thin space (1/6-em)]](https://www.rsc.org/images/entities/char_2009.gif) :
:![[thin space (1/6-em)]](https://www.rsc.org/images/entities/char_2009.gif) 3. Adsorption kinetic models and isotherms were also studied in detail.
3. Adsorption kinetic models and isotherms were also studied in detail.
2. Materials and methods
2.1. Materials
Coals, with size less than 200 mesh (<74 μm), were obtained from different regions of northwestern China, Yulin coal (YLC), Shenfu coal (SFC) and Xinjiang coal (XJC). The raw coals were dried in oven at 393 K for 12 h before used. KOH and ethanol were of analytical grade, and used as received without further purification. MB was supplied by Development of Fine Chemicals of Tianxin (Tianjin, China).
2.2. Preparation of samples
In a typical procedure, coal was pre-carbonized at 723 K for 30 min at a heating rate of 5 K min−1. The obtained char was weighed and then mixed with 6 mol L−1 KOH solution under magnetic stir for 2 h at 298 K, and then dried at 333 K for 12 h. Finally, the obtained powder was heated from room temperature to 1073 K at a heating rate of 5 K min−1 under 100 mL min−1 N2 flow for 2 h. The resulting samples were washed with deionized water until the filtrate reached neutral. The remaining solid was dried at 393 K for 5 h. The CACs prepared by YLC, SFC and XJC without KOH activation were named as YLC-AC-0, SFC-AC-0 and XJC-AC-0. The prepared CACs using YLC to KOH at mass ratio of 1![[thin space (1/6-em)]](https://www.rsc.org/images/entities/char_2009.gif) :
:![[thin space (1/6-em)]](https://www.rsc.org/images/entities/char_2009.gif) 1, 1
1, 1![[thin space (1/6-em)]](https://www.rsc.org/images/entities/char_2009.gif) :
:![[thin space (1/6-em)]](https://www.rsc.org/images/entities/char_2009.gif) 2, 1
2, 1![[thin space (1/6-em)]](https://www.rsc.org/images/entities/char_2009.gif) :
:![[thin space (1/6-em)]](https://www.rsc.org/images/entities/char_2009.gif) 3 and 1
3 and 1![[thin space (1/6-em)]](https://www.rsc.org/images/entities/char_2009.gif) :
:![[thin space (1/6-em)]](https://www.rsc.org/images/entities/char_2009.gif) 4 were named as YLC-AC-1, YLC-AC-2, YLC-AC-3 and YLC-AC-4. Other samples prepared by the same method were named as SFC-AC-1, SFC-AC-2, SFC-AC-3, SFC-AC-4, XJC-AC-1, XJC-AC-2, XJC-AC-3 and XJC-AC-4.
4 were named as YLC-AC-1, YLC-AC-2, YLC-AC-3 and YLC-AC-4. Other samples prepared by the same method were named as SFC-AC-1, SFC-AC-2, SFC-AC-3, SFC-AC-4, XJC-AC-1, XJC-AC-2, XJC-AC-3 and XJC-AC-4.
2.3. Characterization
Proximate and ultimate analysis of YLC, SFC and XJC were carried out using an elemental analyzer (VarioEL III , German). The alkali metal and alkaline earth elements analysis (AAEMs) of YLC, SFC and XJC were investigated using an inductively coupled plasma source mass spectrometer (Agilent ICP-OES730). The scanning electron microscopy (SEM) analysis was performed using a scanning electron microscope Carl Zeiss (ZEISS SIGMA). The samples were treated with gold spray before observation. The crystallographic structure was recorded on a diffractometer with Cu Kα radiation (λ = 0.153 nm), using a X-ray diffractometer (XRD) operated at 40 mA and 40 KV. Data was collected at 0.02° with a rate of 8° min−1, in a 2θ range of 15° to 80°. The surface area and pore structure characteristic were determined by nitrogen adsorption–desorption isotherms at 77 K via a Quantachrom NOVA 2200e instrument. The Brunauer–Emmett–Teller (BET) surface area (SBET) and micropore surface area (Am), micropore volume (Vm) were calculated using the BET equation and t-plot method, respectively. Total pore volume (Vt) was calculated by converting the adsorption amount at P/P0 = 0.95 to a volume of liquid adsorbate. All samples were outgassed for 5 h in vacuum at 453 K before measurements. The concentrations of MB were measured by a UV-visible spectrophotometer at the wavelength of maximum absorbance of 664 nm.
2.4. Adsorption experiments of MB
15 mg sample was added to 15 mL MB solution with known concentration and pH value under 300 rpm magnetic stir at 298 K. The samples were taken periodically and centrifuged. The supernatant was collected and the remaining solution was analyzed by a UV-visible spectrophotometer.
The percentage of dye removal efficiency (% Re) and the adsorption capacity (qt, qe) were calculated using following equations:
| | |
% Re = (C0 − Ce)/C0 × 100
| (4) |
where
qe (mg g
−1) and
qt (mg g
−1) are the adsorption capacity at equilibrium and time
t (min),
C0 is the initial concentration of MB (mg L
−1),
Ce (mg L
−1) and
Ct (mg L
−1) are the concentrations of MB at equilibrium and
t (min), respectively,
V is the volume of the solution (L), and
W is the mass of CACs used (g).
2.5. The regeneration and recycling test
In a typical recycle test, 50 mg sample was added to 50 mL of MB solution with a initial concentration of 100 mg L−1, and the suspension was stirred at 300 rpm for 10 min. The mixture was centrifugated, the supernatant was determined by UV spectrophotometer, the sample dried at 398 K for 5 h and then was calcined at 673 K (5 K min−1) under the N2 flow rate at 100 mL min−1 for 2 h in vertical tube furnace to remove the dye.
3. Results and discussion
3.1. Effects of ash and volatile matter
Porosity development is closed related to ash and volatile matter content. Indeed, minerals (e.g. Ca, Si, Fe, Al, Mg, Na) are reported to act as catalyst which accelerate gasification reactions during activation process.21 Table 1 shows the alkali metal and alkaline earth elements analysis of different coals. The Ca, Si, Fe and Al contents of XJC are the lowest, and Mg and Na contents of XJC are higher than others. The Fe content of YLC is similar to SFC. The Ca, Si and Al contents of YLC are the highest among all the samples.
Table 1 AAEMs of different coals
| Coal |
AAEMs (mg kg−1, by dry weight) |
| Ca |
Si |
Fe |
Al |
Mg |
Na |
| YLC |
21![[thin space (1/6-em)]](https://www.rsc.org/images/entities/char_2009.gif) 384.71 384.71 |
655.63 |
2232.94 |
933.90 |
352.62 |
495.86 |
| SFC |
19![[thin space (1/6-em)]](https://www.rsc.org/images/entities/char_2009.gif) 402.31 402.31 |
609.29 |
2395.86 |
690.11 |
275.52 |
374.05 |
| XJC |
4428.43 |
160.59 |
1458.91 |
517.30 |
2223.83 |
3764.79 |
The evolution of volatiles from the activated carbon favors pore development.22 To find the relationships between coal reactivity and porosity development, the proximate analysis and ultimate analysis of coals are shown in the Table 2. The volatile matter content decreased in the order of YLC (34.31%) > XJC (33.26%) > SFC (31.67%). Ash content ranged from 6.74% to 2.16% from YLC to XJC. The evolution of CO and CO2 could generate porosity, therefore a higher oxygen content in raw coal may ensure a higher SBET.22 A high oxygen content of 24.18% was observed on YLC, and a low oxygen content of 10.9% was found on SFC.
Table 2 Proximate and ultimate analysis of different coals
| Coal |
Proximate analysis (wt%, ad) |
Ultimate analysis (wt%, ad) |
| FCad |
Mad |
Aad |
Vad |
C |
H |
N |
S |
O |
| YLC |
55.25 |
3.70 |
6.74 |
34.31 |
70.28 |
3.87 |
1.13 |
0.54 |
24.18 |
| XJC |
54.51 |
10.07 |
2.16 |
33.26 |
67.83 |
3.89 |
0.77 |
0.10 |
15.18 |
| SFC |
59.93 |
4.03 |
4.37 |
31.67 |
75.12 |
4.40 |
0.94 |
0.24 |
10.90 |
Fig. 2 shows the adsorption of MB onto different CACs. YLC-AC-3 shows a high adsorption amount of 547.35 mg g−1 for MB in 20 min, follow by XJC-AC-3 (465.43 mg g−1) and SFC-AC-3 (438.56 mg g−1). As discussed before, the ash and volatile matter content are closely related to porosity, the experimental data follows the same trend. YLC with the highest ash (6.74%), volatile matter content (34.31%) and oxygen content (24.18%) shows the best ability in fast removal of MB.
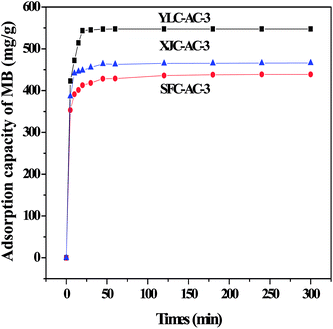 |
| | Fig. 2 The adsorption of MB onto different CACs. | |
To further study the effect of ash and volatile matter content of coals on the porosity development of CACs, the samples were characterized by SEM, XRD and N2 adsorption–desorption.
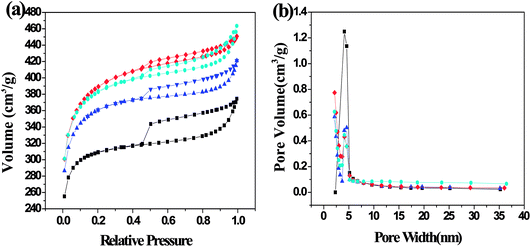
3.1.1. Porous structure analysis. The nitrogen adsorption–desorption isotherms and pore size distribution are shown in Fig. 3. The isotherms of SFC-AC-3 and XJC-AC-3 demonstrated a rise at low P/P0 range, and a gradual increase at a relatively high P/P0 range (Fig. 3), a typical type I isotherm, indicating micropores dominated the materials. The desorption branch shows a small hysteresis loop at relatively high pressure, indicating the existence of mesoporosity. This adsorption behavior suggests a combination of microporous–mesoporous structure.23 The YLC-AC-3 shows remarkable hysteresis at P/P0 > 0.4, a typical type IV isotherms, indicating the plentiful presence of mesopores. The pore size distribution in the range of 2–4 nm further confirmed the mesopores.
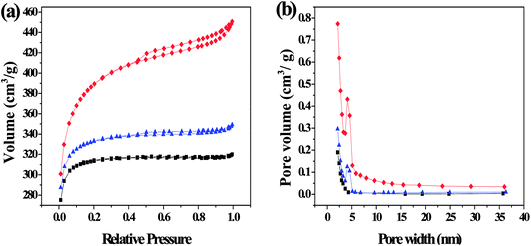 |
| | Fig. 3 (a) N2 adsorption–desorption isotherms and (b) the corresponding pore size distribution (PSD) calculated using adsorption branch of BJH algorithm for samples of YLC-AC-3 (◆), SFC-AC-3 (■) and XJC-AC-3 (▲). | |
Table 3 shows the surface area and pore structure of different CACs. Obviously, KOH activation effectively increased the surface area and pore volume of CACs. The YLC-AC-0, SFC-AC-0 and XJC-AC-0 without KOH activation shows small surface area and pore volume. After KOH activation, the surface area and pore volume of YLC-AC-3, SFC-AC-3 and XJC-AC-3 increased tremendously. The SFC-AC-3 with the relatively low ash and volatile matter content shows the lowest surface area of 942.10 m2 g−1 and pore volume of 0.49 cm3 g−1, compared with XJC and YLC. On the other hand, a high surface area (1212.50 m2 g−1) and pore volume (0.69 cm3 g−1) of YLC-AC-3 was observed, which might be closely related to the minerals in ash and high volatile matter content as discussed in Section 3.1. Porosity development and thus high surface area values are results of pores created by both volatiles evolution and KOH activation. The kinetic diameter of MB molecule is 1.43 × 0.61 × 0.4 nm.24 These dimensions allow MB to have easy access within the porous structure of CACs, the average pore size are approximately 2 nm. Among the six CACs, the YLC-AC-3 shows the best adsorption capacity of MB due to its large surface, pore volume and relatively larger average pore size.
Table 3 Surface area and pore structure of different CACs
| Samples |
SBET (m2 g−1) |
VT (cm3 g−1) |
Vm (cm3 g−1) |
Sm (m2 g−1) |
Aps (nm) |
| YLC-AC-0 |
26.22 |
0.01 |
0.01 |
13.31 |
1.49 |
| YLC-AC-3 |
1212.50 |
0.69 |
0.28 |
613.97 |
2.26 |
| SFC-AC-0 |
0.70 |
0.003 |
0.003 |
— |
— |
| SFC-AC-3 |
942.10 |
0.49 |
0.34 |
643.12 |
2.09 |
| XJC-AC-0 |
28.85 |
0.01 |
0.01 |
15.53 |
1.27 |
| XJC-AC-3 |
1007.18 |
0.53 |
0.34 |
669.24 |
2.12 |
3.1.2. Surface morphology analysis. The SEM images of different coals and CACs are shown in Fig. 4. It showed that the surfaces of YLC, SFC and XJC are relatively smooth without any pores except for some occasional cracks. After KOH activation, the external surfaces of three CACs all show irregular pores. The surface of YLC-AC-3 (Fig. 4d) is relatively rough and exhibits more pores. While SFC-AC-3 with low ash and volatile matter content shows a fairly smooth surface. Ahmed et al. reported that metallic potassium formed during the gasification process could diffuse into the internal structure of carbon matrix widening the existing pores and created new porosities.25
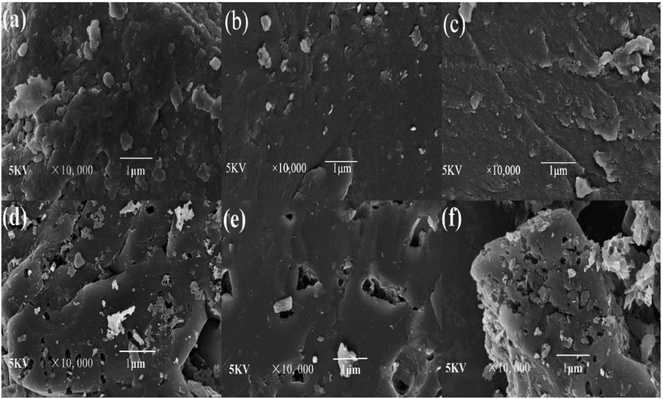 |
| | Fig. 4 SEM micrographs of (a) YLC, (b) SFC, (c) XJC, (d) YLC-AC-3, (e) SFC-AC-3, (f) XJC-AC-3 selected at 10![[thin space (1/6-em)]](https://www.rsc.org/images/entities/char_2009.gif) 000× magnification. 000× magnification. | |
3.1.3. Crystal structure. XRD patterns of all samples are shown in Fig. 5. An obvious peak at around 24° and a broad peak at 44° on SFC-AC-3 and XJC-AC-3, could be attributed to the (002) crystal face of graphitic carbon and the (100) reflections of disordered stacking of micrographites. The peaks at around 26° and 29° on YLC-AC-3 corresponded to the (002) reflections of graphitic carbon and the disordered stacking of micrographites (JCPDS no. 41-1487).11 The diffraction angle of (002) crystal face of SFC-AC-3 and XJC-AC-3 is smaller than YLC-AC-3. From Bragg equation 2dhkl![[thin space (1/6-em)]](https://www.rsc.org/images/entities/char_2009.gif) sin
sin![[thin space (1/6-em)]](https://www.rsc.org/images/entities/char_2009.gif) θ = nλ, the plane spacing d (002) of diffraction crystal face (002) for SFC-AC-3 and XJC-AC-3 is relatively large, indicating that the turbostratic degree of the SFC-AC-3 and XJC-AC-3 is apparent.26
θ = nλ, the plane spacing d (002) of diffraction crystal face (002) for SFC-AC-3 and XJC-AC-3 is relatively large, indicating that the turbostratic degree of the SFC-AC-3 and XJC-AC-3 is apparent.26
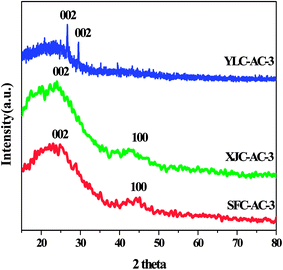 |
| | Fig. 5 XRD spectra of YLC-AC-3, SFC-AC-3 and XJC-AC-3. | |
3.2. Effect of coal to activating agent ratio (CAR)
The CAR plays a key role in development of porosity, including the micropore volume as well as the micropores size distribution.27,28 Table 4 shows the effect of CAR on MB adsorption amount. The adsorption amount of MB rose from 445.67 mg g−1 to 547.35 mg g−1, 346.22 mg g−1 to 438.56 mg g−1 and 368.84 mg g−1 to 465.43 mg g−1 when CAR from 1![[thin space (1/6-em)]](https://www.rsc.org/images/entities/char_2009.gif) :
:![[thin space (1/6-em)]](https://www.rsc.org/images/entities/char_2009.gif) 1 to 1
1 to 1![[thin space (1/6-em)]](https://www.rsc.org/images/entities/char_2009.gif) :
:![[thin space (1/6-em)]](https://www.rsc.org/images/entities/char_2009.gif) 3 on YLC-AC, SFC-AC and XJC-AC, respectively. Wu et al. reported that increasing KOH amount could enhance the pore development and create new pores during activation process because with the rising ratio, more active sites could react with KOH.29 The activation reaction was strengthened and a large number of pores were formed with the rising ratio from 1
3 on YLC-AC, SFC-AC and XJC-AC, respectively. Wu et al. reported that increasing KOH amount could enhance the pore development and create new pores during activation process because with the rising ratio, more active sites could react with KOH.29 The activation reaction was strengthened and a large number of pores were formed with the rising ratio from 1![[thin space (1/6-em)]](https://www.rsc.org/images/entities/char_2009.gif) :
:![[thin space (1/6-em)]](https://www.rsc.org/images/entities/char_2009.gif) 1 to 1
1 to 1![[thin space (1/6-em)]](https://www.rsc.org/images/entities/char_2009.gif) :
:![[thin space (1/6-em)]](https://www.rsc.org/images/entities/char_2009.gif) 3, therefore the adsorption capacity increased due to the larger surface and pore volume. When CAR reached 1
3, therefore the adsorption capacity increased due to the larger surface and pore volume. When CAR reached 1![[thin space (1/6-em)]](https://www.rsc.org/images/entities/char_2009.gif) :
:![[thin space (1/6-em)]](https://www.rsc.org/images/entities/char_2009.gif) 3, the carbons on the active sites could be reacted completely, and the adsorption capacity reached the maximum.30 When CAR reached 1
3, the carbons on the active sites could be reacted completely, and the adsorption capacity reached the maximum.30 When CAR reached 1![[thin space (1/6-em)]](https://www.rsc.org/images/entities/char_2009.gif) :
:![[thin space (1/6-em)]](https://www.rsc.org/images/entities/char_2009.gif) 4, the excessive KOH would promote vigorous gasification reaction, which destroys the carbon framework leading to a dramatic decrease of accessible area.31 Therefore, the adsorption amount of MB decreased. To further study the effect of CAR, the YLC-AC with different CAR were characterized by SEM, XRD and N2 adsorption–desorption.
4, the excessive KOH would promote vigorous gasification reaction, which destroys the carbon framework leading to a dramatic decrease of accessible area.31 Therefore, the adsorption amount of MB decreased. To further study the effect of CAR, the YLC-AC with different CAR were characterized by SEM, XRD and N2 adsorption–desorption.
Table 4 The effect of CAR on MB adsorption amount
| Samples |
MB adsorption amount (mg g−1) |
| YLC-AC-1 |
445.67 |
| YLC-AC-2 |
497.47 |
| YLC-AC-3 |
547.35 |
| YLC-AC-4 |
532.85 |
| SFC-AC-1 |
346.22 |
| SFC-AC-2 |
399.19 |
| SFC-AC-3 |
438.56 |
| SFC-AC-4 |
417.33 |
| XJC-AC-1 |
368.84 |
| XJC-AC-2 |
418.96 |
| XJC-AC-3 |
465.43 |
| XJC-AC-4 |
445.75 |
3.2.2. Surface morphology analysis. SEM images of the YLC-AC are shown in Fig. 7. After KOH activation, irregular surface with pores is observed on the obtained YLC-AC. The external surface of the YLC-AC-3 demonstrated a well pronounced pore structure than that of YLC-AC-1, YLC-AC-2 and YLC-AC-4, because the addition of KOH could enhance the pore development and create new pores during activation process.
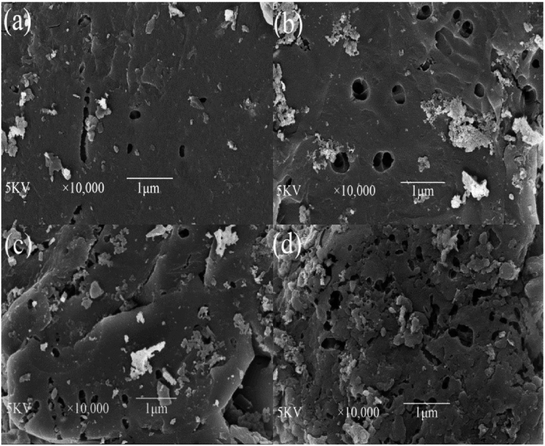 |
| | Fig. 7 SEM micrographs of (a) YLC-AC-1, (b) YLC-AC-2, (c) YLC-AC-3, (d) YLC-AC-4 selected at 10![[thin space (1/6-em)]](https://www.rsc.org/images/entities/char_2009.gif) 000× magnification. 000× magnification. | |
3.2.3. Crystal structure. XRD patterns of the YLC and YLC-AC are shown in Fig. 8. No obvious diffraction peak is observed on YLC. All the YLC-AC samples shows an obvious peaks at around 26°, attributed to the (002) reflections of the layered carbon structure (JCPDS no. 41-1487). The peaks at around 44° on YLC-AC-1, YLC-AC-2 and YLC-AC-4 could be attributed to the (100) reflections of disordered stacking of micrographites. An obvious peak at around 29° on YLC-AC-3 is the (002) reflections of the disordered stacking of micrographites.11
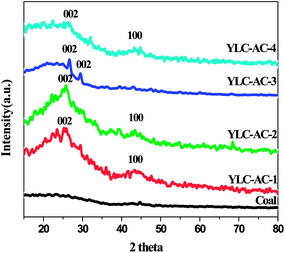 |
| | Fig. 8 XRD spectra of YLC, YLC-AC-1, YLC-AC-2, YLC-AC-3 and YLC-AC-4. | |
CACs with high surface areas are generally used for dyes adsorption because of their excellent efficiency. Table 6 summarized the adsorption capacity of MB on different CACs. The YLC-AC-3 prepared in this study showed a better adsorption capacity of MB than most reported CACs. To further investigated the adsorption behavior of YLC-AC-3, the adsorption kinetics and isotherm models were studied.
Table 6 Comparison of adsorption capacity of MB on different CACs
| Adsorbents |
Adsorption capacity (mg g−1) |
Temperature (°C) |
Initial concentration (mg L−1) |
Dosage (g L−1) |
References |
| Low-ranked lignite coal-based activated carbon |
61.3 |
30 |
50 |
0.5 |
21 |
| Thermal regeneration of spent coal-based activated carbon |
365.26 |
25 |
400 |
1 |
33 |
| Microwave assisted regeneration of spent coal based activated carbon |
380.39 |
25 |
400 |
1 |
34 |
| Bituminous coal-based activated carbon |
580 |
20 |
800 |
1 |
13 |
| Xinjiang–Kuche mine coal-based magnetic activated carbon |
871 |
25 |
200 |
0.2 |
14 |
| YLC-AC-3 |
547.35 |
25 |
550 |
1 |
This work |
3.3. Kinetics study of MB onto YLC-AC-3
To evaluate the adsorption behavior of MB on the surface of the YLC-AC-3, the experimental data at various contact time corresponding to adsorption amount of MB were fitted to four different kinetic models, including (i) pseudo-first order, (ii) pseudo-second order, (iii) intraparticle diffusion and (iv) Elovich models. They could be represented by the following equations.35| |
ln(Qe − Qt) = ln![[thin space (1/6-em)]](https://www.rsc.org/images/entities/char_2009.gif) Qe − K1t Qe − K1t
| (7) |
| |
 | (8) |
| |
 | (10) |
Kinetic models are used to examine the rate of the adsorption process and potential rate determining step, i.e., particle diffusion or chemical reaction.36 Theoretically, the pseudo-first order model assumes that the adsorption rate of dye uptake with time is directly proportional to the difference between amount of dye absorbed with time and amount of dye absorbed at equilibrium. The pseudo-second order model is based on the assumption that chemisorption is the model's rate-limiting step, and the adsorption mechanism depends on the adsorbate and adsorbent involving valence forces through the sharing or exchange of electrons.37,38 The intraparticle diffusion model is used to investigate rate controlling step during adsorption. The Elovich model is based on the assumption that the adsorption sites of the adsorbent are heterogeneous and displays a variety of activation energy during the adsorption process.39 The R2 and constant values were calculated and summarized in Table 7. Compared with other adsorption kinetic models, the R2 value for the pseudo-second order kinetic model is 0.9999 and the qe value (amount of dye adsorbed at equilibrium) was 549.45 mg g−1 which was close to that of experimental value (547.35 mg g−1), indicating the adsorption of MB onto the YLC-AC-3 follows the pseudo-second order kinetic model well.
Table 7 R2 and constant values for the different adsorption kinetic models
| Kinetic Models |
Parameters |
YLC-AC-3 |
| Pseudo-first order |
R2 |
0.7061 |
| qe,cal (mg g−1) |
290.56 |
| k1 (min−1) |
0.0407 |
| Pseudo-second order |
R2 |
0.9999 |
| qe,cal (mg g−1) |
549.45 |
| k2 (g mg−1 min−1) |
0.00182 |
| Intra-particle |
R2 |
0.9985 |
| kid1 (mg g−1 min−1/2) |
54.35 |
| R2 |
0.8723 |
| kid2 (mg g−1 min−1/2) |
1.220 |
| R2 |
0.9982 |
| kid3 (mg g−1 min−1/2) |
0.00249 |
| Elovich |
R2 |
0.5889 |
| β (g mg−1) |
0.04293 |
3.4. Adsorption isotherms study of MB onto YLC-AC-3
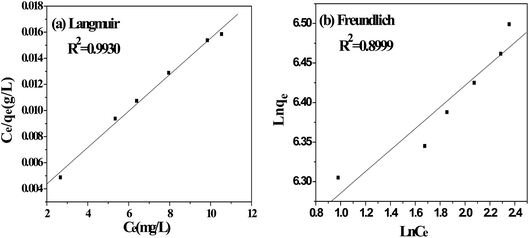
The adsorption isotherms are used to define characteristic of the adsorption process between liquid and solid phases at equilibrium state. The most accepted surface adsorption models of single solute systems for analyzing experimental adsorption equilibrium data are the Langmuir and Freundlich model. Thus, the adsorption isotherm studies were carried out by varying the initial concentration of MB from 550 mg L−1 to 700 mg L−1 to obtain the adsorption equilibrium data.
3.4.1. Langmuir isotherm. The Langmuir isotherm model is based on the assumption that the adsorption process is a monolayer adsorption on a homogeneous adsorbent surface, there is no interaction between adsorbed molecules and the binding sites are finite and have the identical sorption energies.40 The equation of Langmuir isotherm could be expressed as follows.| |
 | (11) |
where Ce (mg L−1) is dye concentration in liquid phase at equilibrium, Qe (mg g−1) is the equilibrium adsorption capacity, Qm (mg g−1) is the maximum amount of MB adsorbed and KL (L mg−1) is the Langmuir isotherm constant.
3.5. Regeneration performance
The regeneration of YLC-AC-3 was conducted up to five times. The results are shown in Fig. 10. The removal efficiency was 99.37% and 99.21% in the first two runs and decreased slightly to 98.87% and 98.21% in the fourth and fifth runs, respectively.
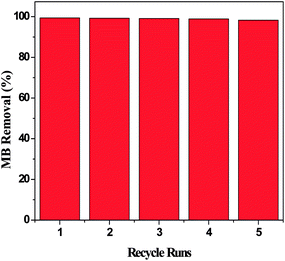 |
| | Fig. 10 The regeneration performance of the YLC-AC-3 for MB. | |
4. Conclusions
In this study, three kinds of coal with different ash and volatile matter content were chosen to prepare CACs. YLC-AC shows the better adsorption capacity of MB due to the high ash and volatile matter content in YLC. The effect of CAR on MB adsorption amount was also investigated. YLC-AC-3 exhibited a higher adsorption amount than other CACs due to the large surface area and pore volume. The adsorption kinetics of MB onto YLC-AC-3 was better described using a pseudo-second order model, it's proposed that the rate-limiting step is chemisorption. The adsorption behaviors fitted well to Langmuir isotherm model, the calculated adsorption capacity for MB is 714.29 mg g−1. And the removal efficiency remains 98.21% after five runs. Current study shows that CACs prepared by coal with high ash and volatile matter content could be a promising raw material in fast removal of MB from wastewater.
Conflicts of interest
There are no conflicts to declare.
Acknowledgements
This research was supported by the National Natural Science Foundation of China (Grant 21376004) and the Shaanxi Provincial Science and Technology Program (Grant 12JK0577).
References
- J. Z. Guo, B. Li, L. Liu and K. Lv, Chemosphere, 2014, 111, 225–231 CrossRef PubMed.
- S. C. Santos, V. J. Vilar and R. A. Boaventura, J. Hazard. Mater., 2008, 153, 999–1008 CrossRef PubMed.
- T. Robinson, G. Mcmullan, R. Marchant and P. Nigam, Bioresour. Technol., 2001, 77, 247–255 CrossRef PubMed.
- T. H. Liu, Y. H. Li, Q. J. Du, J. K. Sun, Y. Q. Jiao, G. M. Yang, Z. H. Wang, Y. Z. Xia, W. Zhang, K. L. Wang, H. W. Zhu and D. H. Wu, Colloids Surf., B, 2012, 90, 197–203 CrossRef PubMed.
- Y. Liu, J. J. Li, Y. Yang and B. P. Li, Appl. Surf. Sci., 2015, 351, 831–839 CrossRef.
- D. Pathania, S. Sharma and P. Singh, Arabian J. Chem., 2017, 10, S1445–S1451 CrossRef.
- M. A. M. Salleh, D. K. Mahmoud, A. W. A. K. Wan and A. Idris, Desalination, 2011, 280, 1–13 CrossRef.
- Ö. Gerçel, A. Özcan, A. S. Özcan and H. F. Gerçel, Appl. Surf. Sci., 2007, 253, 4843–4852 CrossRef.
- G. Karaçetin, S. Sivrikaya and M. Imamoğlu, J. Anal. Appl. Pyrolysis, 2014, 110, 270–276 CrossRef.
- Y. Y. Sun, H. Li, G. C. Li, B. Y. Gao, Q. Y. Yue and X. B. Li, Bioresour. Technol., 2016, 217, 239–244 CrossRef PubMed.
- X. M. Xiao, D. D. Liu, Y. J. Yan, Z. L. Wu, Z. S. Wu and G. Cravotto, J. Taiwan Inst. Chem. Eng., 2015, 53, 160–167 CrossRef.
- T. Kopac and A. Toprak, Int. J. Hydrogen Energy, 2007, 32, 5005–5014 CrossRef.
- E. N. El Qada, S. J. Allen and G. M. Walker, Chem. Eng. J., 2006, 124, 103–110 CrossRef.
- S. S. Gao, L. Liu, Y. K. Tang, D. Z. Jia, Z. B. Zhao and Y. Y. Wang, J. Porous Mater., 2016, 23, 877–884 CrossRef.
- X. H. Duan, C. Srinivasakannan and J. S. Liang, J. Taiwan Inst. Chem. Eng., 2014, 45, 1618–1627 CrossRef.
- D. Q. Li, X. F. Ma, J. Y. Yan, Z. S. Wu and Z. Y. Liu, J. Chem. Soc. Pak., 2015, 37, 1088–1098 Search PubMed.
- B. Jibril, R. S. Al-Maamari, O. Houache, M. Al-Aamri and A. M. Al-Qalhati, J. Appl. Sci. Res., 2007, 3, 1343–1351 Search PubMed.
- Y. Gao, S. P. Xu, Q. Y. Yue, Y. W. Wu and B. Y. Gao, J. Taiwan Inst. Chem. Eng., 2016, 61, 327–335 CrossRef.
- T. Kopac, E. Sulu and A. Toprak, Desalin. Water Treat., 2016, 57, 29007–29018 CrossRef.
- C. L. Lu, S. P. Xu, Y. X. Gan, S. Q. Liu and C. H. Liu, Carbon, 2005, 43, 2295–2301 CrossRef.
- B. Purevsuren, Y. H. Liou, Y. Davaajav, A. Ariunaa, S. Batbileg, B. Avid, S. Jargalmaa, Y. Huang and C. J. Lin, J. Chin. Inst. Eng., 2017, 40, 355–360 CrossRef.
- M. C. Tellez-Juárez, V. Fierro, W. Zhao, N. Fernández-Huerta, M. T. Izquierdo, E. Reguera and A. Celzard, Int. J. Hydrogen Energy, 2014, 39, 4996–5002 CrossRef.
- D. D. Liu, Z. S. Wu, X. Y. Ge, G. Cravotto, Z. L. Wu and Y. J. Yan, J. Taiwan Inst. Chem. Eng., 2016, 59, 563–568 CrossRef.
- C. Pelekani and V. L. Snoeyink, Carbon, 2000, 38, 1423–1436 CrossRef.
- M. J. Ahmed and S. K. Theydan, J. Anal. Appl. Pyrolysis, 2014, 105, 199–208 CrossRef.
- Y. B. Tang, Q. Liu and F. Y. Chen, Chem. Eng. J., 2012, 203, 19–24 CrossRef.
- G. Z. Gong, Q. Xie, Y. F. Zheng, S. F. Ye and Y. F. Chen, New Carbon Materials, 2009, 24, 141–146 CrossRef.
- D. Cuhadaroglu and O. A. Uygun, Afr. J. Biotechnol., 2008, 7, 3703–3710 Search PubMed.
- F. C. Wu, P. H. Wu, R. L. Tseng and R. S. Juang, J. Environ. Manage., 2010, 91, 1097–1102 CrossRef PubMed.
- W. Li, L. B. Zhang, J. H. Peng, N. Li and X. Y. Zhu, Ind. Crops Prod., 2008, 27, 341–347 CrossRef.
- K. Y. Foo and B. H. Hameed, Chem. Eng. J., 2012, 184, 57–65 CrossRef.
- W. G. Li, X. J. Gong, K. Wang, X. R. Zhang and W. B. Fan, Bioresour. Technol., 2014, 165, 166–173 CrossRef PubMed.
- X. H. Duan, C. S. Kannan, W. W. Qu, X. Wang, J. H. Peng, L. B. Zhang and H. Y. Xia, Color. Technol., 2012, 128, 464–472 Search PubMed.
- X. H. Duan, C. Srinivasakannan, W. W. Qu, X. Wang, J. H. Peng and L. B. Zhang, Chem. Eng. Process., 2012, 53, 53–62 CrossRef.
- T. Maneerung, J. Liew, Y. J. Dai, S. Kawi, C. Chong and C. H. Wang, Bioresour. Technol., 2016, 200, 350–359 CrossRef PubMed.
- X. M. Xiao, F. Tian, Y. J. Yan, Z. L. Wu, Z. S. Zhan and G. Cravotto, Korean J. Chem. Eng., 2015, 32, 1129–1136 CrossRef.
- F. Marrakchi, M. Auta, W. A. Khanday and B. H. Hameed, Powder Technol., 2017, 321, 428–434 CrossRef.
- W. Konicki, A. Hełminiak, W. Arabczyk and E. Mijowska, Chem. Eng. Res. Des., 2018, 129, 259–270 CrossRef.
- B. Acevedo, C. Barriocanal, I. Lupul and G. Gryglewicz, Fuel, 2015, 151, 83–90 CrossRef.
- L. Meng, X. F. Zhang, Y. S. Tang, K. H. Su and J. Kong, Sci. Rep., 2015, 5, 7910–7926 CrossRef PubMed.
- M. Ghaedi, A. G. Nasab, S. Khodadoust, M. Rajabi and S. Azizian, J. Ind. Eng. Chem., 2014, 20, 2317–2324 CrossRef.
|
| This journal is © The Royal Society of Chemistry 2018 |
Click here to see how this site uses Cookies. View our privacy policy here.  Open Access Article
 *
*
![[thin space (1/6-em)]](https://www.rsc.org/images/entities/char_2009.gif) :
:![[thin space (1/6-em)]](https://www.rsc.org/images/entities/char_2009.gif) 3. Adsorption kinetic models and isotherms were also studied in detail.
3. Adsorption kinetic models and isotherms were also studied in detail.![[thin space (1/6-em)]](https://www.rsc.org/images/entities/char_2009.gif) :
:![[thin space (1/6-em)]](https://www.rsc.org/images/entities/char_2009.gif) 1, 1
1, 1![[thin space (1/6-em)]](https://www.rsc.org/images/entities/char_2009.gif) :
:![[thin space (1/6-em)]](https://www.rsc.org/images/entities/char_2009.gif) 2, 1
2, 1![[thin space (1/6-em)]](https://www.rsc.org/images/entities/char_2009.gif) :
:![[thin space (1/6-em)]](https://www.rsc.org/images/entities/char_2009.gif) 3 and 1
3 and 1![[thin space (1/6-em)]](https://www.rsc.org/images/entities/char_2009.gif) :
:![[thin space (1/6-em)]](https://www.rsc.org/images/entities/char_2009.gif) 4 were named as YLC-AC-1, YLC-AC-2, YLC-AC-3 and YLC-AC-4. Other samples prepared by the same method were named as SFC-AC-1, SFC-AC-2, SFC-AC-3, SFC-AC-4, XJC-AC-1, XJC-AC-2, XJC-AC-3 and XJC-AC-4.
4 were named as YLC-AC-1, YLC-AC-2, YLC-AC-3 and YLC-AC-4. Other samples prepared by the same method were named as SFC-AC-1, SFC-AC-2, SFC-AC-3, SFC-AC-4, XJC-AC-1, XJC-AC-2, XJC-AC-3 and XJC-AC-4.
![[thin space (1/6-em)]](https://www.rsc.org/images/entities/char_2009.gif) 384.71
384.71![[thin space (1/6-em)]](https://www.rsc.org/images/entities/char_2009.gif) 402.31
402.31![[thin space (1/6-em)]](https://www.rsc.org/images/entities/char_2009.gif) sin
sin![[thin space (1/6-em)]](https://www.rsc.org/images/entities/char_2009.gif) θ = nλ, the plane spacing d (002) of diffraction crystal face (002) for SFC-AC-3 and XJC-AC-3 is relatively large, indicating that the turbostratic degree of the SFC-AC-3 and XJC-AC-3 is apparent.26
θ = nλ, the plane spacing d (002) of diffraction crystal face (002) for SFC-AC-3 and XJC-AC-3 is relatively large, indicating that the turbostratic degree of the SFC-AC-3 and XJC-AC-3 is apparent.26
![[thin space (1/6-em)]](https://www.rsc.org/images/entities/char_2009.gif) :
:![[thin space (1/6-em)]](https://www.rsc.org/images/entities/char_2009.gif) 1 to 1
1 to 1![[thin space (1/6-em)]](https://www.rsc.org/images/entities/char_2009.gif) :
:![[thin space (1/6-em)]](https://www.rsc.org/images/entities/char_2009.gif) 3 on YLC-AC, SFC-AC and XJC-AC, respectively. Wu et al. reported that increasing KOH amount could enhance the pore development and create new pores during activation process because with the rising ratio, more active sites could react with KOH.29 The activation reaction was strengthened and a large number of pores were formed with the rising ratio from 1
3 on YLC-AC, SFC-AC and XJC-AC, respectively. Wu et al. reported that increasing KOH amount could enhance the pore development and create new pores during activation process because with the rising ratio, more active sites could react with KOH.29 The activation reaction was strengthened and a large number of pores were formed with the rising ratio from 1![[thin space (1/6-em)]](https://www.rsc.org/images/entities/char_2009.gif) :
:![[thin space (1/6-em)]](https://www.rsc.org/images/entities/char_2009.gif) 1 to 1
1 to 1![[thin space (1/6-em)]](https://www.rsc.org/images/entities/char_2009.gif) :
:![[thin space (1/6-em)]](https://www.rsc.org/images/entities/char_2009.gif) 3, therefore the adsorption capacity increased due to the larger surface and pore volume. When CAR reached 1
3, therefore the adsorption capacity increased due to the larger surface and pore volume. When CAR reached 1![[thin space (1/6-em)]](https://www.rsc.org/images/entities/char_2009.gif) :
:![[thin space (1/6-em)]](https://www.rsc.org/images/entities/char_2009.gif) 3, the carbons on the active sites could be reacted completely, and the adsorption capacity reached the maximum.30 When CAR reached 1
3, the carbons on the active sites could be reacted completely, and the adsorption capacity reached the maximum.30 When CAR reached 1![[thin space (1/6-em)]](https://www.rsc.org/images/entities/char_2009.gif) :
:![[thin space (1/6-em)]](https://www.rsc.org/images/entities/char_2009.gif) 4, the excessive KOH would promote vigorous gasification reaction, which destroys the carbon framework leading to a dramatic decrease of accessible area.31 Therefore, the adsorption amount of MB decreased. To further study the effect of CAR, the YLC-AC with different CAR were characterized by SEM, XRD and N2 adsorption–desorption.
4, the excessive KOH would promote vigorous gasification reaction, which destroys the carbon framework leading to a dramatic decrease of accessible area.31 Therefore, the adsorption amount of MB decreased. To further study the effect of CAR, the YLC-AC with different CAR were characterized by SEM, XRD and N2 adsorption–desorption.
![[thin space (1/6-em)]](https://www.rsc.org/images/entities/char_2009.gif) :
:![[thin space (1/6-em)]](https://www.rsc.org/images/entities/char_2009.gif) 1 to 1
1 to 1![[thin space (1/6-em)]](https://www.rsc.org/images/entities/char_2009.gif) :
:![[thin space (1/6-em)]](https://www.rsc.org/images/entities/char_2009.gif) 3. And YLC-AC-3 demonstrated a well-developed porosity with a surface area of 1212.50 m2 g−1 and a total volume of 0.69 cm3 g−1. When the CAR increased from 1
3. And YLC-AC-3 demonstrated a well-developed porosity with a surface area of 1212.50 m2 g−1 and a total volume of 0.69 cm3 g−1. When the CAR increased from 1![[thin space (1/6-em)]](https://www.rsc.org/images/entities/char_2009.gif) :
:![[thin space (1/6-em)]](https://www.rsc.org/images/entities/char_2009.gif) 1 to 1
1 to 1![[thin space (1/6-em)]](https://www.rsc.org/images/entities/char_2009.gif) :
:![[thin space (1/6-em)]](https://www.rsc.org/images/entities/char_2009.gif) 3, the SBET and VT of CACs increased simultaneously from 941.67 m2 g−1 to 1212.50 m2 g−1 and 0.56 cm3 g−1 to 0.69 cm3 g−1. The SBET and VT of YLC-AC-4 decreased when the CAR reached 1
3, the SBET and VT of CACs increased simultaneously from 941.67 m2 g−1 to 1212.50 m2 g−1 and 0.56 cm3 g−1 to 0.69 cm3 g−1. The SBET and VT of YLC-AC-4 decreased when the CAR reached 1![[thin space (1/6-em)]](https://www.rsc.org/images/entities/char_2009.gif) :
:![[thin space (1/6-em)]](https://www.rsc.org/images/entities/char_2009.gif) 4.
4.![[thin space (1/6-em)]](https://www.rsc.org/images/entities/char_2009.gif) Qe − K1t
Qe − K1t


![[thin space (1/6-em)]](https://www.rsc.org/images/entities/char_2009.gif) Qe = ln
Qe = ln![[thin space (1/6-em)]](https://www.rsc.org/images/entities/char_2009.gif) KF + (1/n)ln
KF + (1/n)ln![[thin space (1/6-em)]](https://www.rsc.org/images/entities/char_2009.gif) Ce
Ce
