 Open Access Article
Efficiency difference between furan- and thiophene-based D–π–A dyes in DSSCs explained by theoretical calculations
Xingyi Jina,
Libo Suna,
Dongyuan Li*a,
Cheng-Long Wangb and
Fu-Quan Bai b
b
a1st Department of Neurosurgery, China-Japan Union Hospital, Jilin University, Xiantai Street No. 126, Changchun 130033, People's Republic of China. E-mail: dongyuan@jlu.edu.cn
bKey Laboratory of Theoretical and Computational Chemistry, International Joint Research Laboratory of Nano-Micro Architecture Chemistry, Institute of Theoretical Chemistry, Jilin University, Changchun 130023, People's Republic of China
First published on 23rd August 2018
Abstract
The performance of two donor–π-bridge–acceptor type phenothiazine dyes bearing different π-bridges (furan and thiophene) was investigated by density functional theory and time-dependent density functional theory to explore the reasons for the differences in DSSC efficiency. It was revealed that dye1 with furan showed higher short-circuit photocurrent density due to its larger driving force and better light harvesting efficiency compared with dye2. Moreover, a larger number of photo-injected electrons into TiO2 for dye1 leads to higher open-circuit photovoltage. Our results indicate that furan could be used as a promising π-bridge to improve the efficiency of PTZ dyes. We hope that our work can provide a theoretical basis and view for designing efficient dyes in dye-sensitized solar cells (DSSCs).
Introduction
Dye-sensitized solar cells (DSSCs) have garnered considerable attention due to their great advantages, such as light weight, low-cost, and easy processing, as well as colorful and transparent features.1–3 As one of the crucial parts in dye-sensitized solar cells, the photosensitizers including ruthenium complexes,4–6 porphyrins,7 and metal-free organic dyes8–13 have been designed and applied to DSSCs in the past decades. Although an overall power-conversion efficiency above 11% has been established with ruthenium-based sensitizers,14 the limited resources and the environmental issues related to ruthenium use make it necessary to seek alternative dyes. Organic dyes are one of the most widely studied sensitizers for DSSCs because of their high extinction coefficients and environmental effects.15 However, the low conversion efficiency limits their practical application in our daily life. In recent years, much effort has been devoted to overcome this bottleneck.16–19 Most of the reported organic dyes with high efficiencies depended on thiophene or thiophene-based heterocycles as the π-bridge, for example, coumarin–thiophene,20 carbazole–oligothiophene,21 and benzothiadizole–thiophene.22 These dyes show good stability because of the fact that holes in such dyes are located on the thiophene moieties. And furan, thiophene's oxygen analog, which has a high oxidation potential, would be more efficient for the holes location and reinforce the stability of the dye-sensitizers.21,23 However, furan has received much less attention compared to thiophene unit. Furan unit was incorporated into phenothiazine (PTZ) dye as an alternative to thiophene from 2011, showing better conversion efficiency than that containing thiophene unit.24 The similar experimental phenomena had also been reported by Hua et al. but again without deep understanding why the efficiency was improved.25 In current contribution, density functional theory (DFT) and time-dependent density functional theory (TD-DFT) were employed to explore the different performances of the dyes with respective furan and thiophene π-bridge.24 We hope the current contribution would provide theoretical guidance on optimizing the efficiency of existing donor–π bridge–acceptor (D–π–A) dyes or even designing new D–π–A dyes with better conversion efficiency.Theoretical background
The overall conversion efficiency η of solar cells is determined by the short-circuit photocurrent density Jsc, the open-circuit photovoltage Voc, the fill factor FF, and the intensity of the solar power Pin:
 | (1) |
In DSSCs, the Jsc is determined by the following equation:26
 | (2) |
• LHE(λ), the light harvesting efficiency (LHE) at the given wave-length λ;
• Φinj(λ), the electron injection efficiency at the given wave-length;
• ηcoll(λ), electron collection efficiency on the interface between dye and the semiconductor at the given wave-length.
In the similar DSSCs systems with only one difference part in the π-bridge fragment of the sensitizer, ηcoll(λ) could be assumed to be a constant due to the similar structure of the dye–semiconductor interface. As a result, for the enhancement of Jsc the strategy of research should focus on improving LHE and Φinj. The light harvesting efficiency of the dye in the whole UV-vis range could be evaluated by calculating the area of the absorption bands. Obviously, the larger area of the absorption bands, the better for the short-circuit photocurrent density. In principle, to make the electron transfer energetically, on the one hand, the redox potential of the dye in the excited state, Edye*, should be higher than conduction band of the semiconductor; on the other hand, the energetics of the excited states should be high enough to provide a thermodynamic driving force (Df) for charge injection, assuming injection takes place at or near the Frank–Condon region. Furthermore, we made the approximation that the energetics of the dye are not different whether it is in CH2Cl2 solution or attached to TiO2 film, which is supported by previous studies performed by Kuciauskas.27,28 The driving force, Df, can be expressed as29,30
 | (3) |
• Edye*, the redox potential of the excited dye;
• Edye, the redox potential of dye in ground state;
• λmax, the largest vertical transition energy;
• ECB, the conduction band edge of the semiconductor, which is sensitive to the conditions, and the experimental value −4.00 eV (vs. vacuum) is used widely.31
The DSSCs open-circuit photovoltage Voc is the difference of electronic potential between the quasi-Fermi level of the semiconductor under illumination and the redox potential of the electrolyte. We can calculate the Voc as:32
 | (4) |
 | (5) |
Computational details
The ground state of the isolated dyes was optimized at B3LYP/6-31G(d)34 level of theory in gas phase. Frequency calculations were performed at the same level of theory as the geometry optimizations to ensure that the ground state geometry corresponds to a minimum point on the potential energy surface. For TD-DFT calculations of isolated organic dyes in CH2Cl2, we evaluated several functional, including B3LYP,34 CAM-B3LYP,35 PBE0,36,37 BHandHLYP,38 and M062X,39 to screen out a proper exchange–correlation functional for current study. The conductor-like polarizable continuum model (C-PCM) was considered to simulate the solvent effects of dichloromethane. The results in Table 1 given by TD-M062X/6-31G(d) were in good agreement with the experimental values in terms of transition energies.24 The absorption spectra were afterwards simulated by using Gaussian function with full-width at half-maximum (FWHM) of 0.3 eV. The oxidation potential of the ground state was calculated by B3LYP/UB3LYP/6-31G(d) level of theory according to the Born–Haber cycle.28 For geometry optimization of TiO2 cluster and dye/TiO2 complexes, plane-wave DFT calculations were performed using projector augmented wave (PAW) pseudopotentials as implemented in the VASP package.39,40 These calculations were carried by using generalized gradient approximation (GGA) of Perdew–Burke–Ernzerhof41 to account for the exchange–correlation effects. After optimization, the adsorption energies (Eads) of dyes on TiO2 surface were calculated with the following equation:| Eads = Edye + ETiO2 − Edye+TiO2 | (6) |
| Functional | B3LYP | CAM-B3LYP | PBE0 | BHandHLYP | M062X | Exp24 |
|---|---|---|---|---|---|---|
| λmax/(nm) | 534 | 415 | 503 | 414 | 420 | 442 |
| f | 0.569 | 1.292 | 0.685 | 1.296 | 1.222 |
Results and discussion
The effect of different π-bridge on isolated dyes
To the dye molecules used in DSSCs, it is desirable to ensure that there exists a strong charge transport property and the electrons can be successively transferred to TiO2 along D–π–A direction. From the perspective of molecular structure, the dye molecules need to be a flat structure and have small distances between adjacent parts. The optimized ground-state geometries of the dye1 and dye2 are displayed in Fig. 1, and the important geometrical parameters are collected in Table 2. The dyes are constructed by phenothiazine donor moiety (D), furan or thiophene as π-bridge (π) and cyanoacrylic acid acceptor part (A).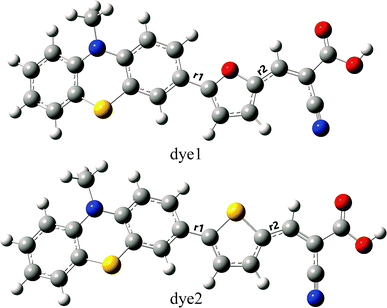 | ||
| Fig. 1 Optimized ground-state geometries with tagged bond lengths of dye1 and dye2 (C atom in grey; H atom in white; O atom in red; S atom in yellow; N atom in blue). | ||
| Molecule | D–π | π–A | ||
|---|---|---|---|---|
| r1 | Φ | r2 | Φ | |
| dye1 | 1.451 | 0.2 | 1.416 | 0.1 |
| dye2 | 1.461 | 22.3 | 1.426 | 0.9 |
In the D–π–A dyes, the π-bridge is expected to function as the bridge of intramolecular charge transfer (ICT).43,44 Therefore, the bridge bond between D and π-bridge or π-bridge and A has important effects on ICT. Herein, the bridge bonds between D and π-bridge, and π-bridge and A were marked as D–π and π–A, respectively. The shorter length of bridge bonds is more beneficial for ICT in the D–π–A dyes. As shown in Table 2, the values of D–π bond lengths of dye1 and dye2 are 1.451 and 1.461 Å, respectively, which implies the intensity of interaction between PTZ and π-bridge is in the order of furan > thiophene. On the other hand, the π–A bond lengths of dye1 and dye2 are 1.416 and 1.426 Å, which indicates that interaction of furan-A is stronger than that of thiophene-A. For dye2, the dihedral angle between donor and π-bridge was calculated to be 22.3°, and it becomes 0.2° in dye1. For these two dyes, the acceptor groups (A) were nearly coplanar with the π-bridge groups (π) as π–A dihedral angles were calculated to be 0.1° and 0.9° for dye1 and dye2, respectively. Considering above, dye1 may be more beneficial for ICT due to its shorter bridge bond lengths and flatter conjugated structure.
One of the important requirements for improving the efficiencies of dyes is to extend the cover of the absorption spectra. The calculated absorption spectra of both dyes are shown in Fig. 2, and the corresponding data is summarized in Table 3. The results are in agreement with experimental measurement and this method is best for simulating the absorption spectra in our calculations. Both of dyes evidently exhibit major absorption bands in the 420 nm region. Markedly, the absorption intensity of dye1 is higher a bit than the dye2. All the absorption peaks are contributed from the HOMO to LUMO or HOMO − 1 to LUMO transitions with the D–π–A direction. The integral area of the absorption bands for dye1 and dye2 are 128 and 117, respectively, revealing that dye1 has better LHE to dye2 over the almost same absorption region. Therefore, it can illustrate that the modification of π-bridge, by replacing thiophene with furan, has gradually enhancing effect in light harvesting efficiency (LHE).
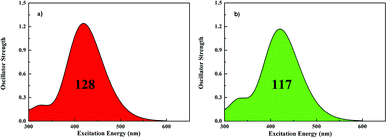 | ||
| Fig. 2 Simulated absorption spectra for dye1 (a) and dye2 (b) in CH2Cl2 solution (128 and 117 represent the area of absorption bands for dye1 and dye2 in the whole UV-vis region, respectively). | ||
| State | Composition (%) | λmax | f | λmax (exp with molar absorption coefficient)24 | |
|---|---|---|---|---|---|
| dye1 | S0 → S1 | H → L (82.5), H − 1 → L (11.8) | 420 | 1.222 | 442 (15![[thin space (1/6-em)]](https://www.rsc.org/images/entities/char_2009.gif) 100) 100) |
| dye2 | S0 → S1 | H → L (81.6), H − 1 → L (11.7) | 421 | 1.117 | 448 (16![[thin space (1/6-em)]](https://www.rsc.org/images/entities/char_2009.gif) 200) 200) |
Rapid and efficient electron injection after photo-excitation is also very important for improving the efficiency of the cell. Thereupon, the driving force (Df) was also studied in detail. The calculated Df as well as Edye and Edye* for both PTZ dyes are listed in Table 4. It can be found that electron injection efficiency (Φinj) increases along with higher Edye* and larger Df in dye1 in contrast to dye2, thus indicating that the injection of the electron from excited state of dye1 to the TiO2 is much easier than dye2. Notably, the change of thiophene to furan improved the LHE but also shifts the Df by 0.20 eV. Hence, considering the improved LHE and Φinj, it can be expected that the DSSCs based on dye1 should have minute intrinsic enhanced Jsc than dye2, and that is also reflected in the experimental results (12.18 vs. 12.05 mA cm−2 in Jsc measurement).24 These tiny changes have also recently been captured by experimental scientists and used in the design of more new D–π–A dye molecules,45,46 and now we have a clear theoretical cognition.
| Edye | λmax | Edye* | Df | μnormal | Δq | |
|---|---|---|---|---|---|---|
| dye1 | −5.07 | 2.95 | −2.21 | 1.88 | 2.68 | 0.129 |
| dye2 | −5.27 | 2.95 | −2.32 | 1.68 | 4.71 | 0.107 |
The effect of different π-bridge on dye–TiO2 complexes
The anatase (101) surface is the most active surface since it has unpassivated Ti and O atoms, which has been widely used to adsorb dyes for the interface investigation. To model the TiO2 nanoparticle surface, we considered a (TiO2)38 cluster, obtained by appropriately “cutting” from anatase slab exposing the majority (1 0 1) surface.47 The considered model represents a reasonable tradeoff between accuracy and computational convenience, and nicely reproduces the main electronic characteristics of TiO2 nanoparticles. We obtained HOMO–LUMO gap of 4.13 eV, while the TD-DFT lowest excitation energy of 3.63 eV is in agreement with the experimental spectrometric measurement. For the studied (TiO2)38 (101) model, the occupied MO can be attributed the contribution of 2p orbitals character of O atoms. While, the unoccupied MO can be attributed from the contribution of 3d orbitals of Ti atoms. These characters are in agreement with that of the understanding in TiO2 semiconductor material. Though HOMO–LUMO gap for this model is extended than the experimental band gap of crystal (3.2–3.3 eV),31 it corresponds well with previously calculated HOMO–LUMO gaps for other (TiO2)38 clusters.48–50 We used the plane-wave DFT to optimize the ground-state geometry of the (TiO2)38 cluster and dye/(TiO2)38 complex. The electronic structure and related results of the (TiO2)38 (101) model is reasonable and reliable for describing the conduction band properties of TiO2 semiconductor based on the both of accuracy and computational cost consideration.In dye/TiO2 adsorption model, organic dyes adsorbed on the TiO2 surface through the carboxylic group with several adsorption configurations owing to molecular or dissociative adsorption processes. The molecular adsorption is formed via hydrogen bonding between TiO2 surface and the dye. When the dissociative adsorption happens (H atom of carboxylic acid dissociates), the bond is formed between carboxylic oxygen atoms and the surface titanium of TiO2, which can be monodentate ester, bidentate chelating, and bidentate bridging types.51,52 However, Fourier-transform infrared spectroscopy (FTIR) results for organic systems in many experimental studies indicate that carboxylic acid usually adsorbs on TiO2 surface through bidentate bridging structure, which was most studied in the literature and was thought to be the most stable.52–54 Therefore, only bidentate bridging adsorption was considered in current study. This adopted TiO2 model well described the interface charge transfer and the most important thing is that the adsorbed dye on TiO2 via its carboxylate group in a bidentate bridging manner, with one proton transferred to a nearby surface oxygen has been proved to be the most stable adsorption mode for this anchoring group.
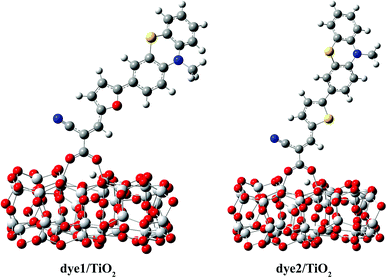
The optimized structures of dye/TiO2 complexes are shown in Fig. 3, and the important bond lengths and adsorption energies are listed in Table 3. The adsorption energy of dye1, calculated to be 22.9 kcal mol−1, is larger than that of dye2 (21.4 kcal mol−1) and both of them are large enough to allow the dyes to be adsorbed on the cluster in the chemical way. The bond lengths between Ti atoms and the carboxylic oxygen atoms were calculated to be 2.061 and 2.079 Å for dye1, 2.035 and 2.108 Å for dye2, respectively. The average Ti–O bond length of dye1/TiO2 is slightly shorter than that of dye2/TiO2, indicating somewhat stronger binding of dye1 with TiO2 cluster. Intuitively, one can indeed expect a stronger electronic coupling in the dye1/TiO2 system rather than dye2/TiO2 system (Table 5).
| O–Ti (1) | O–Ti (2) | Eads | |
|---|---|---|---|
| dye1/TiO2 | 2.061 | 2.079 | 22.9 |
| dye2/TiO2 | 2.035 | 2.108 | 21.4 |
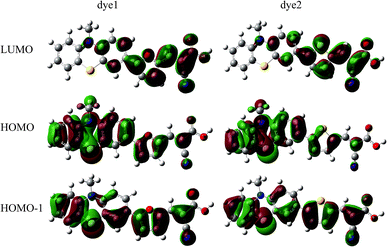
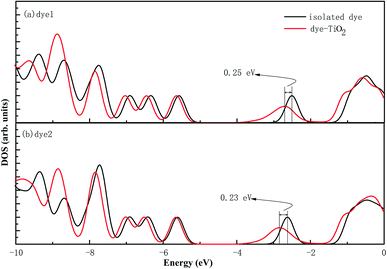
In the most of important excitations (in Table 3), the LUMO shows considerable involvement and has largest contribution at largest adsorption energy λmax. Hence, the electronic coupling between the dye's LUMO and TiO2 conduction band is important for electron injection from the former to the latter. To gain insight into the electronic coupling between the dye's LUMO and TiO2 conduction band and the electron-transfer features during photo excitation, the frontier molecular orbitals (FMO) of dye/TiO2 system were analyzed. HOMO, LUMO, and the interacting orbitals for dye1/TiO2 are shown in Fig. 4. The HOMO is localized on dye part of the complex as can be seen from Fig. 4(a), which is characteristically similar to that of the isolated dye. While, the LUMO is entirely localized on TiO2 part of the complex (Fig. 4(b)). The interacting LUMOs that have non-negligible contributions from the isolated free dye's LUMO are situated higher up in the conduction band (LUMO + 49). For dye2/TiO2 system, the FMOs features are similar to those of the dye1/TiO2 system. In DSSCs, the efficient electrons are transferred from donor through π-bridge to cyanoacrylate. Based on this, the spatial orientation of the FMOs for the isolated dye (shown in Fig. 5) and the dye/TiO2 interface here (shown in Fig. 4) are ideal conditions for DSSCs. Fig. 6 shows the density of states for dye1 and dye2 before and after adsorbing on TiO2 surface. From which we find that the HOMO of both dyes are almost unaffected by interaction with TiO2, showing the alignment of the energy levels as in the no-interacting case. The obvious difference between the isolated and interacting systems is in the shape and distribution of the LUMOs. Both of LUMOs of dyes adsorbed on TiO2 surface decrease due to the interaction with TiO2 semiconductor, and this is in agreement with previous reports of the perylene dye and TiO2 cluster.55 For dye1, the LUMO is 0.25 eV lower after absorbing on the TiO2 surface. While for dye2, the decrease of LUMO is calculated to be 0.23 eV, indicating slightly weaker electronic coupling to TiO2 surface than dye1. In case of similar molecular geometry when anchored to TiO2, the large stabilization to the LUMO will enhance the electronic coupling between the dye and the titanium 3d orbitals and favor the electron injection. The charge transfer states with direct charge injection character are performed by TD-DFT, and the results indicate that the absorption transitions of both adsorbed systems are bathochromic shifted near 500 nm, and the dye1/TiO2 is increasing 40 nm towards longer wavelength with higher intensity (oscillator strength 0.98 vs. 0.82) in contrast with dye2/TiO2. These results are also in concert with previous adsorption energy and binding strength values.
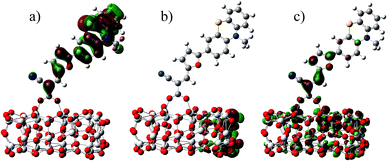 | ||
| Fig. 4 Some selected MO profiles for the HOMO (a), LUMO (b) and interaction orbital (c) of dye1/TiO2. | ||
Through eqn (5), the different dipole is expected to substantially influence the ECB of TiO2, which will lead to a change in open-circuit photovoltage Voc. Grätzel and coworkers have confirmed theoretically that the larger the dipole moment μnormal of the adsorbed molecules pointing outward from the semiconductor surface induced the larger Voc.56 Accordingly, μnormal of both dyes were calculated under B3LYP/6-31G(d) level including solvent effects at the geometry of dyes adsorbed on TiO2 and the results are listed in Table 4. It turns out that dye2 has much larger μnormal than dye1, thus it can be inferred that dye2 should have larger Voc than dye1. But this is not in line with the experiment results (734.6 and 706.6 mV for dye1 and dye2, respectively).24 According to eqn (4), we know that Voc also depends on the charge distribution in the semiconductor. As a result, we calculated the number of charge injected into the TiO2 conduction band Δq by means of natural population analysis (NPA) and the results are listed in Table 4. Dye1 has a larger Δq than dye2 (0.129e > 0.107e), which could shift the quasi-Fermi level of TiO2 accordingly, then lead to larger Voc. Therefore, we believe that the larger experimental Voc of dye1 is mostly ascribed to the more electrons transferred from dye1 to TiO2. Although the difference in Voc for dye1 and dye2 has been demonstrated, it needs to be pointed out that the Voc is also determined by other factors, such as electron lifetime. The relevant study is underway in our following work.
Conclusion
In summary, the geometries, electronic structures, absorption spectrum of two PTZ dyes with different π-bridges were investigated to gain insights into the effects of the π-bridge group of furan and thiophene on the performance of the dyes. The electrons in furan-containing dye could be more easily transferred from PTZ-donor to acceptor than that in thiophene-containing one due to the shorter bridge bonds and the flatter structure. After adsorption to the TiO2 cluster, as compared with dye2, dye1 shows a stronger coupling with the TiO2. dye1 with furan shows intrinsic enhanced short-circuit photocurrent density Jsc than dye2 with thiophene because it has larger driving force and comparable light harvesting efficiency, and the more electrons transferred from dye1 to TiO2 surface lead to larger open-circuit photovoltage Voc. Our results indicate that furan could be used as a promising π-bridge to improve the efficiency of PTZ dyes. We also hope our work will be helpful for designing more efficient PTZ dyes in DSSCs with reduced economical cost and synthesis effort.Conflicts of interest
There are no conflicts to declare.Acknowledgements
This work was supported by the Natural Science Foundation of China (Grant No. 21573088 and 21203071) and the Jilin Provincial Natural Science Foundation (Grant No. 201215031) and Young Scholar Training Program of Jilin University.Notes and references
- M. Grätzel, Acc. Chem. Res., 2009, 42, 1788–1798 CrossRef PubMed.
- A. Hagfeldt, G. Boschloo, L. Sun, L. Kloo and H. Pettersson, Chem. Rev., 2010, 110, 6595–6663 CrossRef PubMed.
- M. Xie, J. Wang, H.-Q. Xia, F.-Q. Bai, R. Jia, J.-G. Rim and H.-X. Zhang, RSC Adv., 2015, 5, 33653–33665 RSC.
- M. K. Nazeeruddin, A. Kay, I. Rodicio, R. Humphry-Baker, E. Mueller, P. Liska, N. Vlachopoulos and M. Grätzel, J. Am. Chem. Soc., 1993, 115, 6382–6390 CrossRef.
- C.-Y. Chen, S.-J. Wu, C.-G. Wu, J.-G. Chen and K.-C. Ho, Angew. Chem., 2006, 118, 5954–5957 CrossRef.
- L.-J. He, J. Chen, F.-Q. Bai, R. Jia, J. Wang and H.-X. Zhang, RSC Adv., 2016, 6, 81976–81982 RSC.
- L.-L. Li and E. W.-G. Diau, Chem. Soc. Rev., 2013, 42, 291–304 RSC.
- K. Hara, M. Kurashige, S. Ito, A. Shinpo, S. Suga, K. Sayama and H. Arakawa, Chem. Commun., 2003, 252–253 RSC.
- K. Hara, T. Sato, R. Katoh, A. Furube, T. Yoshihara, M. Murai, M. Kurashige, S. Ito, A. Shinpo, S. Suga and H. Arakawa, Adv. Funct. Mater., 2005, 15, 246–252 CrossRef.
- S. Ito, S. M. Zakeeruddin, R. Humphry-Baker, P. Liska, R. Charvet, P. Comte, M. K. Nazeeruddin, P. Pechy, M. Takata, H. Miura, S. Uchida and M. Grätzel, Adv. Mater., 2006, 18, 1202–1205 CrossRef.
- D. P. Hagberg, J.-H. Yum, H. Lee, F. De Angelis, T. Marinado, K. M. Karlsson, R. Humphry-Baker, L. Sun, A. Hagfeldt, M. Grätzel and M. K. Nazeeruddin, J. Am. Chem. Soc., 2008, 130, 6259–6266 CrossRef PubMed.
- W. Zhu, Y. Wu, S. Wang, W. Li, X. Li, J. Chen, Z.-S. Wang and H. Tian, Adv. Funct. Mater., 2011, 21, 756–763 CrossRef.
- M. Xie, J. Wang, F.-Q. Bai, L. Hao and H.-X. Zhang, Dyes Pigm., 2015, 120, 74–84 CrossRef.
- M. K. Nazeeruddin, F. De Angelis, S. Fantacci, A. Selloni, G. Viscardi, P. Liska, S. Ito, B. Takeru and M. Grätzel, J. Am. Chem. Soc., 2005, 127, 16835–16847 CrossRef PubMed.
- C. Xie, P. You, Z. Liu, L. Li and F. Yan, Light: Sci. Appl., 2017, 6, e17023 CrossRef.
- A. Mishra, M. K. R. Fischer and P. Bäuerle, Angew. Chem., Int. Ed., 2009, 48, 2474–2499 CrossRef PubMed.
- K. Hara, M. Kurashige, Y. Dan-oh, C. Kasada, A. Shinpo, S. Suga, K. Sayama and H. Arakawa, New J. Chem., 2003, 27, 783–785 RSC.
- C. Chen, X. Yang, M. Cheng, F. Zhang, J.-H. Zhao and L. Sun, ACS Appl. Mater. Interfaces, 2013, 5, 10960–10965 CrossRef PubMed.
- B. Park, S. H. Yun, C. Y. Cho, Y. C. Kim, J. C. Shin, H. G. Jeon, Y. H. Huh, I. Hwang, K. Y. Baik, Y. I. Lee, H. S. Uhm, G. S. Cho and E. H. Choi, Light: Sci. Appl., 2014, 3, e222 CrossRef.
- Z. S. Wang, Y. Cui, Y. Dan-oh, C. Kasada, A. Shinpo and K. Hara, J. Phys. Chem. C, 2008, 112, 17011–17017 CrossRef.
- R. Katoh, A. Furube, S. Mori, M. Miyashita, K. Sunahara, N. Koumura and K. Hara, Energy Environ. Sci., 2009, 2, 542–546 RSC.
- W. H. Zhu, Y. Z. Wu, S. T. Wang, W. Q. Li, X. Li, J. Chen, Z. S. Wang and H. Tian, Adv. Funct. Mater., 2011, 21, 756–763 CrossRef.
- U. H. F. Bunz, Angew. Chem., Int. Ed., 2010, 49, 5037–5040 CrossRef PubMed.
- S. H. Kim, H. W. Kim, C. Sakong, J. Namgoong, S. W. Park, M. J. Ko, C. H. Lee, W. I. Lee and J. P. Kim, Org. Lett., 2011, 13, 5784–5787 CrossRef PubMed.
- S. Qu, B. Wang, F. Guo, J. Li, W. Wu, C. Kong, Y. Long and J. Hua, Dyes Pigm., 2012, 92, 1384–1393 CrossRef.
- J. Zhang, H. B. Li, S. L. Sun, Y. Geng, Y. Wu and Z.-M. Su, J. Mater. Chem., 2012, 22, 568–576 RSC.
- D. Kuciauskas, J. E. Monat, R. Villahermosa, H. B. Gray, N. S. Lewis and J. K. McCusker, J. Phys. Chem. B, 2002, 106, 9347–9358 CrossRef.
- J. Wang, F. Q. Bai, B. H. Xia, L. Feng, H. X. Zhang and Q. J. Pan, Phys. Chem. Chem. Phys., 2011, 13, 2206–2213 RSC.
- R. Katoh, A. Furube, T. Yoshihara, K. Hara, G. Fujihashi, S. Takano, S. Murata, H. Arakawa and M. Tachiya, J. Phys. Chem. B, 2004, 108, 4818–4822 CrossRef.
- J. Feng, Y. Jiao, W. Ma, M. K. Nazeeruddin, M. Grätzel and S. Meng, J. Phys. Chem. C, 2013, 117, 3772–3778 CrossRef.
- M. Khoudiakov, A. R. Parise and B. S. Brunschwig, J. Am. Chem. Soc., 2003, 125, 4637–4642 CrossRef PubMed.
- T. Marinado, K. Nonomura, J. Nissfolk, M. K. Karlsson, D. P. Hagberg, L. Sun, S. Mori and A. Hagfeldt, Langmuir, 2009, 26, 2592–2598 CrossRef PubMed.
- S. Rühle, M. Greenshtein, S. G. Chen, A. Merson, H. Pizem, C. S. Sukenik, D. Cahen and A. Zaban, J. Phys. Chem. B, 2005, 109, 18907–18913 CrossRef PubMed.
- C. Lee, W. Yang and R. G. Parr, Phys. Rev. B, 1988, 37, 785–789 CrossRef.
- T. Yanai, D. P. Tew and N. C. Handy, Chem. Phys. Lett., 2004, 393, 51–57 CrossRef.
- C. Adamo and V. Barone, J. Chem. Phys., 1999, 110, 6158 CrossRef.
- A. D. Becke, J. Chem. Phys., 1993, 98, 1372–1377 CrossRef.
- Y. Zhao and D. G. Truhlar, Theor. Chem. Acc., 2008, 120, 215–241 Search PubMed.
- G. Kresse and J. Hafner, Phys. Rev. B, 1993, 47, 558–561 CrossRef.
- G. Kresse and J. Furthmüller, Comput. Mater. Sci., 1996, 6, 15–50 CrossRef.
- J. P. Perdew, K. Burke and M. Ernzerhof, Phys. Rev. Lett., 1996, 77, 3865–3868 CrossRef PubMed.
- G. W. T. M. J. Frisch, H. B. Schlegel, G. E. Scuseria, M. A. Robb, J. R. Cheeseman, G. Scalmani, V. Barone, B. Mennucci, G. A. Petersson, H. Nakatsuji, M. Caricato, X. Li, H. P. Hratchian, A. F. Izmaylov, J. Bloino, G. Zheng, J. L. Sonnenberg, M. Hada, M. Ehara, K. Toyota, R. Fukuda, J. Hasegawa, M. Ishida, T. Nakajima, Y. Honda, O. Kitao, H. Nakai, T. Vreven, J. A. Montgomery Jr., J. E. Peralta, F. Ogliaro, M. Bearpark, J. J. Heyd, E. Brothers, K. N. Kudin, V. N. Staroverov, R. Kobayashi, J. Normand, K. Raghavachari, A. Rendell, J. C. Burant, S. S. Iyengar, J. Tomasi, M. Cossi, N. Rega, J. M. Millam, M. Klene, J. E. Knox, J. B. Cross, V. Bakken, C. Adamo, J. Jaramillo, R. Gomperts, R. E. Stratmann, O. Yazyev, A. J. Austin, R. Cammi, C. Pomelli, J. W. Ochterski, R. L. Martin, K. Morokuma, V. G. Zakrzewski, G. A. Voth, P. Salvador, J. J. Dannenberg, S. Dapprich, A. D. Daniels, O. Farkas, J. B. Foresman, J. V. Ortiz, J. Cioslowski, and D. J. Fox, Gaussian 09, Revision D.01, Gaussian, Inc., Wallingford CT, 2009 Search PubMed.
- C. Teng, X. Yang, C. Yang, H. Tian, S. Li, X. Wang, A. Hagfeldt and L. Sun, J. Phys. Chem. C, 2010, 114, 11305–11313 CrossRef.
- H. Chen, H. Huang, X. Huang, J. N. Clifrord, A. Forneli, E. Palomares, X. Zheng, L. Zheng, X. Wang, P. Shen, B. Zhao and S. Tan, J. Phys. Chem. C, 2010, 114, 3280–3286 CrossRef.
- F. Li, Y.-Z. Zhu, S.-C. Zhang, H.-H. Gao, B. Pan and J.-Y. Zheng, Dyes Pigm., 2017, 139, 292–299 CrossRef.
- A. F. Buene, N. Uggerud, S. P. Economopoulos, O. R. Gautun and B. H. Hoff, Dyes Pigm., 2018, 151, 263–271 CrossRef.
- M. J. Lundqvist, M. Nilsing, P. Persson and S. Lunell, Int. J. Quantum Chem., 2006, 106, 3214–3234 CrossRef.
- S. Agrawal, P. Dev, N. J. English, K. R. Thampi and J. M. D. MacElroy, Chem. Sci., 2012, 3, 416 RSC.
- S. Agrawal, P. Dev, N. J. English, K. R. Thampi and J. M. D. MacElroy, J. Mater. Chem., 2011, 21, 11101 RSC.
- W. Li, F.-Q. Bai, J. Chen, J. Wang and H.-X. Zhang, J. Power Sources, 2015, 275, 207–216 CrossRef.
- A. Vittadini, A. Selloni, F. P. Rotzinger and M. Grätzel, J. Phys. Chem. B, 2000, 104, 1300–1306 CrossRef.
- M. K. Nazeeruddin, R. Humphry-Baker, P. Liska and M. Gratzel, J. Phys. Chem. B, 2003, 107, 8981–8987 CrossRef.
- K. Srinivas, K. Yesudas, K. Bhanuprakash, V. J. Rao and L. Giribabu, J. Phys. Chem. C, 2009, 113, 20117–20126 CrossRef.
- K. Hara, T. Sato, R. Katoh, A. Furube, Y. Ohga, A. Shinpo, S. Suga, K. Sayama, H. Sugihara and H. Arakawa, J. Phys. Chem. B, 2003, 107, 597–606 CrossRef.
- F. De Angelis, Chem. Phys. Lett., 2010, 493, 323–327 CrossRef.
- P. Chen, J. H. Yum, F. D. Angelis, E. Mosconi, S. Fantacci, S.-J. Moon, R. H. Baker, J. Ko, M. K. Nazeeruddin and M. Grätzel, Nano Lett., 2009, 9, 2487–2492 CrossRef PubMed.
| This journal is © The Royal Society of Chemistry 2018 |

