 Open Access Article
Uncovering the rupture mechanism of carbon nanotube filled cis-1,4-polybutadiene via molecular dynamics simulation†
Xiuying Zhaoa,
Tiantian Lia,
Lan Huang c,
Bin Lid,
Jun Liu
 a,
Yangyang Gao
 *ab and
Liqun Zhang
 *ab
*ab
aKey Laboratory of Beijing City on Preparation and Processing of Novel Polymer Materials, Beijing University of Chemical Technology, 10029, People's Republic of China. E-mail: zhanglq@mail.buct.edu.cn; gaoyy@mail.buct.edu.cn
bState Key Laboratory of Organic–Inorganic Composites, Beijing University of Chemical Technology, 10029, People's Republic of China
cDepartment of Materials Science and Engineering, Texas A&M University, College Station, Texas 77843-3003, USA
dCAS Key Laboratory of Nanosystem and Hierarchial Fabrication, CAS Center for Excellence in Nanoscience, National Center for Nanoscience and Technology, Beijing 100190, P. R. China
First published on 3rd August 2018
Abstract
In this work, by employing molecular dynamics simulations in a united atomistic resolution, we explored the rupture mechanism of carbon nanotube (CNT) filled cis-1,4-polybutadiene (PB) nanocomposites. We observed that the rupture resistance capability increases with the interfacial interaction between PB and CNTs, as well as the loading of CNTs, attributed to the enhanced chain orientation along the deformed direction to sustain the external force, particularly those near voids. The number of voids is quantified as a function of the strain, exhibiting a non-monotonic behavior because of the coalescence of small voids into larger ones at high strain. However, the number of voids is greatly reduced by stronger PB–CNT interaction and higher loading of CNTs. During the rupture process, the maximum van der Waals energy change reflects the maximum conformational transition rate and the largest number of voids. Meanwhile, the strain at the maximum orientation degree of bonds is roughly consistent with that at the maximum square radius of gyration of chains. After the failure, the stress gradually decreases with the strain, accompanied by the contraction of the highly orientated polymer bundles. In particular, with weak interfacial interaction, the nucleation of voids occurs in the interface, and in the polymer matrix in the strong case. In general, this work could provide some fundamental understanding of the voids occurring in polymer nanocomposites (PNCs), with the aim to design and fabricate high performance PNCs.
1. Introduction
It is important to reinforce polymer nanocomposites (PNCs) for industrial applications, which can be achieved by adding the nanoparticles (NPs) (such as carbon black (CB) or carbon nanotubes (CNTs)) into the polymer matrix.1–3 In general, the functionalization of NPs is necessary to enhance their compatibility with the matrix, which can help to disperse the NPs in the polymer matrix.4 The mechanical reinforcement depends on structural parameters such as the shape, size and volume fraction of NPs, the physical and chemical interactions between the NPs and polymer, and so on.During the fracture process, nanovoids first appear, then grow to form a microcavity, and finally the materials break. Therefore, it can be distinguished that the creation and growth processes of nanovoids are key steps in the study of the rupture mechanism. Recently, intensive experimental3,5–8 and simulation9–25 studies have been devoted to address this fundamental issue. For instance, the development of crazes is found to depend on the kinetics of local plastic deformation by examining the fracture toughness of homogeneous glassy polymers.6 Meanwhile, the evolution process of the NP distribution state in glassy PNCs is revealed during the rupture process: alignment of NPs along the pre-craze, expulsion of NPs from craze fibrils of the pre-craze, and NP entrapment among craze fibrils in the mature craze.5 Recently, by using small-angle X-ray scattering analysis, the nanovoids of size larger than a few microns can be observed in the CB filled polymer nanocomposites. However, the voids under the uniaxial deformation has not been obtained.3 In fact, the size of the initial voids is smaller than a few tens of nanometers, which is too difficult to be detected in experiments. Computer simulation provides another good option for studying the rupture behavior. For example, by employing molecular dynamics simulation, the energy dissipation during the rupture process can be roughly divided into three types: cavitation, plastic yield and bridge rupture.25 The failure in glassy polymers intend to occur in regions of high chain ends density21 or the low elastic modulus.16 In addition, Voronoi volume can be used to anticipate void formation and predict the failure in rods filled PNCs.26 By investigating the failure modes in glassy polymer films confined between two solid surfaces, three modes of failures (few cavities, many single bridges, one large bridge) are found, which depends on the degree of confinement.13 Similarly, two modes of failures (adhesive and cohesive) are revealed, which comes from the interplay of polymer–polymer and polymer–wall interactions.22 By tuning the size and shape of NPs, the rod-like NPs can better resist against the cavity growth, which effectively enhance the mechanical property of PNCs, especially at high aspect ratio.11 In the regime of the optimal NP dispersion and attractive interfacial interactions, the small NPs (namely large surface area) can reinforce the mechanical properties, leading to much tougher PNCs.12 In the grafted NPs filled PNCs, the void nucleation is mainly affected by the interaction between NPs and grafted polymer, rather than the interaction between grafted polymer and free polymer.27 In addition, the broad distribution of the tensile force in glassy polymers has important implications for fibril breakdown and the ultimate strength of craze.28 The high mobility of the small NPs can dissipate the deformation energy and reinforce PNCs, which can achieve a better resistance against the deformation via an improved release of local tension.23,29 However, the reinforcement is nearly independent of the mass of NPs, which is expected to affect the NP mobility.11 In fact, the role of the NP dynamics on the reinforcement mechanism is still debated.12,15 At strong polymer–NP interaction, NPs can act as the temporary cross-linking bonds, thus creating a polymer–NP network to improve the mechanical properties.19,20 In addition, the effects of the cross-linking density,17 the NP dispersion,10 the interfacial bond density24 and the polymer entanglement9,18 on the tensile failure have been investigated.
However, based on the above works, a fundamental understanding of the rupture mechanism has not been clearly identified yet, which deserves to be further investigated. To uncover the rupture mechanism, it is very important to understand the generation and the evolution process of the nanovoids during the rupture process, which are still not well known. Thus, in this work, by adopting the united-atom model,30 we performed the uniaxial deformation to investigate the rupture behavior of CNT filled cis-1,4-polybutadiene nanocomposites at the microscopic level. Change of the microstructure (the number and the maximum size of voids, the orientation degree of bonds, the radius of gyration of chains, dynamics and energy) is analyzed in details with respect to the strain. We focused on the following two questions: (1) how the polymer–CNT interaction and the mass fraction of CNT influence the rupture property and the microstructures (including the evolution process of voids) during the tensile process; (2) where the nucleation of voids preferentially occurs.
2. Model and simulation details
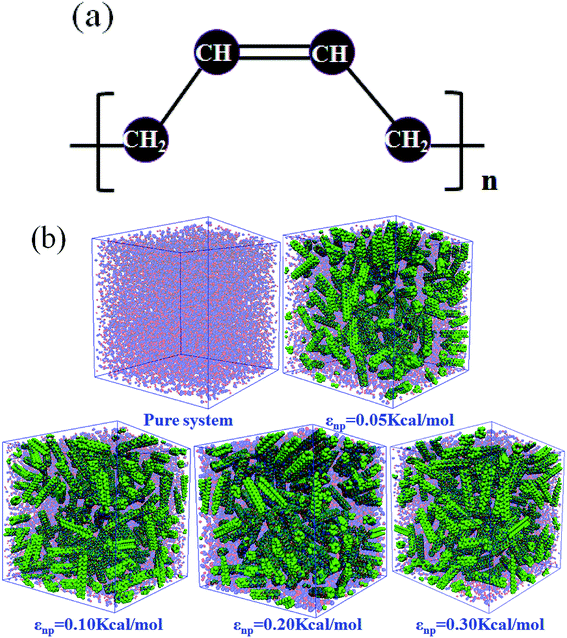
In this work, we adopted the united-atom model30 to represent the cis-1,4-polybutadiene (PB) chains, according to which each carbon atom in a monomer together with all hydrogen atoms attached to it is considered as a single Lennard-Jones interaction site in Fig. 1(a). It is noted that the density of polymer depends on the chain length. When the number of units of each chain is larger than 25, the density becomes almost constant.31 Based on this, we chose 25 units for the modeled cis-PB polymer chain. Because of the limitation of computational power, the number of chains in the simulation box is 300. The length of the chosen (3, 3) CNT is 2.5 nm, which has been synthesized in experiment32 and adopted in the previously published simulation work.33 The mass fraction of CNT is defined as the ratio of CNT mass to the total mass, which varies from 0% to 41.6% in our system. This mass fraction is actually larger than the experiment's value (16 wt%).34 We mainly considered that the high mass fraction of CNT can reinforce the stress at the same strain during the deformation, which can better distinguish the difference for systems with different PB–CNT interactions. Meanwhile, we speculated that it will not change the results when the relatively low mass fraction of CNT is used. As the mass fraction of CNT increases from 0% to 41.6%, the length of the simulation box with periodic boundary conditions in three directions rises from 9.3 nm to 9.7 nm. We adopted the force–field parameters from the simulation work carried out by Tsolou et al.30 which are summarized in Table SI.† The potential functions of bond stretching, bond angle bending, and torsion angle can be found in the published work.30 The standard Lennard-Jones potential is used to describe the non-bonded interaction, as shown below:
 | (1) |
Following our recently published work,35–37 all the chains and the CNTs are placed into a large simulation box. Then, we adopted the NPT ensemble to compress the system for 30 ns, where the temperature and the pressure are fixed at T = 650 K and P = 1 atm, respectively by using the Nose–Hoover thermostat and barostat. Next, the systems are equilibrated at T = 650 K for 150 ns under NVT ensemble. Then, the systems are cooling down to the target temperature (T = 300 K) by reducing T by 5 K every 1 ns.38 Further equilibration under NVT ensemble with T = 300 K is performed for 100 ns. It is noted that each chain has moved at least 2Rg during the whole simulation process, where Rg is the root mean square radius of gyration of chains. Periodic boundary conditions are employed in all three directions. The velocity-Verlet algorithm is applied to integrate the equations of motion with a timestep of δt = 1 fs. Currently, to simulate the fracture behavior, there exist two typical approaches. One is to clamp polymer chains using two rigid walls.11,13,39 Periodic boundary conditions are applied in the lateral two directions of the walls. The polymer is subjected to a pure tensile strain to induce the failure by fixing the bottom wall and moving the top wall away from the bottom one. The other one is the tri-axial deformation to induce the failure, namely the simulation box is extended in one direction, while the other two dimensions are held fixed, which results in a positive effective stress in all directions.40,41 In this case, there is no rigid walls. Periodic boundary conditions are applied in three directions. We adopted the latter approach to induce the occurrence of the voids.40,41 The uniaxial tensile tests are performed by stretching the simulation box along one direction at a constant strain velocity (1010 S−1 adopted by the previously published works42–44) while keeping the box length unchanged in other two directions. Meanwhile, the average stress–strain curve is obtained by independently deforming each system along x, y and z directions, respectively. All MD runs are carried out by using the large scale atomic/molecular massively parallel simulator (LAMMPS), which is developed by Sandia National Laboratories.45
To characterize the generation and the evolution process of the nanovoids during the rupture process, we first introduced the method on defining the number and positions of voids: as shown in Fig. S1,† the periodic box first is divided into cubic sub-cells of size Δ. Then we checked whether the center positions of PB beads or CNT beads are within these small sub-cells. If no beads of any type are within sub-cells, these sub-cells are unoccupied and considered to be voids (denoted by the black sub-cells as an example). Thus, the position of voids can be obtained. In addition, the unoccupied sub-cells are assigned to the same void when they share a common face (such as a and b in Fig. S1†). As a result, the number of voids can be calculated. The maximum void size is defined as the number of sub-cell within the maximum void. In our simulation, Δ of the sub-cell is 6.0 Å, ensuring that there are no voids in the unstrained system. The volume of a void can be compared with that of a bead. Our method is similar to that by Sixou.21
3. Results and discussion
3.1 Effect of polybutadiene–carbon nanotube interaction
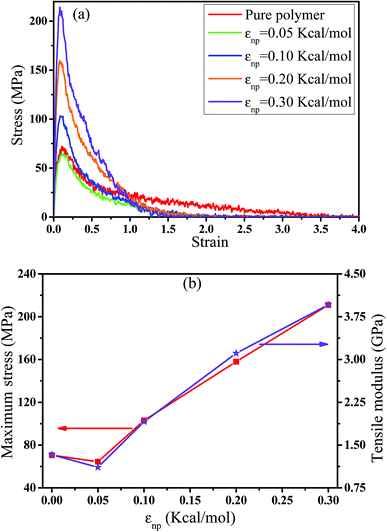
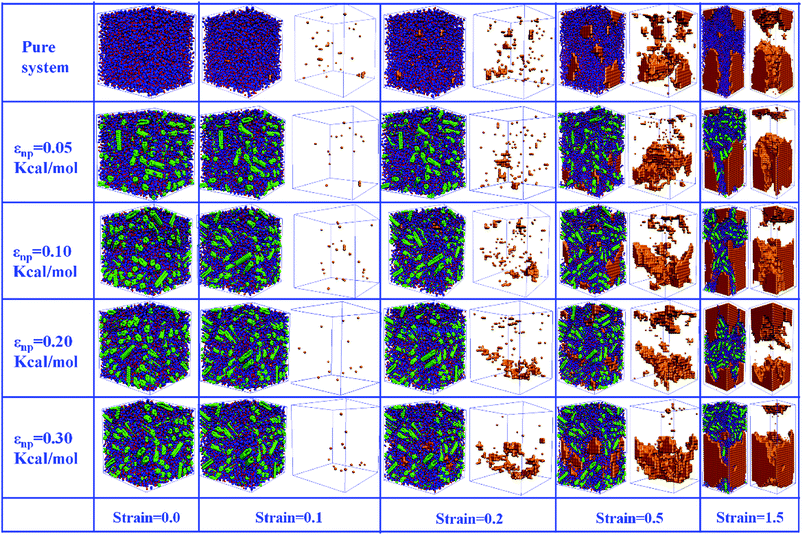
In this part, we mainly investigated the effect of the PB–CNT interaction on the rupture behavior by tuning εnp from 0.05 kcal mol−1 to 0.30 kcal mol−1, which simulates different functionalization extents of CNT. The number of CNTs is 150, which is corresponding to the mass fraction f ≈ 34.8%. Fig. 1(b) presents the snapshots of pure system and PNCs with different εnp, which indicates that the dispersion state of CNTs is relatively uniform in the polymer matrix. Then, we performed the tensile deformation to analyze the change in the structure and energy inside the system during the rupture process. The stress–strain curves are calculated with respect to the strain for different systems in Fig. 2(a). For all the curves, the stress first gradually increases and reaches a maximum value with the increase of the strain. Then, the stress immediately drops because the initial small voids coalesce into big voids in the matrix. Finally, the materials undergo the mechanical failure and a large void is formed in the matrix. The strain at the maximum stress is about 0.1. In addition, the strong interaction can enhance the tensile stress during the deformation process, offering a better resistance to cavity growth. The stress at large strain = 2.0 does not decrease to 0.0 for pure system because pure system is more mechanically homogenous and deforms as a whole.46 Then, we calculated the maximum stress and the tensile modulus (the initial slope of the stress–strain curves) in Fig. 2(b). At weak interaction εnp = 0.05 kcal mol−1 (less than εpp = 0.10 kcal mol−1), the reinforcing effect is not exhibited, which is reflected by the low maximum stress and the low tensile modulus. At strong interaction εnp, the reinforcing effect can be achieved. For example, the maximum stress and the tensile modulus for εnp = 0.30 kcal mol−1 are nearly two times larger than those for the pure system. To better understand the rupture process of materials, we characterized the evolution process of the voids as a function of strain. Fig. 3 presents the change of the number of voids and the maximum void size with the increase of the strain. In addition, the snapshots corresponding to some typical strains are shown to better understand the rupture process in Fig. 4. From Fig. 3 and 4, at the initial state (strain = 0.0), there are no voids in the matrix. Then, the single void forms at strain <0.1, which is reflected by the maximum void size equal to 1 (it means the biggest void only contains one sub-cell) in Fig. 3(b). At the strain >0.1, the small voids coalesce into big voids, which leads to the significant increase of the maximum void size. This transition strain (=0.1) is actually corresponding to that at the maximum stress in Fig. 2(a). It indicates that all the small voids are isolated before the maximum stress. Once two small voids are merged into one, the stress begins to decline. With the increase of strain, these isolated voids enlarge and more voids are generated. Thus, the number of voids gradually rises to the maximum value for different systems. With further increasing strain, more small voids coalesce into big voids, which leads to the decrease of the number of voids. At large strain, the big void ultimately leads to the breakage of materials. The strain at the maximum number of voids gradually decreases from 0.27 to 0.14 with increasing εnp. This is due to a more mechanically heterogeneous environment, which induces earlier void formations.26 In addition, it is interesting to find that high εnp increases the number of voids at any strain. To understand it, for pure system, during the deformation, all polymer chains take part in the deformation process to sustain the external force, which leads to a homogeneous distribution of the local stress.47 Thus, the initial voids can appear at any position of the simulation box at strain (<0.1), which leads to more small voids in the matrix. However, with addition of CNTs into the polymer matrix, the distribution of the local stress becomes heterogeneous.48 Thus, the initial voids are formed in the local weak regions rather than all regions, which lead to less voids. Then, we probed the position where the nucleation of voids occurs. If the initial single voids can “meet” the CNT beads within the distance 6.5 Å (≈1.5σ), these initial single voids are considered to generate at the PB–CNT interface. Otherwise, they generate in the matrix. Fig. 5 presents the number ratio of the voids which generate at the PB–CNT interface or in the matrix to the total voids. If the number ratio of the voids which generate at the PB–CNT interface to the total voids is 1.0, it indicates that all the initial small voids appear at the interface. Otherwise, they appear in the matrix. From Fig. 5, most of the initial voids appear at the interface for the weak interaction εnp = 0.05 kcal mol−1, which can be reflected by the high ratio of the voids which generate at the interface. With the increase of εnp, the initial voids intend to generate in the matrix. This is mainly because of the low interface strength at weak εnp, and then it is enhanced with increasing εnp. Thus, the nucleation of voids upon deformation occurs preferentially in the weak region.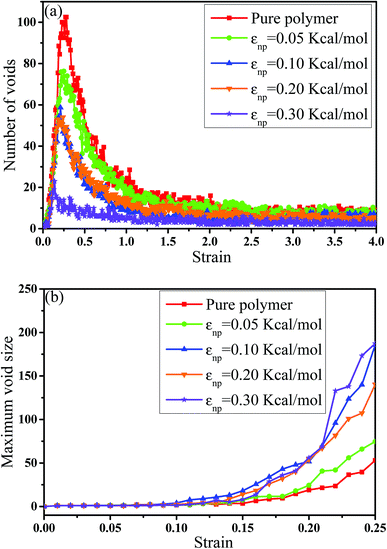 | ||
| Fig. 3 (a) The number of voids and (b) the maximum void size as a function of the strain for pure system and the carbon nanotube filled systems with different interactions εnp. | ||
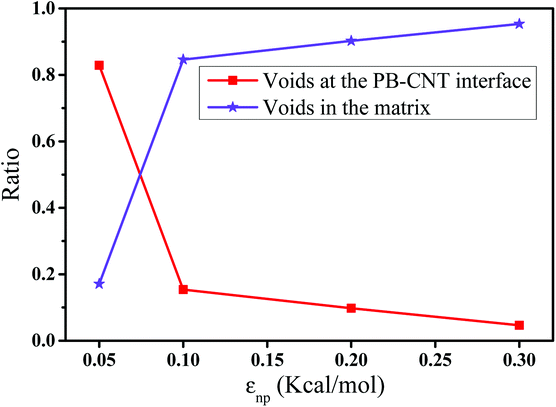 | ||
| Fig. 5 The number ratio of the voids which generate at the polybutadiene (PB)–carbon nanotube (CNT) interface or in the matrix to the total voids with respect to the interaction εnp. | ||
Then, we analyzed the variation of the van der Waals (vdW) energy change and the average number of neighbor PB beads per CNT bead (CNnp) with respect to the strain in Fig. S2.† It is noted that the vdW energy dominates the rupture process because the bond, angle and dihedral energies are roughly constant since bonds, angles and torsions cannot break in our model. The average number of neighbor PB beads per CNT bead is calculated within a distance of L = 2.5σ. As the increase of strain, an extreme value of CNnp appears at the strain ≈ 0.12–0.35 for different systems, which is roughly corresponding to the strain at the maximum number of voids. This indicates that accompanied by the appearance of voids, the PB chains are first stretched along the tensile direction. Then, more small voids coalesce into big voids, leading to the decrease of the number of voids. At this strain, some chains begin to contract and pack closely. As a result, their transition strains are roughly consistent. Furthermore, the second-order Legendre polynomials 〈P2〉 is used to denote the PB bond orientation degree at different strains: 〈P2〉 = (3〈![[thin space (1/6-em)]](https://www.rsc.org/images/entities/char_2009.gif) cos2
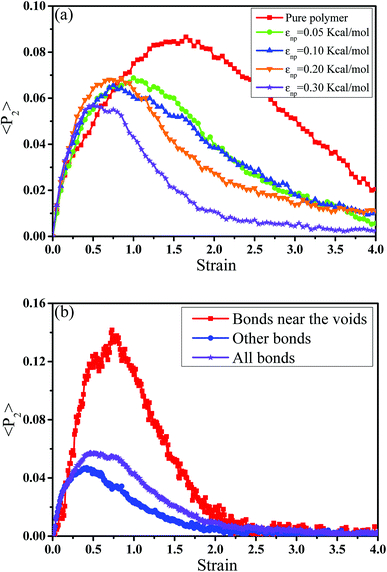
cos2![[thin space (1/6-em)]](https://www.rsc.org/images/entities/char_2009.gif) θ 〉 −1)/2, where θ denotes the angle between the bond vector and the tensile direction.49 Fig. 6(a) shows 〈P2〉 of the bonds as a function of strain. At strain = 0.0, the bonds exhibit a random distribution. Then, 〈P2〉 first increases at small strain. Accompanied by the contraction of the PB chains at large strain, 〈P2〉 declines. Strong interaction εnp can enhance 〈P2〉 at small strain, while weak interaction εnp can enhance 〈P2〉 at high strain. Moreover, Fig. 6(b) shows 〈P2〉 for all bonds, the bonds near the voids and other bonds at εnp = 0.30 kcal mol−1 as an example. It is found that the bonds near the voids exhibit a stronger orientation than the other bonds. As the voids are widen, the polymer chains near the voids flow along the tensile direction, which causes a significant increase of the orientation. According to these results, for the pure system, the voids appear homogeneously in the matrix. Thus, there are more bonds surrounding the voids, which lead to high orientation. On the contrary, PNCs are heterogeneous. The voids mainly appear in the weak region, which leads to less voids. As a result, the number of bonds surrounding the voids becomes less, which leads to a low orientation at large strain. In addition, Fig. S3†(a) presents the density distribution of the PB beads along the tensile direction at strain = 0.5. For the pure system, the density distribution along the tensile direction is relatively uniform, conforming that more chains take part in the deformation and the system deforms as a whole. With the increase of εnp, the density is very low at the position of 0.2, which means a big void. This indicates that only a few chains take part in the deformation, which leads to a low stretchability. Thus, the strain at the maximum 〈P2〉 gradually decreases from 1.5 to 0.5 with increasing εnp in Fig. 6(a). Then, we calculated the root mean square radius of gyration of chains Rg, which denotes the average size of the chains. From Fig. S3†(b), Rg first increases due to the stretching of polymers, then reaches a maximum, and finally decreases where chains begin to contract. The transition strains of Rg and 〈P2〉 with respect to the strain are similar, where materials are going to completely rupture from the snapshots in Fig. 4 (a very big void). In order to further investigate the mobility with the strain, we calculated the conformational transition rate, which is defined: K = Ntran/Nφt where Ntran is the number of transitions within the simulation time t (here, 12 ps), Nφ is the total number of the torsion angle φ3 in the system.50 A transition is counted when a torsion rotates from the bottom of a well to another one by crossing the transition state. The shade domains in the torsion energy profile denote the transition state in Fig. S4(a).† Here, two widths of the transition state Wbarrier are examined, namely (±20° (shallow jump) and ±40° (deep jump)). Their trends are similar. Thus, we presented K (strain)/K (strain = 0.0) for the deep jump in Fig. S4(b),† which is the ratio of the conformational transition rate at some strain to that at the strain = 0.0. Similarly, K (strain)/K (strain = 0.0) first increases due to the deformation of chains. Then it declines because of the contraction of chains, which is consistent with the previous results. This may indicate that the mobility is integral to the ability of the polymer to accommodate deformation, which has a close relationship with the evolution process of voids.51 Last, we intended to quantify the contribution of PB chains and CNTs to the total stress, respectively. Here, two systems are chosen with the weak interaction εnp = 0.05 kcal mol−1 and the strong interaction 0.30 kcal mol−1. If each bead bears the same stress, most stress will be borne by PB chains because the number of PB beads is 1.67 times as many as that of CNT beads. From Fig. 7, at the weak interaction εnp = 0.05 kcal mol−1, most of the stress are borne by the PB chains. However, at the strong interaction εnp = 0.30 kcal mol−1, on the contrary most of the stress are borne by the CNTs. This is because the stress is very difficult to transfer from the PB matrix to the CNT at weak interaction, which can be enhanced by strong interaction. In summary, the strong interfacial interaction leads to a heterogeneous structure. Meanwhile it enhances the stress transfer, which helps to resist the void growth.
θ 〉 −1)/2, where θ denotes the angle between the bond vector and the tensile direction.49 Fig. 6(a) shows 〈P2〉 of the bonds as a function of strain. At strain = 0.0, the bonds exhibit a random distribution. Then, 〈P2〉 first increases at small strain. Accompanied by the contraction of the PB chains at large strain, 〈P2〉 declines. Strong interaction εnp can enhance 〈P2〉 at small strain, while weak interaction εnp can enhance 〈P2〉 at high strain. Moreover, Fig. 6(b) shows 〈P2〉 for all bonds, the bonds near the voids and other bonds at εnp = 0.30 kcal mol−1 as an example. It is found that the bonds near the voids exhibit a stronger orientation than the other bonds. As the voids are widen, the polymer chains near the voids flow along the tensile direction, which causes a significant increase of the orientation. According to these results, for the pure system, the voids appear homogeneously in the matrix. Thus, there are more bonds surrounding the voids, which lead to high orientation. On the contrary, PNCs are heterogeneous. The voids mainly appear in the weak region, which leads to less voids. As a result, the number of bonds surrounding the voids becomes less, which leads to a low orientation at large strain. In addition, Fig. S3†(a) presents the density distribution of the PB beads along the tensile direction at strain = 0.5. For the pure system, the density distribution along the tensile direction is relatively uniform, conforming that more chains take part in the deformation and the system deforms as a whole. With the increase of εnp, the density is very low at the position of 0.2, which means a big void. This indicates that only a few chains take part in the deformation, which leads to a low stretchability. Thus, the strain at the maximum 〈P2〉 gradually decreases from 1.5 to 0.5 with increasing εnp in Fig. 6(a). Then, we calculated the root mean square radius of gyration of chains Rg, which denotes the average size of the chains. From Fig. S3†(b), Rg first increases due to the stretching of polymers, then reaches a maximum, and finally decreases where chains begin to contract. The transition strains of Rg and 〈P2〉 with respect to the strain are similar, where materials are going to completely rupture from the snapshots in Fig. 4 (a very big void). In order to further investigate the mobility with the strain, we calculated the conformational transition rate, which is defined: K = Ntran/Nφt where Ntran is the number of transitions within the simulation time t (here, 12 ps), Nφ is the total number of the torsion angle φ3 in the system.50 A transition is counted when a torsion rotates from the bottom of a well to another one by crossing the transition state. The shade domains in the torsion energy profile denote the transition state in Fig. S4(a).† Here, two widths of the transition state Wbarrier are examined, namely (±20° (shallow jump) and ±40° (deep jump)). Their trends are similar. Thus, we presented K (strain)/K (strain = 0.0) for the deep jump in Fig. S4(b),† which is the ratio of the conformational transition rate at some strain to that at the strain = 0.0. Similarly, K (strain)/K (strain = 0.0) first increases due to the deformation of chains. Then it declines because of the contraction of chains, which is consistent with the previous results. This may indicate that the mobility is integral to the ability of the polymer to accommodate deformation, which has a close relationship with the evolution process of voids.51 Last, we intended to quantify the contribution of PB chains and CNTs to the total stress, respectively. Here, two systems are chosen with the weak interaction εnp = 0.05 kcal mol−1 and the strong interaction 0.30 kcal mol−1. If each bead bears the same stress, most stress will be borne by PB chains because the number of PB beads is 1.67 times as many as that of CNT beads. From Fig. 7, at the weak interaction εnp = 0.05 kcal mol−1, most of the stress are borne by the PB chains. However, at the strong interaction εnp = 0.30 kcal mol−1, on the contrary most of the stress are borne by the CNTs. This is because the stress is very difficult to transfer from the PB matrix to the CNT at weak interaction, which can be enhanced by strong interaction. In summary, the strong interfacial interaction leads to a heterogeneous structure. Meanwhile it enhances the stress transfer, which helps to resist the void growth.
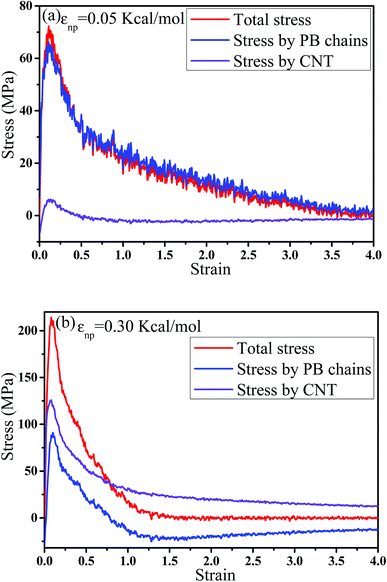 | ||
| Fig. 7 The contribution of polybutadiene (PB) chains and carbon nanotube (CNT) to the total stress at two interactions (a)εnp = 0.05 kcal mol−1 and (b) εnp = 0.30 kcal mol−1. | ||
3.2 Effect of the mass fraction of carbon nanotubes
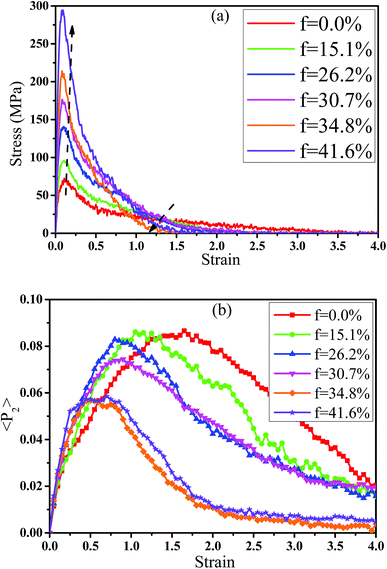
In fact, the high mass fraction of fillers is necessary for the industrial application, which will significantly affect the mechanical property of PNCs.34,52–54 Thus, in this section we intended to investigate the effect of the mass fraction of CNT on the rupture behavior of PNCs. The PB–CNT interaction is set to be the strong interfacial interaction εnp = 0.30 kcal mol−1. The number of CNTs rises from 0, 50, 100, 125, 150 to 200, which is corresponding to the mass fraction of CNT f from 0%, 15.1%, 26.2%, 30.7%, 34.8% to 41.6%, respectively. Fig. S5† presents the snapshots of pure system and PNCs with different mass fractions of CNTs, where the CNTs disperse uniformly in the PB matrix. The stress–strain curves for different f are shown in Fig. 8(a). Similarly, the stress first increases and then decreases with the increase of the strain for all the systems. Meanwhile, we found that with the increase of f from 0% to 41.6%, the maximum stress increases from 70.53 MPa to 292 MPa and the tensile modulus increases from 1.33 GPa to 5.1 GPa, which is shown in Fig. S6.† At high mass fraction of CNT, the polymer chains can be absorbed on the surface of CNTs, which can act as the temporary cross-linking bonds. As a result, the strong polymer–NP network can improve the mechanical properties.19,20 Thus, high f can enhance the stress at small strain (<1.0). However, high f reduces the stress at large strain (>1.0), which is marked by the black arrow in Fig. 8(a). To explain it, we characterized the orientation degree 〈P2〉 of the bonds in Fig. 8(b) and the number of voids in Fig. 9 with respect to the strain for diffident mass fractions f. At the small strain (<0.4), the orientation degree 〈P2〉 of the bonds gradually increases with the f, which is responsible for the gradual increase of the stress. However, at large strain (>0.4) the orientation degree 〈P2〉 of the bonds decreases with the f, which is consistent with the decrease of the stress. For pure system, because of the homogeneous distribution of the local stress,46 the initial voids can appear at any position of the simulation box, which leads to more voids in the matrix. Meanwhile, the bonds near the voids exhibit a stronger orientation than the other bonds. Thus, more polymer chains surrounding the voids are stretched along the tensile direction to sustain the external force. With the increase of the mass fraction of CNT f, the initial voids are formed in the local weak regions rather than all regions, which lead to less voids. Thus, the number of chains surrounding the voids becomes less with the f, which reduces the orientation degree 〈P2〉 of the bonds at high strain. Fig. 9 presents that the number of voids becomes less with the increase of the fat all strains, which proves the above explanation. Meanwhile, from the stress–strain curves in Fig. 8(a), PNCs fracture at lower strain than pure polymer, which induces the contraction of the chains. This is also responsible for the low orientation degree 〈P2〉 at large strain. In total, our results clearly present the effect of the mass fraction of CNT on the rupture behavior of PNCs.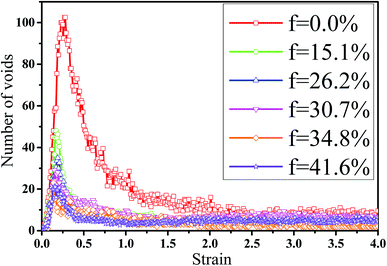 | ||
| Fig. 9 The number of voids as a function of the strain for pure system and the carbon nanotube (CNT) filled systems with different mass fractions of CNT (f). | ||
4. Conclusions
In this work we explored the rupture mechanism of carbon nanotubes (CNTs) filled cis-1,4-polybutadiene (PB) nanocomposites (PNCs) via a united atom model of molecular dynamics simulation. By calculating the stress–strain curves, the tensile modulus and the maximum stress can be gradually enhanced with the increase of the PB-CNT interaction and the mass fraction of CNT. This can be explained by the enhanced chain orientation along the deformed direction to sustain the external force, particularly those nearby the voids. During the rupture process, the strain at the maximum orientation degree of bonds gradually decreases with the increase of the PB–CNT interaction and the mass fraction of CNT. Consistent with the stress–strain curves, the number of voids exhibits a non-monotonic behavior with the strain because of the coalescence of small voids into larger ones at high strain. However, the number of the voids is greatly reduced by stronger PB–CNTs interaction and higher loading of CNTs. With the increase of strain, the maximum van der Waals energy change reflects the maximum conformational transition rate and the largest number of voids. Meanwhile, the strain at the maximum orientation degree of bonds is roughly consistent with that at the maximum square radius of gyration of chains. After the failure, the stress gradually decreases with the strain, accompanied by the contraction of the highly orientated polymer bundles. In addition, at weak interfacial interaction, the nucleation of voids occurs in the interface and the main stress is borne by polymer chains. However, it occurs in the polymer matrix at strong case and the main stress is borne by the CNTs. In summary, this work presents a further understanding of the evolution process of the voids for the CNT filled PB nanocomposites during the tensile deformation.Conflicts of interest
There are no conflicts to declare.Acknowledgements
The authors acknowledge financial supports from the National Natural Science Foundation of China (21704003), National 973 Basic Research Program of China 2015CB654700(2015CB654704), the financial support from the National Natural Science Foundation of China (Grant No. 51521062), the start-up funding of Beijing University of Chemical Technology for excellent introduced talents (buctrc201710), and the Fundamental Research Funds for the Central Universities (JD1811), and supported by CHEMCLOUDCOMPUTING of Beijing University of Chemical Technology are both greatly appreciated.References
- M. Rahmat and P. Hubert, Compos. Sci. Technol., 2011, 72, 72–84 CrossRef.
- D. R. Paul and L. M. Robeson, Polymer, 2008, 49, 3187–3204 CrossRef.
- H. Zhang, A. K. Scholz, J. D. Crevoisier, F. Vionloisel, G. Besnard, A. Hexemer, H. R. Brown, E. J. Kramer and C. Creton, Macromolecules, 2017, 45, 1529–1543 CrossRef.
- C. Chevigny, F. Dalmas, E. D. Cola, D. Gigmes, D. Bertin, F. Boué and J. Jestin, Macromolecules, 2011, 44, 122–133 CrossRef.
- J. Y. Lee, Q. Zhang, A. Todd Emrick and A. J. Crosby, Macromolecules, 2006, 39, 7392–7396 CrossRef.
- R. Estevez, M. G. A. Tijssens and E. V. D. Giessen, J. Mech. Phys. Solids, 2000, 48, 2585–2617 CrossRef.
- R. Bagheri and R. A. Pearson, Polymer, 1996, 37, 4529–4538 CrossRef.
- E. J. Kramer and L. L. Berger, Fundamental processes of craze growth and fracture, Berlin, Heidelberg, 1990 Search PubMed.
- T. Ge, C. Tzoumanekas, S. D. Anogiannakis, R. S. Hoy and M. O. Robbins, Macromolecules, 2016, 50, 459–471 CrossRef.
- S. F. Ferdous, M. F. Sarker and A. Adnan, Polymer, 2013, 54, 2565–2576 CrossRef.
- A. Kutvonen, G. Rossi, S. R. Puisto, N. K. Rostedt and T. Alanissila, J. Chem. Phys., 2012, 137, 214901 CrossRef PubMed.
- A. Kutvonen, G. Rossi and T. Ala-Nissila, Phys. Rev. E: Stat., Nonlinear, Soft Phys. Rev. E: Stat., Nonlinear, Soft Matter Phys., 2012, 85, 041803 CrossRef PubMed.
- V. A. Froltsov, M. Klüppel and G. Raos, Phys. Rev. E: Stat., Nonlinear, Soft Phys. Rev. E: Stat., Nonlinear, Soft Matter Phys., 2012, 86, 041801 CrossRef PubMed.
- Toepperwein and N. Gregory, Macromolecules, 2011, 44, 5498 CrossRef.
- M. Mu, M. E. Seitz, N. Clarke, R. J. Composto and K. I. Winey, Macromolecules, 2011, 44, 191–193 CrossRef.
- A. Makke, M. Perez, J. Rottler, O. Lame and J. L. Barrat, Macromol. Theory Simul., 2011, 20, 826–836 CrossRef.
- M. Panico, S. Narayanan and L. C. Brinson, Modelling Simul. Mater. Sci. Eng., 2010, 18, 055005 CrossRef.
- D. K. Mahajan, B. Singh and S. Basu, Phys. Rev. E: Stat., Nonlinear, Soft Phys. Rev. E: Stat., Nonlinear, Soft Matter Phys., 2010, 82, 011803 CrossRef PubMed.
- R. A. Riggleman, G. N. Toepperwein, G. J. Papakonstantopoulos and J. J. D. Pablo, Macromolecules, 2009, 42, 3632–3640 CrossRef.
- N. Lacevic, R. H. Gee, A. Saab and R. Maxwell, J. Chem. Phys., 2008, 129, 328 CrossRef PubMed.
- B. Sixou, Mol. Simul., 2007, 33, 965–973 CrossRef.
- U. Kulmi and S. Basu, Modell. Simul. Mater. Sci. Eng., 2006, 14, 1071 CrossRef.
- D. Gersappe, Phys. Rev. Lett., 2002, 89, 058301 CrossRef PubMed.
- M. J. Stevens, Macromolecules, 2001, 34, 2710–2718 CrossRef.
- M. O. Robbins, Science, 1996, 271, 482–484 CrossRef.
- G. N. Toepperwein and J. J. D. Pablo, Macromolecules, 2011, 44, 5498–5509 CrossRef.
- D. Meng, S. K. Kumar, T. Ge, M. O. Robbins and G. S. Grest, J. Chem. Phys., 2016, 145, 094902 CrossRef PubMed.
- J. Rottler and M. O. Robbins, Phys. Rev. Lett., 2002, 89, 195501 CrossRef PubMed.
- E. Jaber, H. Luo, W. Li and D. Gersappe, Soft Matter, 2011, 7, 3852–3860 RSC.
- G. Tsolou, V. G. Mavrantzas and D. N. Theodorou, Macromolecules, 2005, 38, 233–238 CrossRef.
- Z. Zheng, J. Shen, J. Liu, Y. Wu, L. Zhang and W. Wang, RSC Adv., 2016, 6, 28666–28678 RSC.
- L. Guan, A. Kazu Suenaga and S. Iijima, Nano Lett., 2008, 8, 459 CrossRef PubMed.
- K. S. Khare, F. Khabaz and R. Khare, ACS Appl. Mater. Interfaces, 2014, 6, 6098 CrossRef PubMed.
- F. Li, Y. Lu, L. Liu, L. Zhang, J. Dai and J. Ma, Polymer, 2013, 54, 2158–2165 CrossRef.
- Y. Y. Gao, F. Y. Hu, J. Liu and Z. Wang, Chin. J. Polym. Sci., 2018, 36, 1–10 CrossRef.
- Y. Gao and F. Müller-Plathe, Polymer, 2017, 129, 228–234 CrossRef.
- Y. Gao and F. Müllerplathe, J. Phys. Chem. C, 2017, 122, 1412–1421 CrossRef.
- K. Binder, J. Baschnagel and W. Paul, Prog. Polym. Sci., 2003, 28, 115–172 CrossRef.
- Pablo and J. J. De, Macromolecules, 2001, 34, 4200 CrossRef.
- D. Meng, S. K. Kumar, T. Ge, M. O. Robbins and G. S. Grest, J. Chem. Phys., 2016, 145, 094902 CrossRef PubMed.
- R. Estevez and D. Long, Modell. Simul. Mater. Sci. Eng., 2011, 19, 045004 CrossRef.
- R. Mohammad, I.-C. Irene, G. Azadeh, C. B. Michael and M.-P. Florian, Nanotechnology, 2012, 23, 305702 CrossRef PubMed.
- Y. Gao and F. Müller-Plathe, J. Phys. Chem. C, 2018, 122, 1412–1421 CrossRef.
- D. Hossain, M. A. Tschopp, D. K. Ward, J. L. Bouvard, P. Wang and M. F. Horstemeyer, Polymer, 2010, 51, 6071–6083 CrossRef.
- K. Kremer and G. S. Grest, J. Chem. Phys., 1990, 92, 5057–5086 CrossRef.
- G. N. Toepperwein, R. A. Riggleman and J. J. D. Pablo, Macromolecules, 2012, 45, 543–554 CrossRef.
- K. Yoshimoto, G. J. Papakonstantopoulos, J. F. Lutsko and J. J. D. Pablo, Phys. Rev. B, 2005, 71, 184108 CrossRef.
- K. Yoshimoto, T. S. Jain, W. K. Van, P. F. Nealey and J. J. de Pablo, Phys. Rev. Lett., 2004, 93, 175501 CrossRef PubMed.
- M. Rahimi, I. Iriarte-Carretero, A. Ghanbari, M. C. Böhm and F. Müller-Plathe, Nanotechnology, 2012, 23, 305702 CrossRef PubMed.
- T. Liang, Y. Yang, D. Guo and X. Yang, J. Chem. Phys., 2000, 112, 2016–2020 CrossRef.
- F. M. Capaldi, M. C. Boyce and G. C. Rutledge, Phys. Rev. Lett., 2002, 89, 175505 CrossRef PubMed.
- Z. Wang, J. Liu, S. Wu, W. Wang and L. Zhang, Phys. Chem. Chem. Phys., 2010, 12, 3014–3030 RSC.
- S. Merabia, P. Sotta and D. R. Long, Macromolecules, 2008, 41, 8252–8266 CrossRef.
- L. Bokobza and B. Erman, Macromolecules, 2000, 33, 8858–8864 CrossRef.
Footnote |
| † Electronic supplementary information (ESI) available. See DOI: 10.1039/c8ra04469d |
| This journal is © The Royal Society of Chemistry 2018 |

