 Open Access Article
Structural, magnetic and electronic properties of CrO2 at multimegabar pressures
Shengxuan Huang a,
Xiang Wu*b,
Jingjing Niua and
Shan Qina
aKey Laboratory of Orogenic Belts and Crustal Evolution, MOE, School of Earth and Space Sciences, Peking University, Beijing 100871, P. R. China
bState Key Laboratory of Geological Processes and Mineral Resources, China University of Geosciences, Wuhan, 430074, P. R. China. E-mail: wuxiang@cug.edu.cn
First published on 9th July 2018
Abstract
As the only half-metallic ferromagnetic material in 3d transition metal dioxides, CrO2 has attracted great scientific interest from materials science to physical chemistry. Here, an investigation into the structural, magnetic and electronic properties of CrO2 under high pressure has been conducted by first-principles calculations based on density functional theory. Static calculations have predicted that CrO2 undergoes structural transitions with the sequence of rutile-type → CaCl2-type → pyrite-type → Pnma → (Fe2P-type→) I4/mmm at high pressures. In addition, a transition from the ferromagnetic state to the non-magnetic state with the magnetic collapse of Cr is observed in CrO2 at the pyrite–Pnma transition. This transition also delocalizes the 3d electrons of Cr and leads to a metallic character of CrO2. The equation of state, elasticity and band gap for each energetically favorable phase of CrO2 are determined. Our results not only bridge the gap about the high-pressure behavior of CrO2 in previous studies but also extend our understanding of its properties up to multimegabar conditions. According to previous data and present results, we further discuss and summarize the high-pressure behavior of various AO2 compounds. This can contribute to investigating properties of other AO2 compounds or exploring novel materials at high pressures.
1. Introduction
The high-pressure behavior of AO2 compounds, especially transition metal dioxides such as TiO2, VO2, CrO2 and FeO2, has attracted considerable interest in the field of materials science, condensed matter physics and geoscience.1–10 For example, as a very important technological wide-gap semiconductor widely applied in photo-catalysts and electrochemical solar cells,1,3 the band gap of TiO2 can be modified by pressure, which extends its application in the industry.11–13 The possibility to quench high-pressure forms of AO2 compounds with different properties to ambient conditions is also potentially important to explore novel materials.14 In addition, pressure-induced structural and electronic transitions of the simple compound VO2 provide a good example to deeply understand and interpret the complicated Mott-like metal–insulator transition.15,16 On the other hand, pressure-induced phase transitions of transition metal dioxides can serve as lower-pressure analogs to SiO2, a critical component in the Earth's interior, especially when investigating ultrahigh-pressure polymorphs of SiO2 in super-Earths’ or extrasolar planets' interiors.17–20In particular, CrO2 attracts special interest since it is the only half-metallic (HM) ferromagnetic (FM) material in 3d transition metal dioxides. At ambient conditions, CrO2 adopts the tetragonal rutile-type structure consisting of distorted edge-sharing CrO6 octahedra similar to other transition metal dioxides [Fig. 1(a)]. Due to the crystal field of distorted CrO6 octahedra, Cr t2g states are split into dxy with lower energy and dyz–dxz with higher energy. The double-exchange interaction between the localized 3d electron occupying the dxy state and the delocalized 3d electron occupying half of the dyz–dxz state near the Fermi level accounts for its HM and FM nature. The previous Andreev reflection experiment demonstrated that the spin polarization of the conduction electrons was more than 90%.21 The saturation magnetization at 10 K was experimentally determined to be 1.92 μB per Cr.22 Compared with other half-metals, the FM CrO2 possesses a high Curie temperature of 390 K, which is also of technological importance to develop spintronic devices.23 It is thus evident that these intriguing technological applications are associated with the structural, magnetic and electronic configurations of CrO2. The properties are originated from the arrangement and interaction of electrons of CrO2 within a typical structure.
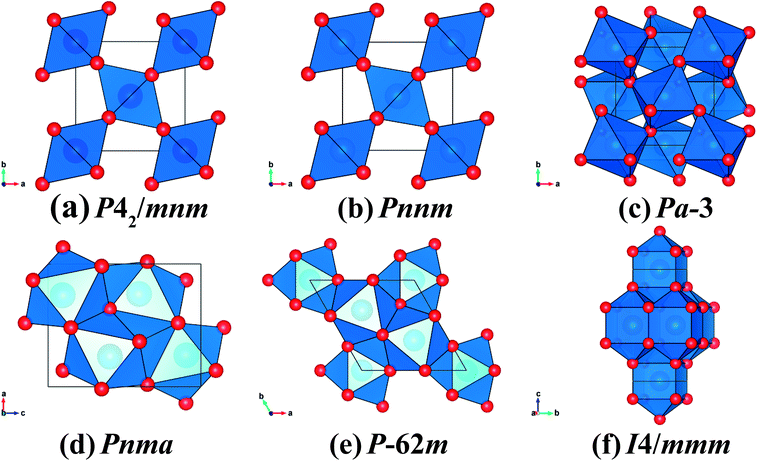 | ||
| Fig. 1 The crystal structures of CrO2 with (a) rutile-type, (b) CaCl2-type, (c) pyrite-type, (d) Pnma, (e) Fe2P-type and (f) I4/mmm. The blue and red spheres represent Cr and O atoms, respectively. | ||
High pressure, as one important thermodynamic parameter provides a unique way to decipher materials' structural, magnetic and electronic properties. The previous synchrotron X-ray diffraction (XRD) experiment and first-principle simulations both confirmed a second-order structural transition of CrO2 from rutile-type to CaCl2-type at ∼12 GPa.24–26 Theoretical computations predicted a further transition to the CaF2-type structure at 89.6 GPa.25 Recently, Wu et al.27 predicted a pressure-induced phase transition sequence of rutile-type → CaCl2-type → pyrite-type → CaF2-type for CrO2 whereas calculated results by the GGA method demonstrated that CrO2 underwent a transition sequence of rutile-type → CaCl2-type → PbO2-type → pyrite-type at high pressures.28 Obviously, there exists considerable discrepancy between different computational studies on CrO2. It is worthwhile to note that heretofore the highest coordination number of Cr of various CrO2 phases considered in previous investigations is eight whereas denser structures with higher coordination number are not included. In terms of magnetic properties of CrO2 at high pressures, Kuznetsov et al.29 predicted a magnetic transition from the FM state to the non-magnetic (NM) state accompanied by a half-metal to metal transition at ∼53 GPa. Whereas another theoretical study showed that the energetically favorable pyrite-type CrO2 kept FM and HM up to ∼100 GPa.28 In the meanwhile, Kim et al.26 indicated that the phonon softening led to the FM–NM transition across a structural transition from the CaCl2-type to a monoclinic structure at ∼61 GPa. Beyond ∼89 GPa, the CaF2-type structure had the lowest enthalpy and correspondingly CrO2 became a FM insulator. Therefore, the effect of pressure on the magnetic and electronic properties of CrO2 still remains elusive and the physical properties of CrO2 with much denser structures are poorly understood.
In this paper, we have performed first-principle calculations based on density functional theory (DFT) to fully investigate the structural, magnetic and electronic properties of CrO2 at high pressures aiming to bridge the gap about the high-pressure behavior of CrO2 between previous studies. Furthermore, we extend the pressure range to investigate stable structures and properties of CrO2 up to multimegabar conditions. Finally, comparing previous data with present results, we summarize the high-pressure behavior of various AO2 compounds such as the phase transition sequence, elasticity and electronic properties.
2. Methods
High pressure can generally reduce bond distances and lead to the structural transition of one compound to form a denser structure. In addition, transition metal dioxides might undergo a similar phase transition sequence upon compression due to similar properties of transition metal elements. Thus, based on this empirical rule of the high-pressure crystal chemistry and extensive experimental and computational data, twelve candidate structures (rutile-type (P42/mnm), CaCl2-type (Pnnm), PbO2-type (Pbcn), pyrite-type (Pa![[3 with combining macron]](https://www.rsc.org/images/entities/char_0033_0304.gif) ), CaF2-type (Fm
), CaF2-type (Fm![[3 with combining macron]](https://www.rsc.org/images/entities/char_0033_0304.gif) m), Pnma, Fe2P-type (P
m), Pnma, Fe2P-type (P![[6 with combining macron]](https://www.rsc.org/images/entities/char_0036_0304.gif) 2m), CuAl2-type (I4/mcm), R
2m), CuAl2-type (I4/mcm), R![[3 with combining macron]](https://www.rsc.org/images/entities/char_0033_0304.gif) m, I4/mmm, AlB2-type (P6/mmm), and Ni2In-type (P63/mmc)) for CrO2 were considered in the present study. First-principle calculations were performed based on DFT with the projected augmented wave method (PAW) implemented in Vienna ab-initio simulation package (VASP).30–32 The Perdew–Burke–Ernzerhof (PBE) version of the generalized gradient approximations (GGA) was selected to treat the exchange correlation potential.33 The kinetic energy cut-off was set to 1000 eV. The energy convergence criterion for the electronic self-consistent calculation was 10−6 eV. The total energy difference was converged to 1 × 10⁻⁵ eV per formula unit (f.u.) with respect to the energy cutoff or k-points. The force difference was converged to 1 × 10⁻³ eV Å−1 (less than 0.1 GPa). The spin-polarization of Cr without spin–orbit coupling in CrO2 with various structures was included in the present study to obtain accurate physical information of CrO2. The calculated sub-lattice magnetic moment per Cr in the rutile-type CrO2 at 0 GPa was 2.04 μB in agreement with previous results and the HM property of the rutile-type CrO2 could be accurately depicted.22 The structural, elastic and magnetic properties of the rutile-type CrO2 at 0 GPa could be reproduced by means of the GGA method. But Korotin et al.34 suggested that the correlated effect of 3d electrons should be considered in CrO2. Whether this system is strongly correlated is still an open question. On the one hand, comparing DFT results with low-temperature experimental data, Toropova et al.35 concluded that the ordered phase of CrO2 was weakly correlated. On the other hand, the calculated band gap of the rutile-type CrO2 at 0 GPa was ∼1.3 eV by the GGA method, much lower than the normal value ∼2 eV.34 Thus, in the present study, we used both the GGA and GGA + U methods to perform electronic density of state (DOS) calculations.36 We applied U = 3 eV (the on-site Coulomb interaction parameter) and J = 0.9 eV (the Hund coupling constant) for Cr in GGA + U calculations as previous simulations did.34,37
m, I4/mmm, AlB2-type (P6/mmm), and Ni2In-type (P63/mmc)) for CrO2 were considered in the present study. First-principle calculations were performed based on DFT with the projected augmented wave method (PAW) implemented in Vienna ab-initio simulation package (VASP).30–32 The Perdew–Burke–Ernzerhof (PBE) version of the generalized gradient approximations (GGA) was selected to treat the exchange correlation potential.33 The kinetic energy cut-off was set to 1000 eV. The energy convergence criterion for the electronic self-consistent calculation was 10−6 eV. The total energy difference was converged to 1 × 10⁻⁵ eV per formula unit (f.u.) with respect to the energy cutoff or k-points. The force difference was converged to 1 × 10⁻³ eV Å−1 (less than 0.1 GPa). The spin-polarization of Cr without spin–orbit coupling in CrO2 with various structures was included in the present study to obtain accurate physical information of CrO2. The calculated sub-lattice magnetic moment per Cr in the rutile-type CrO2 at 0 GPa was 2.04 μB in agreement with previous results and the HM property of the rutile-type CrO2 could be accurately depicted.22 The structural, elastic and magnetic properties of the rutile-type CrO2 at 0 GPa could be reproduced by means of the GGA method. But Korotin et al.34 suggested that the correlated effect of 3d electrons should be considered in CrO2. Whether this system is strongly correlated is still an open question. On the one hand, comparing DFT results with low-temperature experimental data, Toropova et al.35 concluded that the ordered phase of CrO2 was weakly correlated. On the other hand, the calculated band gap of the rutile-type CrO2 at 0 GPa was ∼1.3 eV by the GGA method, much lower than the normal value ∼2 eV.34 Thus, in the present study, we used both the GGA and GGA + U methods to perform electronic density of state (DOS) calculations.36 We applied U = 3 eV (the on-site Coulomb interaction parameter) and J = 0.9 eV (the Hund coupling constant) for Cr in GGA + U calculations as previous simulations did.34,37
For each crystalline phase, the atomic positions, unit-cell parameters and individual magnetic moments were allowed to relax at each given volume to obtain the minimum total energy. Energy-volume results were then fitted to the third-order Birch–Murnaghan equation of state (EoS) to obtain the corresponding parameters (volume per formula unit (V0), bulk modulus (K0), its pressure derivative  and energy (E0) at zero pressure).38,39 In addition, the enthalpy (H = E + PV) of each phase was compared with each other to identify the most stable structure at the given pressure. Furthermore, the DOS of various CrO2 phases under selected pressure conditions were obtained by the static calculation, utilizing the tetrahedral smearing method with Blöchl corrections. The k-points grids were set as 12 × 12 × 20 for rutile-type, 12 × 12 × 20 for CaCl2-type, 16 × 16 × 16 for pyrite-type, 16 × 24 × 12 for Pnma, 13 × 13 × 29 for Fe2P-type and 24 × 24 × 12 for I4/mmm CrO2 in DOS calculations. The phonon dispersion was calculated using the phonopy code by the supercell method.40 2 × 3 × 2, 2 × 2 × 3 and 3 × 3 × 2 supercells were constructed for the Pnma, Fe2P-type and I4/mmm CrO2, respectively. The k-points grids in phonon calculations were set as 3 × 5 × 3 for Pnma, 3 × 3 × 5 for Fe2P-type and 5 × 5 × 3 for I4/mmm CrO2, respectively.
3. Results and discussion
3.1. Structural stability and phase transitions
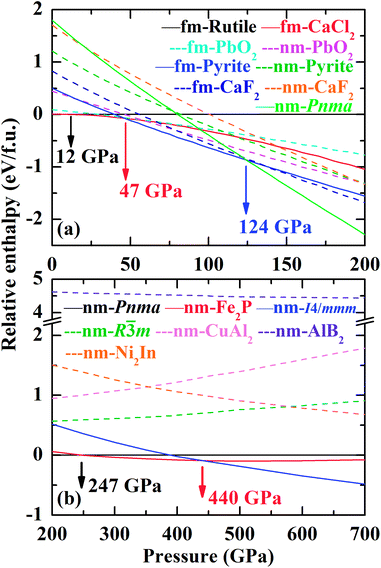
The corresponding EoS parameters of various candidate phases of CrO2 are listed in Table 1. The present results of the FM rutile-type CrO2 are consistent with previous high-pressure XRD data.24 Calculated static enthalpy differences among various candidate phases of CrO2 are plotted in Fig. 2 as a function of pressure up to 700 GPa based on aforementioned parameters. The present static calculations predict that CrO2 will undergo five structural transitions upon compression with the sequence of rutile-type → CaCl2-type → pyrite-type → Pnma → Fe2P-type → I4/mmm. Calculated lattice constants and atomic coordinates of six phases at selected pressures are listed in Table 2. at zero pressure) of different CrO2 phases. FM and NM represent ferromagnetic and non-magnetic, respectively. The previous experimental and theoretical data are extracted for comparison
| Phase | E0/f.u. (eV) | V0/f.u. (Å3) | K0 (GPa) | Method and reference | |
|---|---|---|---|---|---|
| FM-rutile | −25.231 | 29.13 | 228 | 4.7 | This study |
| Rutile | — | 28.50 | 235 | 5.0 | Exp.24 |
| Rutile | — | 28.09 | 283 | 4.6 | LDA27 |
| FM-CaCl2 | −25.225 | 29.15 | 205 | 3.7 | This study |
| CaCl2 | — | 29.05 | 162 | 4.0 | Exp.24 |
| CaCl2 | — | 28.32 | 179 | 4.3 | LDA27 |
| FM-PbO2 | −25.138 | 28.69 | 219 | 4.2 | This study |
| NM-PbO2 | −24.785 | 27.57 | 213 | 4.7 | This study |
| FM-pyrite | −24.727 | 26.85 | 249 | 4.4 | This study |
| Pyrite | — | 26.12 | 272 | 4.6 | LDA27 |
| NM-pyrite | −24.021 | 26.12 | 272 | 4.3 | This study |
| FM-CaF2 | −24.401 | 26.35 | 254 | 4.4 | This study |
| CaF2 | — | 25.26 | 289 | 4.5 | LDA27 |
| NM-CaF2 | −23.523 | 25.60 | 276 | 4.3 | This study |
| NM-Pnma | −23.434 | 24.95 | 254 | 4.0 | This study |
| NM-Fe2P | −22.844 | 23.98 | 286 | 4.1 | This study |
| NM-CuAl2 | −22.533 | 24.79 | 262 | 4.3 | This study |
NM-R![[3 with combining macron]](https://www.rsc.org/images/entities/char_0033_0304.gif) m m |
−22.861 | 24.88 | 254 | 4.2 | This study |
| NM-I4/mmm | −21.742 | 23.13 | 310 | 4.1 | This study |
| NM-AlB2 | −18.704 | 24.97 | 241 | 4.1 | This study |
| NM-Ni2In | −21.203 | 24.28 | 240 | 4.3 | This study |
| Phase | Pressure (GPa) | a (Å) | b (Å) | c (Å) | Site | Wyckoff symbol | Internal coordinates | Method and reference | ||
|---|---|---|---|---|---|---|---|---|---|---|
| x | y | z | ||||||||
| Rutile (P42/mnm) | 0 | 4.459 | 4.459 | 2.929 | Cr | 2a | 0 | 0 | 0 | This study |
| O | 4f | 0.3037 | 0.3037 | 0 | ||||||
| Rutile | 0 | 4.421 | 4.421 | 2.916 | Cr | 2a | 0 | 0 | 0 | Exp.24 |
| O | 4f | 0.301 | 0.301 | 0 | ||||||
| Rutile | 0 | 4.456 | 4.456 | 2.829 | Cr | 2a | 0 | 0 | 0 | LDA27 |
| O | 4f | 0.2999 | 0.2999 | 0 | ||||||
| CaCl2 (Pnnm) | 12 | 4.409 | 4.334 | 2.893 | Cr | 2a | 0 | 0 | 0 | This study |
| O | 4g | 0.3105 | 0.2945 | 0 | ||||||
| CaCl2 | 14 | 4.387 | 4.282 | 2.878 | Cr | 2a | 0 | 0 | 0 | Exp.24 |
| O | 4g | 0.299 | 0.272 | 0 | ||||||
| CaCl2 | 14 | 4.393 | 4.291 | 2.881 | Cr | 2a | 0 | 0 | 0 | GGA28 |
| O | 4g | 0.312 | 0.291 | 0 | ||||||
Pyrite (Pa![[3 with combining macron]](https://www.rsc.org/images/entities/char_0033_0304.gif) ) ) |
47 | 4.538 | 4.538 | 4.538 | Cr | 4a | 0 | 0 | 0 | This study |
| O | 8c | 0.3533 | 0.3533 | 0.3533 | ||||||
| Pyrite | 46 | 4.524 | 4.524 | 4.524 | Cr | 4a | 0 | 0 | 0 | GGA28 |
| O | 8c | 0.353 | 0.353 | 0.353 | ||||||
| Pnma | 128 | 4.876 | 2.541 | 6.066 | Cr | 4c | 0.2551 | 1/4 | 0.9049 | This study |
| O1 | 4c | 0.3676 | 1/4 | 0.5979 | ||||||
| O2 | 4c | 0.4815 | 1/4 | 0.1494 | ||||||
Fe2P (P![[6 with combining macron]](https://www.rsc.org/images/entities/char_0036_0304.gif) 2m) 2m) |
286 | 4.866 | 4.866 | 2.308 | Cr1 | 1b | 0 | 0 | 0.5 | This study |
| Cr2 | 2c | 1/3 | 2/3 | 0 | ||||||
| O1 | 3f | 0.2698 | 0 | 0 | ||||||
| O2 | 3g | 0.6045 | 0 | 0.5 | ||||||
| I4/mmm | 463 | 2.220 | 2.220 | 5.605 | Cr | 2b | 0.5 | 0.5 | 0 | This study |
| O | 4e | 0 | 0 | 0.1603 | ||||||
The predicted rutile–CaCl2 transition at 12 GPa is consistent with the experimental observation at 12 ± 3 GPa by high-pressure XRD and Raman spectroscopy.24 The second structural transition is calculated to occur at 47 GPa whereas Wu et al.27 predicted it to be 23.9 GPa. As shown in Table 1, data from Wu et al. are perfectly consistent with our results of the NM pyrite-type CrO2. However, our calculations demonstrate that the FM pyrite-type CrO2 is more stable than the NM phase up to at least 200 GPa (Fig. 2). This may explain the difference mentioned above. The previous study predicted an intermediate PbO2-type phase between the CaCl2-type and pyrite-type CrO2.28 Though Fig. 2 presents that the enthalpy difference between the PbO2-type and pyrite-type CrO2 is marginal, our results imply a direct transition from CaCl2-type to pyrite-type. This can be also supported by the previous high-pressure XRD experiment, which has revealed that the CaCl2-type CrO2 is stable up to about 50 GPa.24 In addition, previous studies simply considered the CaF2-type structure as the high-pressure post-pyrite phase of CrO2 neglecting other structures.25 The present simulation demonstrates that neither the FM CaF2-type nor the NM CaF2-type is a stable high-pressure phase. Instead, the Pnma structure becomes energetically favorable compared with the pyrite-type structure above 124 GPa. We further predict that at ultra-high pressures the Fe2P-type and I4/mmm structures are energetically stable for CrO2, both of which have been also identified as the post-Pnma phases for many AX2 compounds.17–19,41–43 It is to be noted that neither the AlB2-type nor Ni2In-type CrO2 is an energetically stable phase compared with the ten-fold coordinated I4/mmm structure in the calculated pressure range. The enthalpy difference between AlB2-type (or Ni2In-type) and I4/mmm is considerable. That is there is no tendency to transform to a structure where the coordination number of Cr is beyond 10 up to at least 700 GPa.
To investigate the dynamic stability of three new phases predicted here, the Pnma, Fe2P-type and I4/mmm structures at ultra-high pressures, we have performed ab initio lattice-dynamics calculations (Fig. 3). The resultant phonon spectra, lacking any imaginary frequencies imply that the Pnma and I4/mmm phases are dynamically stable. But for the Fe2P-type phase, the phonon softens below zero around the gamma point in the Brillion zone indicating that it is dynamically unstable. Combining H–P relations and phonon spectra, we might modify the high-pressure phase transition sequence of CrO2 with rutile-type → CaCl2-type → pyrite-type → Pnma → I4/mmm. It is worthwhile to mention that although recent first-principle calculations have shown that the energetically favorable Fe2P-type ZrO2 is dynamically unstable,44 the high-pressure and high-temperature XRD experiments have successfully synthesized the Fe2P-type ZrO2.43 This may indicates that the Fe2P-type phase is dynamically unstable at 0 K, and it can be stable at high temperature and quenched to the ambient temperature. Furthermore, the recent high-pressure experiment has found that VO2 partially undergoes the Pnma–Fe2P transition at ∼100 GPa at room temperature without laser heating.45 Thus, the Fe2P-type structure can still be a candidate as an intermediate high-pressure phase between the Pnma and I4/mmm phases. It definitely requires further experimental verification.
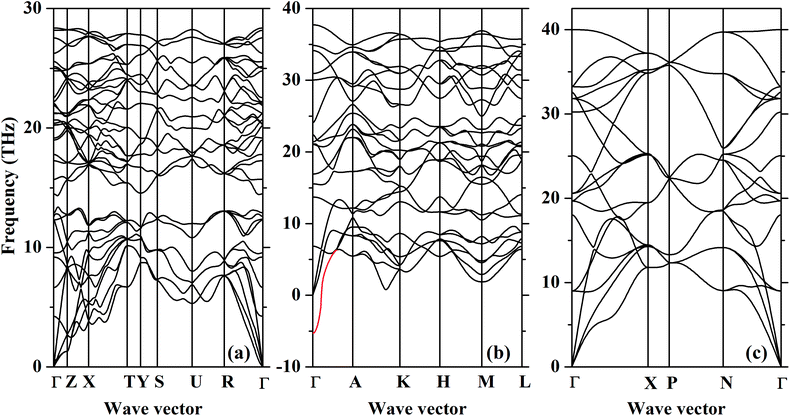 | ||
| Fig. 3 The phonon dispersions of the (a) Pnma, (b) Fe2P-type and (c) I4/mmm CrO2 at 128 GPa, 386 GPa and 463 GPa, respectively. The red line indicates the phonon softening. | ||
3.2. Equation of state and elasticity
Fig. 4 displays the compression of volumes of various phases as a function of pressure and previous experimental and theoretical data are plotted for comparison.24,27 Our results are generally larger than those obtained by experiments and calculated from simulations. It is widely accepted that GGA tends to overestimate the experimental volume whereas LDA underestimates it. In addition to different exchange correlation potentials, the spin-polarization of Cr is introduced in the present study, which can also cause a larger calculated volume of one compound.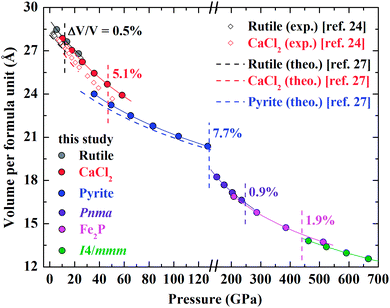 | ||
| Fig. 4 Calculated volume per formula unit of the rutile-type, CaCl2-type, pyrite-type, Pnma, Fe2P-type and I4/mmm CrO2 as a function of pressure. The solid lines are fitted by the third-order Birch–Murnaghan equation of state. The volume collapse through the structural transition is marked. The previous experimental (black and red open diamonds24) and theoretical (black, red and blue dashed lines27) data are plotted for comparison. | ||
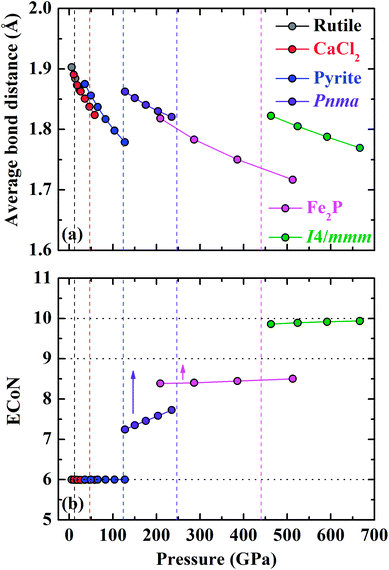
The volume reduction through the rutile–CaCl2 transition is marginal, specifically less than 0.5%, corresponding to the strain-driven distortive phase transition [Fig. 1(a) and (b)].24 This can also be supported by the calculated average Cr–O bond distance (dav) shown in Fig. 5, where the evolution of Cr–O bond distances is continuous through the rutile–CaCl2 transition at 12 GPa. (The average bond distance is defined as  .46,47 dav is obtained self-consistently.). The volume collapse is 5.1% for the CaCl2–pyrite transition, and 7.7% for the pyrite–Pnma transition (Fig. 4). It indicates that two transitions are both first-order. Fig. 5 and Table 2 demonstrate that the large volume collapse at the CaCl2–pyrite transition is due to the reconstruction of ions but not to the compression of the nearest-neighbor Cr–O distances [Fig. 1(b) and (c)]. The compression of Cr–O distances at high pressures leads to the abrupt volume change at the pyrite–Pnma transition [Fig. 1(d), 4 and 5]. The effective coordination number (ECoN) of Cr in the Pnma phase increases rapidly from 7.24 at ∼128 GPa to 7.73 at ∼235 GPa. (The effective coordination number is defined as
  46,47). ECoN of Cr in the Fe2P-type phase is 8.3–8.5 closer to the ideal value 9. Thus, dav decreases through the Pnma–Fe2P transition. The volume variation from Pnma to Fe2P-type and further to I4/mmm is 0.9% at 247 GPa and 1.9% at 440 GPa, respectively. It is comparable to that of structural transitions in similar compounds.17,19,41–43 Though the volume reduction is typically smaller than the aforementioned ones, it may have important contributions to stabilize the high-pressure polymorphs of CrO2. As displayed in Fig. 5, both the dense polyhedral packing and the compression of the nearest-neighbor Cr–O bond distances contribute to the volume variation [Fig. 1(e) and (f)].
As for the zero-pressure bulk modulus K0 of different polymorphs of CrO2, none of them are less than 200 GPa (Table 1). K0 of CrO2 generally increases after transforming into a new high-pressure phase except K0 of the CaCl2-type CrO2. The distortion of the CaCl2-type structure upon compression mainly accounts for such a reduction. It is worthwhile to note that K0 of the ten-fold coordinated I4/mmm CrO2 exceeds 300 GPa, which might be a potential super-hard material or could be utilized to explore novel super-hard materials.
3.3. Magnetic and electronic properties
As reported by previous studies, the rutile-type CrO2 is FM at ambient conditions.23 CrO2 keeps FM through the rutile–CaCl2–pyrite transition upon compression up to about 120 GPa (Fig. 6). The variation of the magnetic moment per Cr is continuous through the rutile–CaCl2 transition and there is slight increase of the magnetic moment by 0.08 μB at the CaCl2–pyrite transition. As shown in Fig. 6, the pressure slightly affects the magnetic moment of Cr of the FM state. Specifically, the slopes of magnetic moment reductions versus pressure are −0.0028 for rutile-type, −0.0008 for CaCl2-type and −0.0014 for pyrite-type, respectively. A magnetic collapse where the sub-lattice magnetic moment per Cr drops from ∼1.95 μB to 0 μB is observed at the transition from pyrite-type to Pnma at 124 GPa indicating an FM–NM transition (Fig. 6). CrO2 keeps NM up to 700 GPa considered in the present study. Our results do not support the FM–NM–FM transition proposed by Kim et al.26 Comparing previous investigations with our data, we are able to find out that magnetism affects not only the structural stability of CrO2 at high pressures but also other physical properties such as elasticity.26–28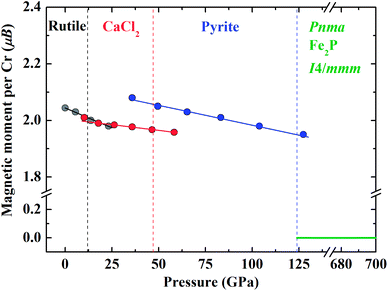 | ||
| Fig. 6 Calculated sub-lattice magnetic moment per Cr in different CrO2 phases as a function of pressure. | ||
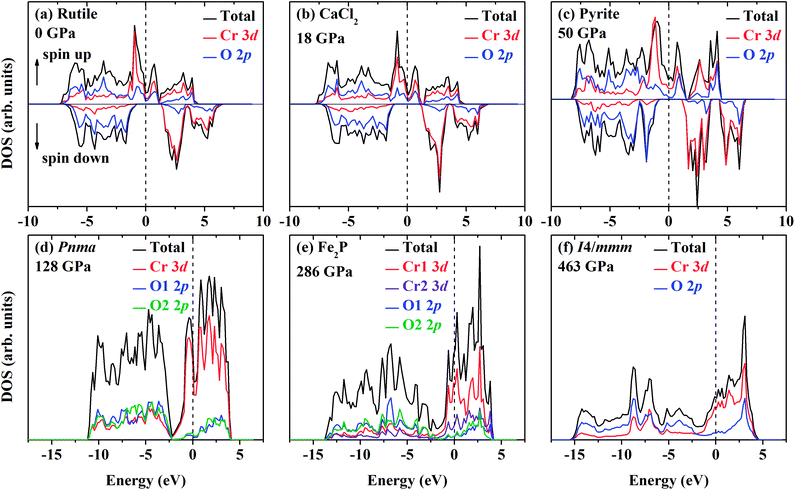
The DOS of various energetically favorable CrO2 phases at high pressures calculated by the GGA + U method are plotted in Fig. 7. In the rutile-type structure at ambient pressure [Fig. 7(a) and 8], the total DOS in the spin-up state crosses the Fermi level exhibiting metallic whereas there is a gap of 2.07 eV in the spin-down state indicating the semiconducting property. These confirm the HM character of the rutile-type CrO2 at ambient pressure. Upon compression, CrO2 keeps its half-metallicity at the transition to CaCl2-type, even further to pyrite-type (Fig. 7b and c). There is no discontinuity in the variation of the gap in the spin-down state across the rutile–CaCl2 transition (Fig. 8). The gap of the CaCl2-type CrO2 drops ∼0.2 eV at ∼35 GPa. It may be related to the softening of the B1g phonon mode as observed in the high-pressure Raman experiment.24 The gap in the spin-down state of the pyrite-type CrO2 reduces gradually upon compression implying the decrease of its half-metallicity at high pressures. At the transition to the Pnma structure, CrO2 becomes metallic demonstrating that its half-metallicity is destroyed by pressure [Fig. 7(d) and 8]. The Fe2P-type and I4/mmm CrO2 still exhibit metallic at least in the calculated pressure range [Fig. 7(e) and (f) and 8]. The contribution of 2p electrons of O to the conducting band is more pronounced in the Fe2P-type or I4/mmm structure than that in the Pnma structure. Compared with the first three structures (rutile-type, CaCl2-type and pyrite-type), the 3d electrons of Cr and 2p electrons of O both become more delocalized within the last three structures (Pnma, Fe2P-type and I4/mmm) resulting in an enhancement of the hybridization between 3d electrons of Cr and 2p electrons of O. As mentioned above, an FM–NM transition with the magnetic collapse of Cr is observed at the pyrite–Pnma transition. In combination with the analysis of DOS of various CrO2 phases, we may propose that with increasing pressure an FM–NM transition accompanied by a magnetic collapse delocalizes the 3d electrons of Cr leading to the metallic character of CrO2.
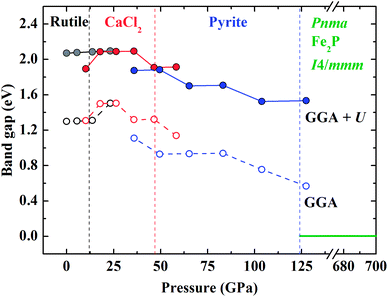 | ||
| Fig. 8 Calculated band gaps in the spin-down state of various CrO2 phases as a function of pressure by the GGA and GGA + U methods. | ||
3.4. Comparison with other AO2 compounds
Extensive experimental and theoretical simulations have been performed on AO2 compounds to investigate their stable high-pressure polymorphs. For the fourth main-group element dioxides except CO2, they can undergo a transition to the Pnma structure at relevant high-pressure conditions.42,48–51 SiO2 and GeO2 are predicted to undergo the Pnma–Fe2P transition upon further compression.17,18,42 The Pnma–Fe2P transition of TiO2 is predicted to occur at 161 GPa by the GGA method and confirmed by in situ XRD at 200 GPa and 3000 K.41 Experimental and theoretical studies have also verified similar transitions in ZrO2.43 According to these available data and our results, we have plotted the transition pressure to the Pnma or Fe2P-type structure (noted by PP or PF) for AO2 compounds versus the ionic radius of cations (noted by Ir) (Fig. 9). The ionic radius is the value of the six-fold coordinated cation with the chemical valence of +4.52 These dioxides can be divided into two groups: main-group element dioxides with unoccupied d orbitals and transition metal dioxides. As shown in Fig. 9, PP or PF for transition metal dioxides is much lower than that for main-group element dioxides. For main-group element dioxides, PP decreases significantly with Ir compared with PF [Fig. 9(a)]. For transition metal dioxides, PP or PF can be roughly considered to reduce linearly with Ir [Fig. 9(b)]. Either theoretical or experimental PF of VO2 is much lower than that of TiO2 or CrO2. At room temperature, VO2 crystallizes in the monoclinic P21/c structure, a distorted rutile-type form. The distortion significantly affects the structural characteristics and physical properties of VO2 upon compression. The quasi-hydrostatic or non-hydrostatic condition in high-pressure diamond anvil cell experiments may contribute to or even promote the transition to the Fe2P-type structure.45 PP and PF of CrO2 are a little larger. It may be related to the fact that CrO2 have unpaired 3d electrons. The existence of magnetism in CrO2 may stabilize the pyrite-type phase, postponing the transition to the Pnma phase. Xie et al.45 also take the high-pressure structural evolution of RuO2 as an example to illustrate the phase transition route of CaCl2–pyrite–CaF2. The difference of oxygen coordination between VO2 and RuO2 leads to different evolution patterns. In the present study, the FM CaF2-type CrO2 is much more stable than the NM phase (Fig. 2). But the NM Pnma CrO2 is energetically favorable compared with aforementioned two phases. The magnetic collapse of Cr can make contributions to favor the pyrite–Pnma transition rather than the pyrite–CaF2 transition. The available data for the pressure-induced phase transition to the I4/mmm structure are too limited and there is no significant relation between the transition pressure to the I4/mmm structure and Ir. In terms of FeO2 in the recent study, we have predicted a transition sequence of pyrite–R![[3 with combining macron]](https://www.rsc.org/images/entities/char_0033_0304.gif) m–I4/mmm at high pressures, different from present calculated results.53 And the stable region of the R
m–I4/mmm at high pressures, different from present calculated results.53 And the stable region of the R![[3 with combining macron]](https://www.rsc.org/images/entities/char_0033_0304.gif) m FeO2 has a span of ∼1200 GPa whereas the R
m FeO2 has a span of ∼1200 GPa whereas the R![[3 with combining macron]](https://www.rsc.org/images/entities/char_0033_0304.gif) m CrO2 is energetically unfavorable in the present calculated pressure range. Therefore, this can serve as an indirect evidence that the chemical valence of iron cation is not +4 in FeO2 under ultra-high pressure.
m CrO2 is energetically unfavorable in the present calculated pressure range. Therefore, this can serve as an indirect evidence that the chemical valence of iron cation is not +4 in FeO2 under ultra-high pressure.
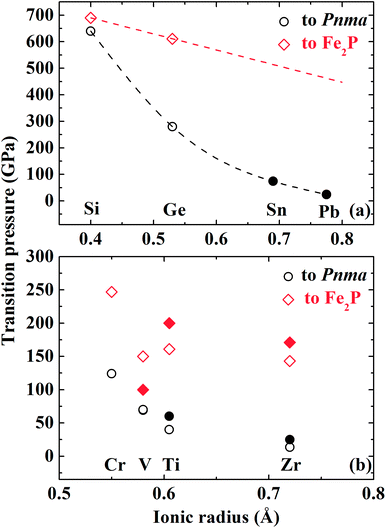 | ||
| Fig. 9 Correlation plot between the transition pressure to the Pnma or Fe2P-type structure for AO2 compounds and the ionic radius of cations. The ionic radius of the horizontal ordinate is the value of the six-fold coordinated cation with the chemical valence of +4.51 The circle and diamond marks represent the transition pressure to Pnma and Fe2P-type, respectively. The open and solid marks represent results obtained by simulations and experiments, respectively.17,41–43,45,50,51 | ||
The EoS of the Pnma TiO2 and ZrO2 have been also obtained by means of high-pressure XRD experiments.54,55 These results show that K0 of either TiO2 or ZrO2 is larger than 400 GPa. However, recent first-principle calculations or updated XRD data demonstrate that they are both smaller than 300 GPa, i.e. 250–290 GPa for TiO2 and ∼286 GPa for ZrO2.12,41,43 It is thus worthwhile to mention that K0 of the Pnma phase slightly increases with Ir. As displayed in Fig. 5(b), ECoN of Cr in the Pnma phase is much smaller than nine. It increases rapidly upon compression, indicating the rapid compression of the longest Cr–O bond as a function of pressure. This may result in a smaller K0. Whereas those with high ECoN may have a larger K0.
As for the electronic property, the HM CrO2 is predicted to become metallic through the pyrite–Pnma structural transition and keep its metallicity up to 700 GPa. Lyle et al.19 have predicted the closure of the band gap in TiO2 and SiO2 through the Fe2P–I4/mmm transition at 650 GPa and 9800 GPa, respectively. While FeO2 is metallic even in the deep lower mantle conditions.10,56 These thus lead to the conclusion that many of the I4/mmm AO2 compounds can exhibit metallic, to some extent, independent of their chemical valence and ionic radii of cations. That is the structural character of I4/mmm itself strongly affects the electronic property of AO2 compounds with the I4/mmm structure upon compression. This can provide an alternative method to explore and synthesize metallic AO2 materials at high pressures.
4. Conclusions
In conclusion, the high-pressure behavior of CrO2 has been studied based on first-principle density functional theory. CrO2 is predicted to undergo a structural transition sequence of rutile-type → CaCl2-type → pyrite-type → Pnma→ (Fe2P-type→) I4/mmm at high pressures. Through the pyrite–Pnma transition, a magnetic collapse in CrO2 where the magnetic moment drops from ∼2 μB to 0 μB is observed accompanied by a half-metal to metal crossover. The equation of state for different phases of CrO2 are determined and the elasticity of CrO2 at high pressures is also discussed in detail. Finally, we summarize the high-pressure behavior of various AO2 compounds, such as the phase transition pressure, elastic and electronic properties.Conflicts of interest
There are no conflicts to declare.Acknowledgements
X. W. and S. Q. acknowledge financial support from the National Science Foundation of China (41473056 and 41472037).References
- A. Fujishima and H. Kenichi, Nature, 1972, 238, 37–38 CrossRef PubMed.
- B. O'Regan and M. Grätzel, Nature, 1991, 353, 737–740 CrossRef.
- U. Bach, D. Lupo, P. Comte, J. E. Moser, F. Weissörtel, J. Salbeck, H. Spreitzer and M. Grätzel, Nature, 1998, 395, 583–585 CrossRef.
- M. Nakano, K. Shibuya, D. Okuyama, T. Hatano, S. Ono, M. Kawasaki, Y. Iwasa and Y. Tokura, Nature, 2012, 487, 459–462 CrossRef PubMed.
- N. Shukla, A. V. Thathachary, A. Agrawal, H. Paik, A. Aziz, D. G. Schlom, S. K. Gupta, R. Engel-Herbert and S. Datta, Nat. Commun., 2015, 6, 7812 CrossRef PubMed.
- H. Yoon, M. Choi, T. Lim, H. Kwon, K. Ihm, J. K. Kim, S. Choi and J. Son, Nat. Mater., 2016, 15, 1113–1119 CrossRef PubMed.
- S. Lee, K. Hippalgaonkar, F. Yang, J. Hong, C. Ko, J. Suh, K. Liu, K. Wang, J. J. Urban, X. Zhang, C. Dames, S. A. Hartnoll, O. Delaire and J. Wu, Science, 2017, 355, 371–374 CrossRef PubMed.
- R. S. Keizer, S. T. B. Goennenwein, T. M. Klapwijk, G. Miao, G. Xiao and A. Gupta, Nature, 2006, 439, 825–827 CrossRef PubMed.
- Q. Hu, D. Y. Kim, W. Yang, L. Yang, Y. Meng, L. Zhang and H. K. Mao, Nature, 2016, 534, 241–244 CrossRef PubMed.
- S. Huang, S. Qin and X. Wu, J. Earth Sci., 2018 DOI:10.1007/s12583-018-0836-y.
- X. Wu, E. Holbig and G. Steinle-Neumann, J. Phys.: Condens. Matter, 2010, 22, 295501 CrossRef PubMed.
- V. Swamy and N. C. Wilson, J. Phys. Chem. C, 2014, 118, 8617–8625 CrossRef.
- T. Zhu and S. Gao, J. Phys. Chem. C, 2014, 118, 11385–11396 CrossRef.
- M. Mattesini, J. S. de Almeida, L. Dubrovinsky, N. Dubrovinskaia, B. Johansson and R. Ahuja, Phys. Rev. B: Condens. Matter Mater. Phys., 2004, 70, 212101 CrossRef.
- L. Bai, Q. Li, S. A. Corr, Y. Meng, C. Park, S. V. Sinogeikin, C. Ko, J. Wu and G. Shen, Phys. Rev. B: Condens. Matter Mater. Phys., 2015, 91, 104110 CrossRef.
- V. Balédent, T. T. F. Cerqueira, R. Sarmiento-Pérez, A. Shukla, C. Bellin, M. Marsi, J. Itié, M. Gatti, M. A. L. Marques, S. Botti and J. Rueff, Phys. Rev. B, 2018, 97, 024107 CrossRef.
- T. Tsuchiya and J. Tsuchiya, Proc. Natl. Acad. Sci. U. S. A., 2011, 108, 1252–1255 CrossRef PubMed.
- S. Wu, K. Umemoto, M. Ji, C. Wang, K. Ho and R. M. Wentzcovitch, Phys. Rev. B: Condens. Matter Mater. Phys., 2011, 83, 184102 CrossRef.
- M. J. Lyle, C. J. Pickard and R. J. Needs, Proc. Natl. Acad. Sci. U. S. A., 2015, 112, 6898–6901 CrossRef PubMed.
- H. Niu, A. R. Oganov, X. Chen and D. Li, Sci. Rep., 2015, 5, 18347 CrossRef PubMed.
- R. J. Soulen Jr, J. M. Byers, M. S. Osofsky, B. Nadgorny, T. Ambrose, S. F. Cheng, P. R. Broussard, C. T. Tanaka, J. Nowak, J. S. Moodera, A. Barry and J. M. D. Coey, Science, 1998, 282, 85–88 CrossRef PubMed.
- R. Yamamoto, Y. Moritomo and A. Nakamura, Phys. Rev. B: Condens. Matter Mater. Phys., 2000, 61, R5062 CrossRef.
- K. Schwarz, J. Phys. F: Met. Phys., 1986, 16, L211 CrossRef.
- B. R. Maddox, C. S. Yoo, D. Kasinathan, W. E. Pickett and R. T. Scalettar, Phys. Rev. B: Condens. Matter Mater. Phys., 2006, 73, 144111 CrossRef.
- V. Srivastava, M. Rajagopalan and S. P. Sanyal, Eur. Phys. J. B, 2008, 61, 131–139 CrossRef.
- S. Kim, K. Kim, C. Kang and B. I. Min, Phys. Rev. B, 2012, 85, 094106 CrossRef.
- H. Y. Wu, Y. H. Chen, C. R. Deng and X. F. Su, Phase Transform., 2012, 85, 708–717 CrossRef.
- Y. Li and J. Hao, Solid State Commun., 2012, 152, 1216–1220 CrossRef.
- A. Yu. Kuznetsov, J. S. de Almeida, L. Dubrovinsky, R. Ahuja, S. K. Kwon, I. Kantor, A. Kantor and N. Guignot, J. Appl. Phys., 2006, 99, 053909 CrossRef.
- P. E. Blöchl, Phys. Rev. B: Condens. Matter Mater. Phys., 1994, 50, 17953–17979 CrossRef.
- G. Kresse and J. Furthmüller, Phys. Rev. B: Condens. Matter Mater. Phys., 1996, 54, 11169–11186 CrossRef.
- G. Kresse and D. Joubert, Phys. Rev. B: Condens. Matter Mater. Phys., 1999, 59, 1758–1775 CrossRef.
- J. P. Perdew, K. Burke and M. Ernzerhof, Phys. Rev. Lett., 1996, 77, 3865–3868 CrossRef PubMed.
- M. A. Korotin, V. I. Anisimov, D. I. Khomskii and G. A. Sawatzky, Phys. Rev. Lett., 1998, 80, 4305 CrossRef.
- A. Toropova, G. Kotliar, S. Y. Savrasov and V. S. Oudovenko, Phys. Rev. B: Condens. Matter Mater. Phys., 2015, 71, 172403 CrossRef.
- S. L. Dudarev, G. A. Botton, S. Y. Savrasov, C. J. Humphreys and A. P. Sutton, Phys. Rev. B: Condens. Matter Mater. Phys., 1998, 57, 1505–1509 CrossRef.
- O. Mustonen, S. Vasala, T. Chou, J. Chen and M. Karppinen, Phys. Rev. B, 2016, 93, 014405 CrossRef.
- F. D. Murnaghan, Proc. Natl. Acad. Sci. U. S. A., 1994, 30, 244–247 CrossRef.
- F. Birch, Phys. Rev., 1947, 71, 809–824 CrossRef.
- A. Togo, F. Oba and I. Tanaka, Phys. Rev. B: Condens. Matter Mater. Phys., 2008, 78, 1–9 CrossRef.
- H. Dekura, T. Tsuchiya, Y. Kuwayama and J. Tsuchiya, Phys. Rev. Lett., 2011, 107, 045701 CrossRef PubMed.
- H. Dekura, T. Tsuchiya and J. Tsuchiya, Phys. Rev. B: Condens. Matter Mater. Phys., 2011, 83, 134114 CrossRef.
- D. Nishio-Hamane, H. Dekura, Y. Seto and T. Yagi, Phys. Chem. Miner., 2015, 42, 385–392 CrossRef.
- J. Zhang, A. R. Oganov, X. Li, M. M. D. Esfahani and H. Dong, J. Appl. Phys., 2017, 121, 155104 CrossRef.
- S. Xie, L. Wang, F. Liu, X. Li, L. Bai, V. B. Prakapenka, Z. Cai, H. K. Mao, S. Zhang and H. Liu, J. Phys. Chem. Lett., 2018, 9, 2388–2393 CrossRef PubMed.
- R. Hoppe, Z. Kristallogr., 1979, 150, 23–52 CrossRef.
- J. L. F. Da Silva, J. Appl. Phys., 2011, 109, 023502 CrossRef.
- A. R. Oganov, M. J. Gillan and G. D. Price, Phys. Rev. B: Condens. Matter Mater. Phys., 2005, 71, 064104 CrossRef.
- K. Umemoto, R. M. Wentzcovitch and P. B. Allen, Science, 2006, 311, 983–986 CrossRef PubMed.
- S. R. Shieh, A. Kubo, T. S. Duffy, V. B. Prakapenka and G. Shen, Phys. Rev. B: Condens. Matter Mater. Phys., 2006, 73, 014105 CrossRef.
- B. Grocholski, S. Shim, E. Cottrell and V. B. Prakapenka, Am. Mineral., 2014, 99, 170–177 CrossRef.
- R. D. Shannon, Acta Crystallogr., Sect. A: Cryst. Phys., Diffr., Theor. Gen. Crystallogr., 1976, 32, 751–767 CrossRef.
- S. Huang, X. Wu and S. Qin, J. Geophys. Res., [Solid Earth Planets], 2018, 123, 277–284 CrossRef.
- S. Desgreniers and K. Lagarec, Phys. Rev. B: Condens. Matter Mater. Phys., 1999, 59, 8467–8472 CrossRef.
- L. S. Dubrovinsky, N. A. Dubrovinskaia, V. Swamy, J. Muscat, N. M. Harrison, R. Ahuja, B. Holm and B. Johansson, Nature, 2001, 410, 653–654 CrossRef PubMed.
- B. G. Jang, D. Y. Kim and J. H. Shim, Phys. Rev. B, 2017, 95, 075144 CrossRef.
| This journal is © The Royal Society of Chemistry 2018 |


