 Open Access Article
Development of a fluorescence assay for highly sensitive detection of Pseudomonas aeruginosa based on an aptamer-carbon dots/graphene oxide system†
Hongying Wang‡
a,
Zhe Chi‡ *a,
Ying Conga,
Zhuangzhuang Wanga,
Fei Jianga,
Jiayue Genga,
Peng Zhang*b,
Peng Juc,
Quanjiang Dongd and
Chenguang Liu*a
aCollege of Marine Life Science, Ocean University of China, Qingdao 266003, P. R. China. E-mail: cz1108@ouc.edu.cn; liucg@ouc.edu.cn
bResearch Centre of Plant Functional Components, Tobacco Research Institute of Chinese Academy of Agricultural Sciences, Qingdao, 266001, P. R. China. E-mail: zhangpeng@caas.cn
cKey Laboratory of Marine Bioactive Substances and Analytical Technology, Marine Ecology Center, The First Institute of Oceanography, State Oceanic Administration (SOA), 6 Xianxialing Road, Qingdao 266061, P. R. China
dCentral Laboratory and Department of Gastroenterology, Qingdao Municipal Hospital, Qingdao 266071, P. R. China
First published on 19th September 2018
Abstract
An aptamer-based fluorescence assay for culture-independent detection of Pseudomonas aeruginosa was developed. This assay was enabled by highly specific aptamers conjugated with photoluminescent carbon dots (CDs) as the fluorescent probe and graphene oxide (GO) as the quencher. Specially, high-throughput sequencing was achieved during systematic evolution of ligands via exponential enrichment (SELEX) for accurate recognition of aptamers. This assay displayed high specificity towards P. aeruginosa and was resistant to interference by other ubiquitous bacteria including Escherichia coli, Bacillus subtilis, Staphylococcus aureus, Enterococcus faecalis, and Clostridium perfringens. After the conditions were optimized, this assay achieved a wide detection range for P. aeruginosa varying from 101 CFU mL−1 to 107 CFU mL−1. Notably, it approached an excellent detection limit as low as 9 CFU mL−1. Therefore, this fluorescence assay was considered successfully developed for highly sensitive detection of P. aeruginosa. This assay also detected the contamination of P. aeruginosa in tap water and commercial bottled water, thereby suggesting its potential application in real water samples.
1. Introduction
Pseudomonas aeruginosa is a ubiquitous opportunistic pathogen, which exists in moist environments. Its characteristics make it a significant threat to human health and it is now being monitored clinically and in the food industry.1 Although traditional methods for culture-dependent detection of P. aeruginosa are reliable,1,2 more rapid and sensitive detection methods are still demanded.1 In recent years, aptamer-based biosensors and assays have displayed greater advantages in detecting pathogenic microorganisms with rapidity and high specificity and sensitivity.3Aptamers are well known to be obtained through systematic evolution of ligands via exponential enrichment (SELEX).4 Presently, high-throughput sequencing (HTS), which yields extensive data at the gigabyte level, can guarantee adequate sequence coverage, thereby enabling accurate recognition of the most abundant sequences in polymerase chain reaction (PCR) products in any round of SELEX; this provides a novel comprehensive method for precise identification of target aptamer.5 Therefore, HTS is incorporated into whole-bacteria SELEX (WB-SELEX) in this study.
Aptamer-based biosensors and assays employ various sensing methodologies.6 The fluorometric assays are more promising and advantageous than colorimetric assays, owing to their increased sensitivity.6 Among numerous fluorophores, carbon dots (CDs) have received increasing attention for their excellent optical performance for enhanced sensitivity and their large-scale synthesis is easy and cost-effective.7,8 Recently, graphene oxide (GO) has been more commonly applied in fluorometric biosensors.6 GO can serve as an anchor for aptamers owing to the π–π stacking interactions between them.9 Moreover, they have great fluorescence quenching capability for fluorophores owing to fluorescence resonance energy transfer (FRET),6,9 which is similar to the characteristics of nano-graphite, which can effectively reduce the background fluorescence signals of CDs and improve sensitivity.8 Hence, a fluorescence assay, which utilizes the aptamer-CD probe/GO system might be ideal for achieving rapid and highly sensitive detection of P. aeruginosa in a culture-independent manner.
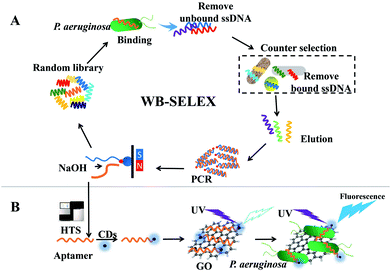
The present study aimed to develop such a fluorescence assay (Scheme 1). Five aptamer candidates for P. aeruginosa were recognized via WB-SELEX with the HTS technique. Then, these aptamer candidates were conjugated with photoluminescent CDs to synthesize three fluorescent probes. With these probes, their equilibrium dissociation constant was determined, thereby aiding the exclusion of two aptamer candidates. Subsequently, the remaining three probes were mixed with graphene oxide (GO) to form the detection systems. By performing the detection to P. aeruginosa and six other interfering bacteria, only one aptamer-CDs probes showed the highest specificity to P. aeruginosa. With this highly specific aptamer-CDs/GO system, a highly sensitive fluorescence assay for the detection of P. aeruginosa mediated was successfully accomplished.
2. Experimental
2.1 Strains and culture conditions
Pseudomonas aeruginosa ATCC 27853 was used for aptamer selection. Escherichia coli ATCC 25922, Bacillus subtilis ATCC 6051, and Staphylococcus aureus ATCC 12600 were used for counter selections. Pseudomonas putida ATCC 12633, Enterococcus faecalis ATCC 19433, and Clostridium perfringens ATCC 13124, along with the aforementioned counter selection bacteria were used as interfering bacteria to determine the specificities of aptamer candidates. All the aerobic bacterial strains were cultured at 37 °C in LB medium (10 g L−1 tryptone, 5 g L−1 yeast extract, and 10 g L−1 NaCl; pH 7.2–7.4) for 16 h before harvest. The anaerobic bacteria were cultured in fluid thioglycolate medium (Aikb, Qingdao) and in an anaerobic workstation (BUGBOX, Ruskinn, Bridgend, UK) for 48 h at 37 °C. The cells were harvested via centrifugation at 1000 × g for 3 min and washed twice with binding buffer (50 mM Tris–HCl, 100 mM NaCl, 5 mM KCl, and 1 mM MgCl2; pH 7.5) before use.2.2 SELEX procedures
The SELEX procedures were followed in accordance with previously described methods10 with some improvements. Initially, the ssDNA library was synthesized by GenScript (Nanjing, China) and consisted of a central random sequence of 40 nucleotides (nt) flanked by two primer hybridization sites (5′-TGGACCTTGCGATTGCGATTGA CAGC (40 nt) GCAGACATGAGTCTCAGGAC-3′). A counter selection was implemented immediately in the first round of SELEX,11 using E. coli ATCC 25922, B. subtilis ATCC 6051, and S. aureus ATCC 12600 together as counter selection bacteria (final density 1 × 10⁷ CFU mL−1 for each culture) in 300 μL binding buffer containing 1.3 nmol of the initial ssDNA library. The rest operations were consistent with conventional methods, and an additional 14 rounds were carried out. Selection conditions in every round are listed in Table S1†.2.3 Recognition of aptamer candidates via HTS
A comprehensive study of the sequences in the ssDNA pools in the 9th, 12th, and 15th rounds of SELEX were accomplished via HTS. Briefly, 2 μg of ssDNA were enriched from PCR products generated from the last round and sequenced at Novogene Co. Ltd. (Beijing, China) via the Illumina HiSeq 3000 platform for PE 150 sequencing to obtain data of 1 gigabyte. Sequences thus obtained were clustered in accordance with their identities to reveal the abundance of each sequence inside the ssDNA pool. The five most abundant ssDNAs were selected as aptamer candidates. The free energies of aptamer candidates were analyzed using the DNAMAN software12 and secondary structures of the aptamer candidates were predicted using Mfold program (http://mfold.rna.albany.edu/?q=mfold).132.4 Preparation and characterization of CDs and aptamer-CDs conjugates
CDs and aptamer-CD conjugates were synthesized using the method described previously.8,14 The obtained CDs and aptamer candidate-CDs conjugates were characterized via HRTEM and agarose gel electrophoresis,8 UV-vis scanning, and scanning of excitation and emission spectra.142.5 Determination of the equilibrium dissociation constant
The equilibrium dissociation constant (Kd) of the five aptamer candidates were measured in accordance with a previously described method,10,15 with some modifications. Generally, P. aeruginosa at the final density of 1 × 10⁷ CFU mL−1 were incubated in a 300 μL binding buffer at 37 °C with each aptamer candidate-CD probe synthesized at the different final concentrations of 0, 50, 100, 150, 200, 250, 300, 350, and 400 nM. The fluorescence intensity was measured at an excitation wavelength of 450 nm and the Kd values were calculated as described previously.102.6 Specificity test
For determining the specificity of the five aptamer candidates to P. aeruginosa, five corresponding aptamer candidate-CDs/GO systems were constructed, which respectively consisted of 100 g mL−1 of GO (diameter 10–50 μm) and 15 μM of each aptamer-CD probe in 300 μL binding buffer. These systems were incubated for 1 h at 37 °C and their fluorescence intensities were measured at an excitation wavelength of 450 nm. Thereafter, 100 μL of P. aeruginosa (1 × 10⁷ CFU mL−1) was introduced into each system and incubated at 37 °C for 30 min. The fluorescence intensities were measured again at an excitation wavelength of 450 nm. Groups not containing P. aeruginosa served as the negative control. The fluorescence recovery ratio was determined as follows: ΔI = [(F − F0)/F0] (F = the fluorescence intensity of each aptamer-CDs/GO system in the presence of P. aeruginosa, F0 = the fluorescence intensity in the absence of P. aeruginosa). To evaluate the specificities of each aptamer-CD probe, fluorescence recovery ratios were determined using these five aptamer-CD/GO systems against the six different interfering bacteria, as stated above at a density of 1 × 10⁷ CFU mL−1. The statistical analysis was performed by Student's t test, p < 0.05 was considered to have difference and p < 0.01 was considered to have significant difference.2.7 Optimization of reacting conditions
For optimization of GO concentration, the concentration of aptamer-CD probes was fixed as 15 μM, as reported previously,8 whereas GO concentration was set differently as 0, 25, 50, 75, 100, 125, 150, 175, 200, and 225 μg mL−1, respectively. After incubation in 300 μL of binding buffer (pH 7.5) for 30 min, the fluorescence intensities were determined as described above. Reaction time was optimized by measuring fluorescence recovery ratios after P. aeruginosa (1 × 10⁷ CFU mL−1) were subjected to a previously optimized aptamer-CDs/GO system and incubated for 0, 15, 30, 45, 60, 75, 90, 105, 120, and 135 min, respectively, following the previous procedures.2.8 Detection range and limit for P. aeruginosa
The detection range was analysed using the aptamer-CDs/GO system under optimized conditions, with P. aeruginosa at the following densities: 10, 1 × 10², 1 × 10³, 1 × 10⁴, 1 × 10⁵, 1 × 10⁶, and 1 × 10⁷ CFU mL−1. Fluorescence recovery ratios were measure as described above. The limit of detection was determined in accordance with a previously reported method.162.9 Detection of P. aeruginosa in artificially contaminated samples
The aptamer-CDs/GO system was applied in real time with tap water and commercial mineral water (Nestle Co. Ltd., Beijing, China). They were first treated with the aptamer-CDs/GO system from this study to detect the P. aeruginosa in accordance with the procedures in the previous paragraphs. Thereafter, they were artificially contaminated with P. aeruginosa at 1 × 101, 1 × 10², and 1 × 10³ CFU mL−1, respectively. The contaminated samples were also subjected to the aptamer-CDs/GO system with the same procedures. Sterilized distilled water was used as a negative control.3. Results and discussion
3.1 Efficient HTS-assisted recognition of aptamer candidates
A specific aptamer is the first element for developing the fluorescence assay proposed herein. HTS is currently known to greatly improve efficiency in analyzing sequences for ssDNA pools, which are generated in the process of SELEX and accurately recognizes highly abundant sequences as aptamer candidates.5,17 In this study, HTS revealed that PA1, PA2, PA3, PA4, and PA5 (Table 1) were the most abundant sequences in the ssDNA pools from the 9th, 12th, and 15th round of SELEX (Fig. S1†); these five ssDNA sequences were selected as aptamer candidates. Moreover, they all approached their maximum abundances at the 12th round (Fig. S1†), indicating that twelve rounds of SELEX were most appropriate.| Aptamer candidates | Sequences | ΔG (kcal mol−1) | Kd (nM) |
|---|---|---|---|
| a Data are given as means ± SD, n = 3. | |||
| PA1 | TGGACCTTGCGATTGACAGCAGACATGAGTCTCAGGACGTGACCGCTGGACCTTGCGATTGACAGCAGACATGAGTCTCAGGAC | −7.60 | 15.16 ± 3.62 |
| PA2 | TGGACCTTGCGATTGACAGCAGACATGAGTCTCAGGACGTGACCGTTGGACCTTGCGATTGACAGCAGACATGAGTCTCAGGAC | −7.76 | 14.11 ± 2.59 |
| PA3 | TGGACCTTGCGATTGACAGCAGACATGAGTCTCAGGACACGACGCATGGACCTTGCGATTGACAGCAGACATGAGTCTCAGGAC | −9.78 | 32.59 ± 8.89 |
| PA4 | TGGACCTTGCGATTGACAGCAGACATGAGTCTCAGGACGCACGTTGGACCTTGCGATTGACAGCAGACATGAGTCTCAGGAC | −3.05 | 16.39 ± 8.14 |
| PA5 | TGGACCTTGCGATTGACAGCTCGTGGCACGTGCCGCTCGCCTTGGACCTTGCGATTGACAGCAGACATGAGTCTCAGGAC | −2.53 | 30.69 ± 7.15 |
HTS in this study yielded approximately 1.7 × 10⁶ strands for each ssDNA pool above and the repeats of the five aptamers were in tens of thousands (Fig. S1†). Nevertheless, in the SELEX procedure for Listeria species, only fifty clones were sequenced and only one or two repeats were detected within these fifty clones.15 This rendered the selected aptamer not representative but rather stochastic because of high varieties within more than a million of sequences in the ssDNA pools.5 Hence, the use of HTS in SELEX greatly assisted the recognition of aptamer candidates with high specificity and efficiency.
Table 1 shows that these five candidates exhibited a much lower free energy (ΔG) than previously reported aptamers for P. aeruginosa,10 indicating a greater ease of formatting stable secondary structures. Moreover, the secondary structures shown in Fig. S2† demonstrated that the aptamer candidates identified via HTS could form more and complicated stem-loop branches around relatively small central loops, which might enable their accommodation at P. aeruginosa cell walls with increased specificity. Subsequently, all aptamer candidates obtained via HTS were assessed for their Kd values.
3.2 Kd values for aptamer candidates
To determine the Kd value of each aptamer candidate, CDs were prepared via the hydrothermal method with citric acid and ethylenediamine, as reported previously.14 Characterization of CDs synthesized herein is illustrated in Fig. S3†. The results (Fig. S3-A and B†) are consistent with previous findings,8,14 indicating that the CDs were successfully prepared and could be used as fluorophores.Subsequently, the obtained CDs were conjugated to amine-modified five aptamer candidates the via amide bond catalyzed by EDC and NHS.8 After conjugation, they were subjected to agarose gel electrophoresis. Fig. S3-C† shows that the CD-conjugated ssDNA (lanes 1–5) of aptamer candidates migrated slower than their unconjugated counterparts (lanes 6–10), owing to an increased mass-to-charge ratio because of ssDNA-CDs conjugation,8 indicating that the covalent bond between the CDs and aptamer candidates was successfully formed. Thereafter, the fluorescence emission spectra of the aptamer-CDs nanoconjugate was analysed again. Notably, a redshift of the fluorescence emission peak was observed for the ssDNA-CDs conjugates as compared with original CDs (Fig. S3-D†, the PA1-CDs was shown as an example, the rest four aptamer-CDs had the same results). Because the aptamers and CDs were covalently conjugated herein, it introduced numerous N atoms to CD surface. The introduction of N atoms to the CD surface would lead to a redshift for the N-CDs, attributing to the different directions and degrees of energy band bending from the interior to the exterior surface, induced by N radicals,18 which probably contributed to the redshift of aptamer-CDs obtained herein. Because of the redshift, the maximum fluorescence emission wavelength of 450 nm was used in all subsequent experiments.
On using the synthesized aptamer-CDs probes, Kd values of the three aptamer candidates could be determined. As shown in Table 1, the Kd values for the aptamer candidates of PA1, PA2, and PA4 were 15.16 ± 3.62 nM, 14.11 ± 2.59 nM, and 16.39 ± 8.14 nM (Fig. S4†), respectively, whereas those of PA3 and PA5 were both above 30 nM (Fig. S4†). Higher Kd values of aptamer candidates indicated weakened binding affinity to P. aeruginosa,10,19 hence, PA3 and PA5 were excluded from among the aptamer candidates. However, it was still difficult to determine which of the remaining three aptamer candidates (PA1, PA2, and PA4) had the highest specificity to P. aeruginosa and the lowest specificity to other interfering bacteria in accordance with their similar Kd values. To resolve this issue, three aptamer-CDs/GO systems using aptamer candidates of PA1, PA2, and PA4 were generated to implement the fluorescence assay.19–22
3.3 Specificity of aptamer candidates
The working principle of using aptamer-CDs/GO system for sensing and detecting P. aeruginosa was concurrent with that reported previously.22,23 As shown in Fig. 1, in the absence of GO, the fluorescence of aptamer-CDs was prominent (Fig. 1, blue curve). However, when they were mixed together, the aptamer-CDs were absorbed onto the surface of GO via π–π stacking interactions and the fluorescence of aptamer-CDs was quenched by GO through FRET from aptamer-CDs to GO.22,24 Thus, the background signal was reduced to minimum (Fig. 1, black curve). After P. aeruginosa was co-incubated with the aptamer-CDs/GO system, the aptamer-CDs would preferentially bind P. aeruginosa and the π–π stacking interactions between the aptamer-CDs and GO were interrupted. Thus, the aptamer-CDs were released from the GO sheet and fluorescence was significantly recovered (Fig. 1, red curve).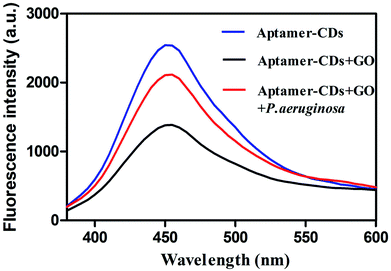 | ||
| Fig. 1 Working principle of the fluorescence assay to detect P. aeruginosa using aptamer-CDs/GO system. | ||
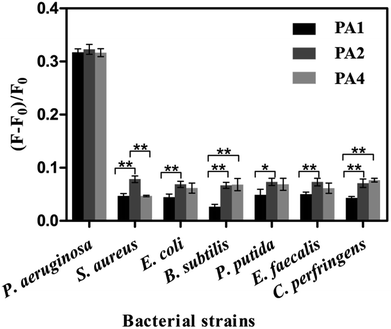
The working principle above facilitated the determination of the specificities of aptamer candidates. As illustrated in Fig. 2, when P. aeruginosa was subjected to the PA1-CDs/GO, PA2-CDs/GO, and PA4-CDs/GO systems, respectively, all fluorescence recovery ratios exceeded 30%. However, when six interfering bacteria, namely Pseudomonas putida, Enterococcus faecalis, Clostridium perfringens, E. coli, B. subtilis, and S. aureus, were subjected to these three aptamer-CDs/GO systems, fluorescence recovery ratios were less than 10%. Notably, only the PA1-CDs/GO system exhibited significantly lower (p < 0.05) fluorescence recovery ratios against every interfering bacterium (Fig. 2). Hence, aptamer candidate of PA1 had the highest specificity to the cells of P. aeruginosa and the lowest specificity to the cells of every interfering bacteria. Therefore, the PA1 was considered the most appropriate aptamer, with which the highly specific aptamer-CDs/GO system could be generated. This system facilitated the primary fluorescence assay in detecting P. aeruginosa (this aptamer-CDs/GO system could only identify the species of P. aeruginosa, but could not distinguish the different serotypes, Fig. S6†). However, more experimental conditions should be optimized to further improve this assay.
3.4 Optimization of reacting conditions
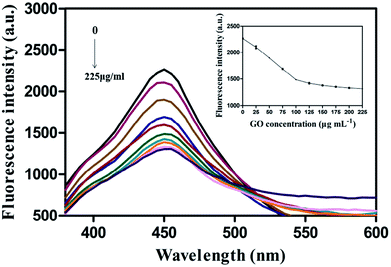
The fluorescence assay included five parameters, namely reaction pH, reaction temperature, aptamer-CDs probe concentration, GO concentration, and reacting time.The optimized concentration of the same aptamer-CDs probe was 15 μM, as reported previously.8 Furthermore, the CDs generated herein were pH-sensitive and their fluorescence intensity were stabilized at pH 7.5 after optimization.8 Hence, the conditions of 15 μM of PA1-CDs probe and pH 7.5 were followed here. Moreover, since the optimal growth temperature for P. aeruginosa is 37 °C, the reaction temperature of this aptamer-based assay was set to 37 °C. However, owing to the fluorescence of CDs being quenched by nano-graphite (NG) rather than GO in the previous study,8 the optimized concentration of GO for quenching the fluorescence of PA1-CDs probe warranted determination when using 15 μM of PA1-CDs probe at pH 7.5 and 37 °C. Fig. 3 shows that fluorescence intensity of PA1-CDs probe decreased with an increase in GO concentration from 0 to 150 μg mL−1. However, no increase was observed when GO concentration was greater than 150 μg mL−1. Therefore, 150 μg mL−1 was determined as the optimal GO concentration, this value being similar to that of NG for quenching the fluorescence of the same CDs.8
Finally, the reacting time for the incubation of the cells of P. aeruginosa with PA1-CDs/GO system was optimized under the previously optimized conditions. Fig. S5† showed that the fluorescence recovery ratio peaked at 60 min and did not increase any further after longer incubations; hence, 60 min was the selected as the optimal reaction time. Therefore, the final optimized experimental conditions for the aptamer-CDs/GO-mediated assay were as follows: 15 μM of aptamer-CDs probe, 150 μg mL−1 of GO, pH 7.5, 37 °C, and 60 min.
3.5 Analytical application
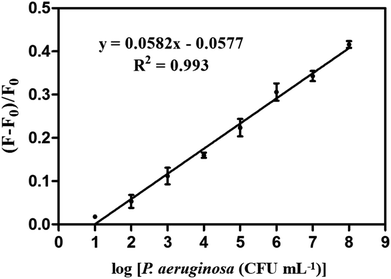
Under optimized conditions, fluorescence recovery ratios for the PA1-CDs/GO system with P. aeruginosa at different densities were determined to evaluate the application of this fluorescence assay. As illustrated in Fig. 4, fluorescence recovery ratios exhibited a linear correlation with various densities of P. aeruginosa ranged from 10 to 108 CFU mL−1, the calibration curve was expressed by the regression equation of (F − F0)/F0 = 0.0582![[thin space (1/6-em)]](https://www.rsc.org/images/entities/char_2009.gif) log[C (CFU mL−1)] − 0.057 with a correlation coefficient of 0.993 (F and F0 represented the fluorescence intensities excited from the aptamer-CDs/GO system in the presence and absence of P. aeruginosa, respectively). According to the equation, the limit of detection (LOD) was 9 CFU mL−1. The LOD was an important parameter reflecting the sensitivity of detection.3,16 Previously, an aptamer-based FISH assay was established for detecting P. aeruginosa. However, the LOD was unclear.10 The presently developed fluorescence assay approached a fine LOD that specified in a previous study on P. aeruginosa detection (10 CFU mL−1) based on magnetic enrichment and nested PCR.1 Nevertheless, our aptamer-CDs/GO mediated detecting assay was less time-consuming, indicating that this assay could achieve rapid and highly sensitive detection of P. aeruginosa.
log[C (CFU mL−1)] − 0.057 with a correlation coefficient of 0.993 (F and F0 represented the fluorescence intensities excited from the aptamer-CDs/GO system in the presence and absence of P. aeruginosa, respectively). According to the equation, the limit of detection (LOD) was 9 CFU mL−1. The LOD was an important parameter reflecting the sensitivity of detection.3,16 Previously, an aptamer-based FISH assay was established for detecting P. aeruginosa. However, the LOD was unclear.10 The presently developed fluorescence assay approached a fine LOD that specified in a previous study on P. aeruginosa detection (10 CFU mL−1) based on magnetic enrichment and nested PCR.1 Nevertheless, our aptamer-CDs/GO mediated detecting assay was less time-consuming, indicating that this assay could achieve rapid and highly sensitive detection of P. aeruginosa.
3.6 Evaluation for real samples of the assay
Our fluorescence assay was conducted at the optimized conditions as describes above. However, its application for actual samples under the natural conditions also warranted investigation to evaluate the practicality of this assay. This evaluation was completed in simulative samples of tap water and commercial bottled water, which were artificially contaminated by P. aeruginosa. Table 2 shows that the cell densities of P. aeruginosa experimentally detected using the presently developed fluorescence assay were like those obtained via microscopic enumeration in all the two samples, thereby indicating the applicability of this assay for water samples to detect potential P. aeruginosa contamination.4. Conclusions
In this study, an aptamer-CDs/GO-based fluorescence assay was developed for detecting P. aeruginosa. During SELEX, HTS facilitated clear recognition of aptamer candidates with high efficiency. This fluorescence assay exhibits high specificity and sensitivity. Moreover, this assay is easy to operate and comprises environmentally friendly materials. This assay has potential applications with actual water samples with satisfactory accuracy. These characteristics highlight that this assay is potential in the application of detecting the contamination of P. aeruginosa for the water quality supervision.Conflicts of interest
There are no conflicts to declare.Acknowledgements
This study was supported by China Postdoctoral Science Foundation (Grant No. 2016M590657) and National Natural Science Foundation of China (Grant No. 31500029).Notes and references
- Y. J. Tang, Z. Ali, J. Zou, K. Yang, X. B. Mou, Z. Y. Li, Y. Deng, Z. X. Lu, C. Ma, M. A. A. Shah, S. Elingarami, H. W. Yang and N. Y. He, J. Nanosci. Nanotechnol., 2014, 14, 4886–4890 CrossRef PubMed
.
- P. Deschaght, S. Van daele, F. De Baets and M. Vaneechoutte, J. Cystic Fibrosis, 2011, 10, 293–297 CrossRef PubMed
.
- N. Alizadeh, M. Y. Memar, S. R. Moaddab and H. S. Kafil, Biomed. Pharmacother., 2017, 93, 737–745 CrossRef PubMed
.
- M. R. Dunn, R. M. Jimenez and J. C. Chaput, Nat. Rev. Chem., 2017, 1, 0076 CrossRef
.
- N. Nguyen Quang, G. Perret and F. Duconge, Pharmaceuticals, 2016, 9, 76 CrossRef PubMed
.
- Y. S. Kim, N. H. A. Raston and M. B. Gu, Biosens. Bioelectron., 2016, 76, 2–19 CrossRef PubMed
.
- P. Namdari, B. Negahdari and A. Eatemadi, Biomed. Pharmacother., 2017, 87, 209–222 CrossRef PubMed
.
- L. Zhu, G. H. Xu, Q. Song, T. Tang, X. Wang, F. D. Wei and Q. Hu, Sens. Actuators, B, 2016, 231, 506–512 CrossRef
.
- M. Joo, S. H. Baek, S. A. Cheon, H. S. Chun, S. W. Choi and T. J. Park, Colloids Surf., B, 2017, 154, 27–32 CrossRef PubMed
.
- K. Y. Wang, Y. L. Zeng, X. Y. Yang, W. B. Li and X. P. Lan, Eur. J. Clin. Microbiol. Infect. Dis., 2011, 30, 273–278 CrossRef PubMed
.
- A. G. Souza, K. Marangoni, P. T. Fujimura, P. T. Alves, M. J. Silva, V. A. F. Bastos, L. R. Goulart and V. A. Goulart, Exp. Cell Res., 2016, 341, 147–156 CrossRef PubMed
.
- N. Duan, X. Y. Ding, S. J. Wu, Y. Xia, X. Y. Ma, Z. P. Wang and J. Chen, J. Microbiol. Methods, 2013, 94, 170–174 CrossRef PubMed
.
- M. Zuker, Nucleic Acids Res., 2003, 31, 3406–3415 CrossRef PubMed
.
- S. J. Zhu, Q. N. Meng, L. Wang, J. H. Zhang, Y. B. Song, H. Jin, K. Zhang, H. C. Sun, H. Y. Wang and B. Yang, Angew. Chem., Int. Ed., 2013, 52, 3953–3957 CrossRef PubMed
.
- S. H. Suh, H. P. Dwivedi, S. J. Choi and L. A. Jaykus, Anal. Biochem., 2014, 459, 39–45 CrossRef PubMed
.
- A. Abbaspour, F. Norouz-Sarvestani, A. Noon and N. Soltani, Biosens. Bioelectron., 2015, 68, 149–155 CrossRef PubMed
.
- J. Hoinka, A. Berezhnoy, P. Dao, Z. E. Sauna, E. Gilboa and T. M. Przytycka, Nucleic Acids Res., 2015, 43, 5699–5707 CrossRef PubMed
.
- S. L. Hu, R. X. Tian, Y. G. Dong, J. L. Yang, J. Liu and Q. Chang, Nanoscale, 2013, 5, 11665–11671 RSC
.
- S. H. Lee, J. Y. Ahn, K. A. Lee, H. J. Um, S. S. Sekhon, T. S. Park, J. Min and Y. H. Kim, Biosens. Bioelectron., 2015, 68, 272–280 CrossRef PubMed
.
- J. Teng, F. Yuan, Y. Ye, L. Zheng, L. Yao, F. Xue, W. Chen and B. Li, Front Microbiol., 2016, 7, 1426 Search PubMed
.
- M. Shandordizadeh, S. M. Taghdisi, N. Ansari, F. A. Langroodi, K. Abnous and M. Ramezani, Sens. Actuators, B, 2017, 241, 619–635 CrossRef
.
- Z. P. Liu and X. G. Su, Biosens. Bioelectron., 2017, 87, 66–72 CrossRef PubMed
.
- Z. M. Zhou, J. Zhou, J. Chen, R. N. Yu, M. Z. Zhang, J. T. Song and Y. D. Zhao, Biosens. Bioelectron., 2014, 59, 397–403 CrossRef PubMed
.
- Y. J. Guo, L. Deng, J. Li, S. J. Guo, E. K. Wang and S. J. Dong, ACS Nano, 2011, 5, 1282–1290 CrossRef PubMed
.
- Y. Lian, F. J. He, H. Wang and F. F. Tong, Biosens. Bioelectron., 2015, 65, 314–319 CrossRef PubMed
.
Footnotes |
| † Electronic supplementary information (ESI) available. See DOI: 10.1039/c8ra04819c |
| ‡ These authors contribute equally to this article. |
| This journal is © The Royal Society of Chemistry 2018 |

