 Open Access Article
Creative Commons Attribution 3.0 Unported Licence
Complete assignment of the vibrational spectra of borazine: the inorganic benzene
Stewart F. Parker
ISIS Facility, STFC Rutherford Appleton Laboratory, Chilton, Didcot, OX11 0QX, UK. E-mail: stewart.parker@stfc.ac.uk
First published on 29th June 2018
Abstract
Borazine continues to be relevant in industries as diverse as energy utilisation via fuel cells and as a possible route to boron nitride. Despite it having been known for almost a century, the vibrational spectroscopy of borazine is still incomplete. The inclusion of inelastic neutron scattering spectra has enabled the observation of all of the internal modes of borazine (including the infrared and Raman forbidden modes) for the first time. A complete assignment has been generated with the use of dispersion corrected DFT calculations. This has shown that the accepted ordering of the modes is incorrect in some cases and rationalised conflicting assignments in the literature.
Introduction
Borazine (1,3,5,2,4,6-triazatriborinane, B3N3H6, see Fig. 1 for the structure) was discovered in 1926 by Stock and Pohland1 as a product of the reaction of diborane and ammonia. It is isostructural and isoelectronic with benzene and, like benzene, is a colourless liquid under ambient conditions. The apparent similarity to benzene has led to borazine being called the ‘inorganic benzene’,2 although this view is not universally accepted.3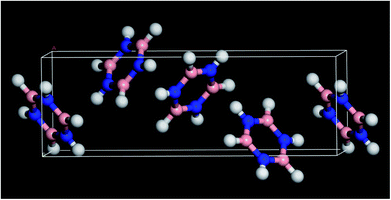 | ||
| Fig. 1 Solid state structure of borazine.3 Blue = nitrogen, pink = boron, white = hydrogen. | ||
Borazine is of current interest for two reasons: boron nitride and hydrogen storage. It can be used as a carbon-free precursor to boron nitride, with the advantage that the initial condensation to polyborazylene results in a processable material.4 Borazine is also used in preparative routes using chemical vapour deposition.5 In the area of hydrogen storage materials, borazine is an unwelcome by-product6 of the dehydrogenation of ammonia borane because it rapidly poisons the low temperature fuel cells that are often the destination of the released hydrogen.
The vibrational spectroscopy of borazine has been investigated many times over the years. However, the work has almost exclusively been concerned with gas phase infrared studies.7–11 The molecule offers multiple possibilities for isotopic substitution: 1,2H, 10,11B and 14,15N and many of the possible combinations have been examined. Apart from a brief conference report of the solid state infrared spectrum,12 there are no reported solid state spectra. The molecule has been analysed by normal coordinate analysis using empirical force fields13,14 and also by an ab initio study.15 The analysis of the spectra is greatly complicated by the fact that the free molecule has D3h symmetry (as shown by gas phase electron diffraction16) which results in three silent modes.
The purpose of the present work was to measure the vibrational infrared, Raman and inelastic neutron scattering (INS)17 spectra of the solid state for the first time and to assign these with periodic density functional theory calculations. The comparison of observed and calculated spectra has provided a complete assignment. INS spectroscopy has no selection rules, so all modes are allowed and the infrared and Raman inactive modes are observed for the first time.
Experimental
Borazine was obtained from Gelest and used as received. All operations involving transfer of borazine were conducted in a glovebox to avoid hydrolysis. Infrared spectra (2 cm−1 resolution, 256 scans) were recorded between 105 K and 298 K with a Bruker Vertex 70 Fourier transform infrared spectrometer using a Specac single reflection variable temperature attenuated total internal reflection accessory. Raman spectra were recorded in the range 13–235 K with a previously described18 Renishaw InVia system using 785 nm excitation and have been corrected for the instrument response. In this configuration the largest Raman shift obtainable is ∼3200 cm−1. INS spectra were recorded at <10 K using the TOSCA19 and MAPS20 spectrometers at ISIS.21 For TOSCA, only the data from the backscattering detectors was used, because the neutron absorption from 10B in the natural abundance borazine resulted in no usable data in the forward scattering detectors.Dispersion corrected periodic density functional theory (DFT-D) calculations were carried out using the plane wave pseudopotential method as implemented in the CASTEP code.22,23 Exchange and correlation were approximated using the PBE24 functional with the Tkatchenko–Scheffler (TS) dispersion correction scheme25 within the generalized gradient approximation (GGA). The plane-wave cut-off energy was 1000 eV. Brillouin zone sampling of electronic states was performed on 10 × 10 × 4 Monkhorst–Pack grid (30 k-points). The equilibrium structure, an essential prerequisite for lattice dynamics calculations was obtained by BFGS geometry optimization after which the residual forces were converged to ±0.00755 eV Å−1. Phonon frequencies were obtained by diagonalization of dynamical matrices computed using density-functional perturbation theory26 and also to compute the dielectric response and the Born effective charges, and from these the mode oscillator strength tensor and infrared absorptivity were calculated. In addition to the calculation of transition energies and intensities at zero wavevector, phonon dispersion was also calculated along high symmetry directions throughout the Brillouin zone. For this purpose, dynamical matrices were computed on a regular grid of wavevectors throughout the Brillouin zone and Fourier interpolation was used to extend the computed grid to the desired fine set of points along the high-symmetry paths.27 Transition energies (assuming the harmonic approximation) for isotopic species were calculated from the dynamical matrix that is stored in the CASTEP checkpoint file using the PHONONS utility.28 The atomic displacements in each mode that are part of the CASTEP output, enable visualization of the modes to aid assignments and are also all that is required to generate the INS spectrum using the program ACLIMAX.29 It is emphasised that for all the calculated spectra shown the transition energies have not been scaled.
Results
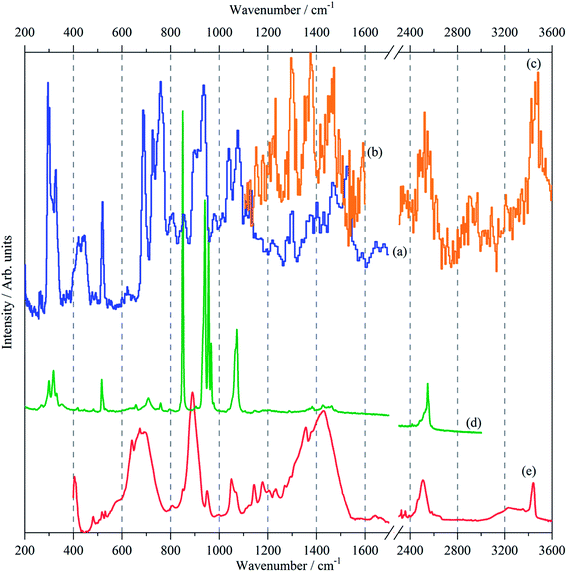
The vibrational spectra; infrared, Raman and INS, of borazine in the solid state are shown for the first time in Fig. 2. The complementarity of the three techniques is immediately apparent: modes that are strong in one technique are often weak or absent in the others. The transition energies are listed in Table 1. The mode numbering and descriptions are that of Niedenzu et al.10| Observeda cm−1 | CASTEPb cm−1 | Description | ||||
|---|---|---|---|---|---|---|
| Infrared | Raman | INS | Averagec | Ranged | Syme | |
| a s = strong, m = medium, w = weak, br = broad, sh = shoulder, v = very.b Transition energies at the at the Γ-point of the complete unit cell containing four molecules.c Average of the factor group split transition energies at the Γ-point.d Difference between the highest and lowest transition energy of the factor group at the Γ-point.e Mode number and symmetry label for the mode in D3h symmetry. | ||||||
| 303 w, 324 w, 338 w | 296 s, 302 s, 310 s, br 327 s | 326 | 49 | 20E′′ | Out-of-plane ring deformation | |
| 406 m, 410 sh | 399 m, br 421 m, br 443 m, br | 412 | 21 |  |
Out-of-plane ring deformation | |
| 517 vw, 522 vw, 530 vw | 516 w, 523 sh | 519 m | 514 | 5 | 17E′ | In-plane ring deformation |
| 682 vs, vbr | 710 w, br | 689 s | 698 | 25 |  |
Out-of-plane N–H bend |
| 761 w | 729 s, 758 s | 747 | 54 | 19E′′ | Out-of-plane N–H bend | |
| 850 s | 856 w | 841 | 1 |  |
In-plane sym ring deformation | |
| 890 vs, br | 910 br | 883 | 14 |  |
Out-of-plane B–H bend | |
| 896 | 21 | 18E′′ | Out-of-plane B–H bend | |||
| 932 sh, 942 s | 935 s | 918 | 9 | 15E′ | In-plane B–H bend + N–H bend + B–N stretch | |
| 950 w | 957 s | 924 | 4 |  |
In-plane B–N sym stretch (ring breathe) | |
| 1040 m | 1020 | 14 |  |
In-plane B–H bend | ||
| 1050 m, 1069 w | 1065 m, 1072 m | 1078 m | 1054 | 9 | 16E′ | In-plane N–H + B–H bend + B–N stretch |
| 1220 w | 1207 | 2 |  |
Asymmetric B–N stretch | ||
| 1297 m | 1276 | 6 |  |
In-plane N–H bend | ||
| 1356 w | 1325 vw | 1351 | 15 | 14E′ | Asymmetric B–N stretch | |
| 1430 vs, vbr | 1424 vw | 1421 | 29 | 13E′ | Asymmetric B–N stretch | |
| 2467 sh, 2506 m | 2565 | 22 | 12E′ | Asym B–H stretch | ||
| 2503 w, br 2547 w 2558 sh | 2581 | 6 |  |
Sym B–H stretch | ||
| 3421 w, sh | 3445 | 2 |  |
Sym N–H stretch | ||
| 3442 m | 3454 | 8 | 11E′ | Asym N–H stretch | ||
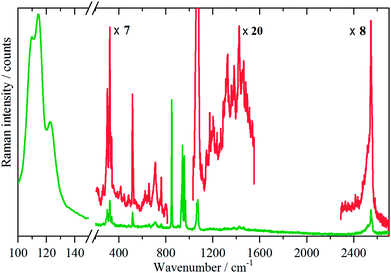
Variable temperature infrared spectra, Fig. 3, show that the molecule is unchanged between 258 and 105 K, in agreement with the X-ray structure determination.3 Further the spectra are almost indistinguishable from that of the liquid state, Fig. 3a. The low temperature, 15 K, Raman spectrum allows a number of very weak bands to be observed, Fig. 4. The symmetric N–H stretch is most easily seen in the Raman spectrum. Unfortunately, with 785 nm excitation the CCD cuts-off at ∼3200 cm−1, consequently it was not observed. However, the infrared spectrum shows a shoulder at 3421 cm−1 on the main asymmetric stretch band. The DFT calculations (see later) show that the symmetric mode is activated in the solid state and the band at 3421 cm−1 is assigned to this mode.
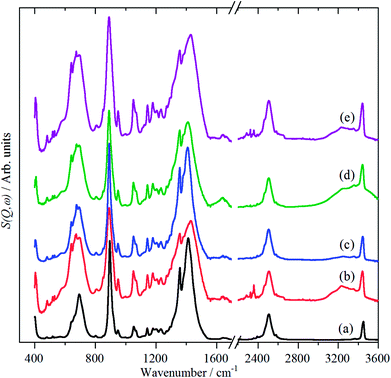 | ||
| Fig. 3 Vibrational temperature infrared spectra of borazine. (a) liquid at 298 K, solid at: (b) 258 K, (c) 213 K, (d) 160 K and (e) 105 K. The broad features at 1650 and 3300 cm−1 are due to ice. | ||
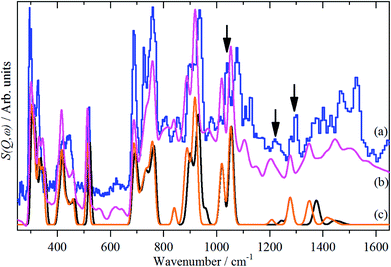
The INS spectra, Fig. 2a–c and 5, show that the solid state is more complicated than the infrared or Raman spectra suggest. This is evidenced by the complex band shapes of the modes in the 300–500 and 700–800 cm−1 regions. INS spectra have no selection rules, hence all modes are allowed, however, there is a strong “propensity rule” that modes that involve proton motion will dominate the spectra.17 Further, INS spectra depend on both energy transfer, ω (cm−1), and momentum transfer, Q (Å−1), thus are able to access the entire Brillouin zone, not just the Γ-point i.e. Q ∼0, as for infrared or Raman spectroscopies. Thus the complex band shapes indicate that there is clearly significant factor group splitting and/or vibrational dispersion present in this system.
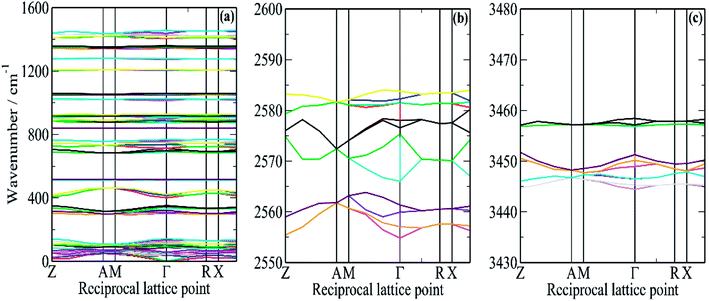
In order to better understand this system, periodic density functional theory (DFT) of the complete unit cell was employed. Borazine crystallises in the tetragonal space group, P43212, with four molecules in the unit cell (Z = 4)3 and this was used as the initial structure for the computational study. A series of calculations, using a range of cut-off energies and k-point grids, always resulted in imaginary modes, indicating that the structure was dynamically unstable. The vibrational spectroscopy shows no evidence for a structural phase change, suggesting that the model was inadequate in some way. The problem was resolved by the inclusion of the Tkatchenko and Scheffler (TS)25 semi-empirical dispersion correction for DFT. This attempts to account for non-covalent forces, such as hydrogen bonding and van der Waals interactions in the solid state. With the inclusion of the TS correction, all real modes were obtained across the entire Brillouin zone, Fig. 6.
It can be seen that for the modes in the 300–500 and 700–800 cm−1 regions that there is both strong dispersion: the mode at ∼400 cm−1 at the Γ-point has a transition energy of ∼450 cm−1 at the A and M points in the Brillouin zone. There is also a large factor group splitting: columns 4 and 5 of Table 1 show the average and the range (defined as highest–lowest transition energy) of the factor group components.
Fig. 5a and b compares the observed and calculated INS spectra of borazine in the internal mode region. It can be seen that there is generally good agreement for both the transition energies and their intensities.
Discussion
Unlike ammonia–borane, H3N–BH3,30 the structure shows no evidence for dihydrogen bonding, which is characterised by approximately linear N–H⋯H bonds and bent B–H⋯H bonds.30 In the geometry optimised structure the shortest H⋯H distance is 2.512 Å, outside the accepted range of 1.7–2.2 Å and larger than twice the van der Waals radius of hydrogen, 2.4 Å. Although borazine has a gas phase dipole moment of <0.1 D16 (and zero for the ideal D3h structure), the calculations do show significant charge on the atoms: N: −0.92/−0.21, B: +0.52/+0.15, H(N): +0.42/+0.12 and H(B): −0.01/−0.06 electrons for the Mulliken and Hirschfeld charges respectively.The good agreement between the observed and calculated spectra in Fig. 5, enables unambiguous assignments from the mode visualisations to be made. These are listed in Table 2 and compared to those in the literature. In D3h symmetry,  , E′ and E′′ are Raman active,
  and E′ are infrared active and
  are inactive in both, note that all modes are allowed in the INS spectrum. For the
  and
and  modes there is general agreement on the assignments and this work confirms these. For the E′ modes, there is confusion over the ordering of modes 15 and 16. These are described as in-plane bending modes of B–H and N–H respectively.10 The mode animations show that these are in fact more complex and are coupled vibrations involving B–H and N–H bending as well as B–N stretching. On the basis of the relative amplitudes of the motion, mode 16 is assigned at 1078 cm−1 (N–H bend) and mode 15 at 935 cm−1 (B–H bend).
| Mode no. | Sym | This work | (Ref. 7) 1939 | (Ref. 10 and 13) 1970 | (Ref. 11) 1971 | (Ref. 15) 1991 | Description (method)c | |
|---|---|---|---|---|---|---|---|---|
| Calc.a | Obs.b | |||||||
| a Average of the factor group split transition energies at the Γ-point.b Transition energy of the strongest mode in the spectra closest in energy to the calculated value.c Calculated from the force field, not observed.d Method is the technique where the mode is best observed; INS (INS), Raman (R) or infrared (IR).e This entry is the centre frequency of the complex line shape resulting from both dispersion and a large factor group splitting in this mode. | ||||||||
| 1 |  |
3475 | 3421 | 3450 | 3452 | 3488 | 3649 | Sym N–H stretch (R) |
| 2 |  |
2553 | 2547 | 2535 | 2535 | 2545 | 2708 | Sym B–H stretch (R) |
| 3 |  |
920 | 957 | 938 | 940 | 940 | 958 | In-plane B–N sym stretch (ring breathe) (R) |
| 4 |  |
839 | 850 | 851 | 852 | 845 | 869 | In-plane sym ring deformation (R) |
| 5 |  |
1207 | 1220 | (1650)d | 1332 | Asym B–N stretch (INS) | ||
| 6 |  |
1020 | 1040 | (1110)d | 1195 | 1266 | In-plane B–H bend (INS) | |
| 7 |  |
1276 | 1297 | (800)d | 782 | 1069 | In-plane N–H bend (INS) | |
| 8 |  |
883 | 910 | 1098 | 917 | 913 | 943 | Out-of-plane B–H bend (IR) |
| 9 |  |
698 | 682 | 628 | 719 | 718 | 751 | Out-of-plane N–H bend (IR) |
| 10 |  |
412 | 431e | 415 | 394 | 403 | 396 | Out-of-plane ring deformation (IR) |
| 11 | E′ | 3475 | 3442 | 3400 | 3486 | 3482 | 3652 | Asym N–H stretch (IR) |
| 12 | E′ | 2543 | 2506 | 2519 | 2520 | 2513 | 2698 | Asym B–H stretch (IR) |
| 13 | E′ | 1421 | 1430 | 1610 | 1465 | 1458 | 1524 | Asym B–N stretch (IR) |
| 14 | E′ | 1351 | 1356 | 1466 | 1406 | 1394 | 1422 | Asym B–N stretch (IR) |
| 15 | E′ | 918 | 935 | 917 | 1096 | 1102 | 1098 | In-plane B–H bend + N–H bend + B–N stretch (INS) |
| 16 | E′ | 1051 | 1078 | 717 | 990 | 1068 | 963 | In-plane N–H + B–H bend + B–N stretch (INS) |
| 17 | E′ | 514 | 519 | 525 | 518 | 518 | 523 | In-plane ring deformation (INS) |
| 18 | E′′ | 896 | 890 | 1070 | 968 | 977 | 934 | Out-of-plane B–H bend (IR) |
| 19 | E′′ | 747 | 758 | 798 | 798 | 770 | 727 | Out-of-plane N–H bend (INS) |
| 20 | E′′ | 326 | 296 | 288 | 288 | 280 | 283 | Out-of-plane ring deformation (INS) |
The assignment of the highest energy E′′ mode is also debated. It is usually assigned to the weak band at 967 cm−1. However, our calculations show no mode at this energy and the INS spectrum only shows a very weak mode. This is inconsistent with it being the B–H out-of-plane bend, which would have a large amplitude of motion of the proton and hence strong INS intensity. The present work locates this mode at 890 cm−1 (896 cm−1 calculated).
The modes that were least certain are the in-plane  modes, 5, 6 and 7, which are described as asymmetric B–N stretching, B–H and N–H bending respectively. Fig. 7 shows the atomic displacements for the calculated modes at 1279, 1215 and 1026 cm−1 respectively. It is apparent that these correspond to modes 7, 5 and 6.
The INS spectra, Fig. 2a–c and 5, provide the first experimental observation of the modes at 1220, 1040 and 1297 cm−1 for modes 5, 6 and 7 respectively. The only previous claim11 was by infrared spectroscopy of matrix isolated borazine. Two weak modes were seen which were believed to be combinations involving modes 6 and 7. This work shows that those assignments are incorrect.
Borazine containing natural abundance boron (20% 10B, 80% 11B) was used for this work. This leads to the question as to whether this is manifested in the spectra. In the gas phase and in a matrix, weak 10B satellite peaks are observed for some of the modes,9,11 I have shown previously how the isotopic distribution in a crystal may be calculated,31 and for natural abundance borazine with four molecules in the primitive cell, the largest constituents are: (10B11B11B, 10B11B11B, 11B11B11B, 11B11B11B) = 23.19% and (10B11B11B, 11B11B11B, 11B11B11B, 11B11B11B) = 20.62%, the all-11B species is only a minor constituent, 6.87%. Fig. 5c shows the calculated INS spectra for the most extreme compositions: all 10B and all 11B. It can be seen that the difference is small for most of the modes.
Conclusions
Despite it having been known for almost a century, the vibrational spectroscopy of borazine was still incomplete. The inclusion of INS spectra has enabled the observation of all of the internal modes of borazine for the first time. A complete assignment has been generated with the use of DFT-D calculations. This has shown that the accepted ordering of the modes is incorrect in some cases and rationalised conflicting assignments in the literature.Conflicts of interest
There are no conflicts of interest to declare.Acknowledgements
The STFC Rutherford Appleton Laboratory is thanked for funding and access to neutron beam facilities. Computing resources (time on the SCARF compute cluster for the CASTEP calculations) were provided by STFC's e-Science facility.References
- A. Stock and E. Pohland, Ber. Dtsch. Chem. Ges., 1926, 59, 2215–2223 CrossRef.
- N. N. Greenwood and A. Earnshaw, Chemistry of the Elements, Pergamon Press, Oxford, 1984, p. 238 Search PubMed.
- R. Boese, A. H. Maulitz and P. Stellberg, Chem. Ber., 1994, 127, 1887–1889 CrossRef.
- P. J. Fazen, E. E. Remsen, J. S. Beck, P. J. Carroll, A. R. McGhie and L. G. Sneddon, Chem. Mater., 1995, 7, 1942–1956 CrossRef.
- K. K. Kim, A. Hsu, X. Jia, S. M. Kim, Y. Shi, M. Dresselhaus, T. Palacios and J. Kong, ACS Nano, 2012, 6, 8583–8590 CrossRef PubMed.
- A. Al-Kukhun, H. T. Hwang and A. Varma, Ind. Eng. Chem. Res., 2011, 50, 8824–8835 CrossRef.
- B. L. Crawford and J. T. Edsall, J. Chem. Phys., 1939, 7, 223–232 CrossRef.
- E. Silberman, Spectrochim. Acta, 1967, 28A, 2021–2028 CrossRef.
- V. B. Kartha, S. L. N. G. Krisnamachari and C. R. Subramaniam, J. Mol. Spectrosc., 1967, 23, 149–157 CrossRef.
- K. Niedenzu, W. Sawodny, H. Watanabe, J. W. Dawson, T. Totani and W. Weber, Inorg. Chem., 1967, 6, 1453–1461 CrossRef.
- A. Kaldor and R. F. Porter, Inorg. Chem., 1971, 10, 775–785 CrossRef.
- E. Huler, E. Silberman and E. A. Jones, Bull. Am. Phys. Soc., 1970, 15, 177 Search PubMed.
- K. Blick, J. W. Dawson and K. Nidenzu, Inorg. Chem., 1970, 9, 1416–1421 CrossRef.
- E. Huler, E. Silberman and E. A. Jones, Spectrochim. Acta, 1970, 26A, 2241–2246 CrossRef.
- F. Ramondo, G. Portalone and L. Bencivenni, J. Mol. Struct.: THEOCHEM, 1991, 236, 29–39 CrossRef.
- W. Harshbarger, G. H. Lee II, R. F. Porter and S. H. Bauer, Inorg. Chem., 1969, 8, 1683–1689 CrossRef.
- P. C. H. Mitchell, S. F. Parker, A. J. Ramirez-Cuesta and J. Tomkinson, Vibrational spectroscopy with neutrons, with applications in chemistry, biology, materials science and catalysis, World Scientific, Singapore, 2005 Search PubMed.
- M. A. Adams, S. F. Parker, F. Fernandez-Alonso, D. J. Cutler, C. Hodges and A. King, Appl. Spectrosc., 2009, 63, 727–732 CrossRef PubMed.
- D. Colognesi, M. Celli, F. Cilloco, R. J. Newport, S. F. Parker, V. Rossi-Albertini, F. Sacchetti, J. Tomkinson and M. Zoppi, Appl. Phys. A, 2002, 74(suppl.), S64–S66 CrossRef.
- S. F. Parker, D. Lennon and P. W. Albers, Appl. Spectrosc., 2011, 65, 1325–1341 CrossRef.
- http://www.isis.stfc.ac.uk.
- S. J. Clark, M. D. Segall, C. J. Pickard, P. J. Hasnip, M. J. Probert, K. Refson and M. C. Payne, Z. Kristallogr., 2005, 220, 567–570 Search PubMed.
- K. Refson, P. R. Tulip and S. J. Clark, Phys. Rev. B: Condens. Matter Mater. Phys., 2006, 73, 155114 CrossRef.
- J. Perdew, K. Burke and M. Ernzerhof, Phys. Rev. Lett., 1996, 77, 3865 CrossRef PubMed.
- A. Tkatchenko and M. Scheffler, Phys. Rev. Lett., 2009, 102, 073005 CrossRef PubMed.
- V. Milman, A. Perlov, K. Refson, S. J. Clark, J. Gavartin and B. Winkler, J. Phys.: Condens. Matter, 2009, 21, 485404 CrossRef PubMed.
- X. Gonze, J.-C. Charlier and M. P. Teter, Phys. Rev. B, 1994, 50, 13035–13038 CrossRef.
- K. Refson, Phonons and Related Calculations in CASTEP, http://www.castep.org/.
- A. J. Ramirez-Cuesta, aCLIMAX 4.0.1, Comput. Phys. Commun., 2004, 157, 226–238 CrossRef.
- W. T. Klooster, T. F. Koetzle, P. E. M. Siegbahn, T. B. Richardson and R. H. Crabtree, J. Am. Chem. Soc., 1999, 121, 6337–6343 CrossRef.
- S. F. Parker, Spectrochim. Acta, Part A, 2015, 140, 462–464 CrossRef PubMed.
| This journal is © The Royal Society of Chemistry 2018 |

