 Open Access Article
Harzianumnones A and B: two hydroxyanthraquinones from the coral-derived fungus Trichoderma harzianum†
Ting Shiab,
Xue-Mei Houab,
Zhi-Yong Lic,
Fei Caod,
Ya-Hui Zhangab,
Jia-Yin Yuab,
Dong-Lin Zhaoab,
Chang-Lun Shao*ab and
Chang-Yun Wang *abe
*abe
aKey Laboratory of Marine Drugs, The Ministry of Education of China, School of Medicine and Pharmacy, Ocean University of China, Qingdao 266003, People's Republic of China. E-mail: changyun@ouc.edu.cn; Tel: +86-532-8203-1536
bLaboratory for Marine Drugs and Bioproducts, Qingdao National Laboratory for Marine Science and Technology, Qingdao 266071, People's Republic of China
cMarine Biotechnology Laboratory, State Key Laboratory of Microbial Metabolism, School of Life Sciences & Biotechnology, Shanghai Jiao Tong University, Shanghai 200240, People's Republic of China
dKey Laboratory of Pharmaceutical Quality Control of Hebei Province, College of Pharmaceutical Sciences, Hebei University, Baoding 071002, People's Republic of China
eInstitute of Evolution & Marine Biodiversity, Ocean University of China, Qingdao 266003, People's Republic of China
First published on 2nd August 2018
Abstract
Two new hydroxyanthraquinones, harzianumnones A (1) and B (2), together with seven known analogs (3–9), were isolated from the soft coral-derived fungus Trichoderma harzianum (XS-20090075). Their chemical structures were elucidated by extensive spectroscopic investigation. The absolute configurations of 1 and 2 were determined by ECD calculation and single-crystal X-ray diffraction. Compounds 1 and 2 were identified as a pair of epimers, which are the first example of hydroanthraquinones from T. harzianum. Compounds 7 and 8 exhibited cytotoxicity against hepatoma cell line HepG2 with IC50 values of 2.10 and 9.39 μM, respectively. Compound 7 was still found to show cytotoxicity against cervical cancer cell line HeLa with an IC50 value of 8.59 μM.
Introduction
Marine-derived fungi have been proven to play an important role in drug discovery in recent years due to their outstanding abilities to produce bioactive natural products.1,2 Anthraquinones constitute a large group of quinoid compounds with more than 700 molecules described to date, among which almost 50 anthraquinones were obtained from marine fungi.3 The diverse activities of anthraquinones derived from marine fungi, including cytotoxic, antiviral, antimicrobial and other activities, have attracted much interest for drug discovery. Several marine fungus-derived anthraquinones with strong activities have exhibited the potential to be developed into drug leads. For example, compound SZ-685C, a hydroanthraquinone isolated from marine fungus Halorosellinia sp., showed potent cytotoxic activities.4–6 Aspergilols H and I, hydroxyanthraquinones isolated from marine sediment-derived fungus Aspergillus versicolor, exhibited evident antiviral activity towards HSV-1.7 And 8-hydroxyconiothyrinone B, isolated from alga-derived fungus Talaromyces islandicus, displayed strong antioxidant activity.8During our ongoing investigation of new bioactive marine natural products, we have also obtained more than ten active anthraquinone derivatives from marine-derived fungi, such as antibacterial 4a-epi-9α-methoxydihydrodeoxybostrycin and 10-deoxybostrycin,9 and antiviral tetrahydroaltersolanol C.10 Recently, a fungal strain Trichoderma harzianum (XS-20090075), isolated from an unidentified soft coral collected from the South China Sea, has attracted our attention. The HPLC analysis of the EtOAc extract of its fermentation broth showed a series of characteristic UV absorptions of anthraquinones, including the benzenoid bands of strong absorption at 240–260 nm and medium absorption at 320–330 nm, and the quinonoid band at 260–290 nm.3 Further chemical investigation of the organic extracts led to the isolation of nine hydroxyanthraquinones including two new hydroxyanthraquinones. The bioactivities, including cytotoxic and DNA topoisomerase I (Topo I) inhibitory activities, were evaluated for the isolated compounds. Herein we report the isolation, structure elucidation and bioactivities of these anthraquinones.
Results and discussion
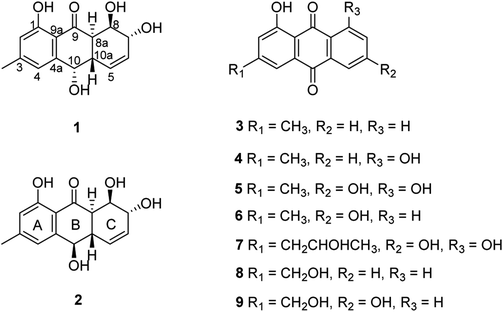
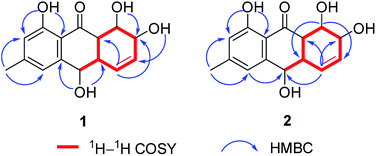
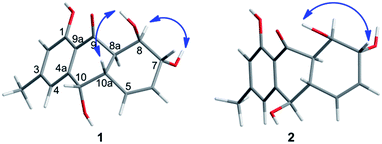
The chemical investigation of the EtOAc extract of the fermentation broth from the fungal strain T. harzianum (XS-20090075) led to the isolation of two new anthraquinones, harzianumnones A (1) and B (2), as well as seven known analogs, pachybasin (3),11 chrysophanol (4),12 frangula-emodin (5),13 phomarin (6),14 (+)-2′S-isorhodoptilometrin (7),15 1-hydroxy-3-hydroxymethylanthraquinone (8),16 and ω-hydroxydigitoemodin (9)17 (Fig. 1). Compounds 1–9 are hydroxyanthraquinones, among them 1 and 2 are hydroanthraquinones with the skeleton characterizing of reduced B and C rings. Compounds 3 and 4 were the major secondary metabolites. These two compounds were well-known phytotoxic anthraquinones and were reported to have antifungal activities.18–20Harzianumnone A (1) was obtained as yellow crystals. The molecular formula of C15H16O5 was determined by HRESIMS showing the [M + H]+ peak at m/z 277.1071 (calcd for C15H17O5, 277.1071) and indicating eight degrees of unsaturation. The IR absorption band at 3422 and 1634 cm−1 suggested the presence of hydroxyl and conjugated carbonyl groups respectively. The 1H NMR spectrum (Table 1) displayed two aromatic protons (H-2 and H-4), two olefinic protons (H-5 and H-6), three oxymethines (H-7, H-8 and H-10), two methines (H-8a and H-10a), one methyl group (H-11), and four active hydrogen signals (1-OH, 7-OH, 8-OH and 10-OH). The 13C NMR spectroscopic data (Table 1) showed one carbonyl group, six aromatic carbon atoms, two olefinic carbons, three oxymethines, two methines and one methyl. These spectroscopic features suggested that 1 belongs to the family of hydroxyanthraquinone. Further investigation the literature indicated that the NMR data of 1 was very similar with that of coniothyrinone A (Fig. 2), which was first isolated from the culture of Coniothyrium sp., an endophytic fungus isolated from the plant Salsola oppositifolia growing on Gomera, in the Canary Islands.21,22 Carefully analysis the NMR spectra indicated that 1 showed the same planar structure with coniothyrinone A. The most obvious differences were the small coupling constant (J = 1.5 Hz) between H-8 and H-8a in 1, instead of the large coupling constant (J = 10.3 Hz) in coniothyrinone A, and the shifted upfield C-7, C-8 and C-8a in 1 (δC 68.1, 67.1 and 42.0 ppm in 1 vs. 73.6, 74.5 and 45.6 ppm in coniothyrinone A), indicating different configurations of these two compounds. Detailed analysis of the HMQC, COSY, and HMBC spectra (Fig. 3) confirmed the assignment for all carbon and proton resonances of 1. The relative configuration of 1 was determined by 1H–1H coupling constants and NOESY correlations (Fig. 4). The NOESY correlations between 7-OH and H-8 indicated the trans-relationship of H-7/H-8, confirmed by the large coupling constant of H-7/H-8 (J = 8.9 Hz). The small coupling constant between H-8 and H-8a (J = 1.5 Hz) indicated the same orientation of H-8 and H-8a. The cross peak of 8-OH/H-10a in NOESY suggested that H-8/H-10a are in the different orientation. The trans-annulation of rings B and C was determined by large coupling constant of H-8a/H-10a (J = 12.0 Hz). The small coupling constant between H-10 and H-10a (J = 2.6 Hz) indicated β equatorial orientation of H-10. Thus, the relative configuration of 1 was determined as 7R*,8R*,8aR*,10S*,10aS*.
| No. | 1 | 2 | ||
|---|---|---|---|---|
| δC, type | δH, multiplicity (J in Hz) | δC, type | δH, multiplicity (J in Hz) | |
| 1 | 161.6, C | 161.6, C | ||
| 2 | 116.9, CH | 6.74, s | 115.6, CH | 6.68, s |
| 3 | 148.0, C | 147.6, C | ||
| 4 | 121.3, CH | 6.75, s | 117.8, CH | 7.06, s |
| 4a | 145.7, C | 149.2, C | ||
| 5 | 131.5, CH | 5.82, dd (10.0, 1.4) | 129.1, CH | 6.18, d (10.1) |
| 6 | 128.4, CH | 5.71, m | 128.3, CH | 5.79, m |
| 7 | 68.1, CH | 3.79, dd (8.9, 4.7) | 67.8, CH | 3.77, m |
| 8 | 67.1, CH | 4.41, m | 66.6, CH | 4.37, m |
| 8a | 42.0, CH | 3.06, dd (12.0, 1.5) | 46.8, CH | 2.65, d (12.5) |
| 9 | 205.2, C | 203.9, C | ||
| 9a | 113.3, C | 113.5, C | ||
| 10 | 68.4, CH | 4.74, dd (5.5, 2.6) | 69.5, CH | 4.40, d (10.0) |
| 10a | 37.3, CH | 2.84, br d (12.0) | 40.1, CH | 2.64, dd (12.5, 10.0) |
| 11 | 21.6, CH3 | 2.32, s | 21.9, CH3 | 2.33, s |
| 1-OH | 12.53, s | 12.54, s | ||
| 7-OH | 5.03, d (4.7) | 5.02, br s | ||
| 8-OH | 4.86, d (3.9) | 4.88, br s | ||
| 10-OH | 5.32, d (5.5) | 5.87, br s | ||
 | ||
| Fig. 2 Chemical structures of coniothyrinone A and rubrumol.18,19 | ||
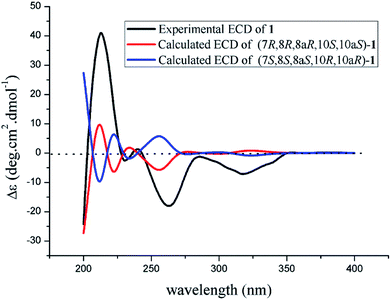
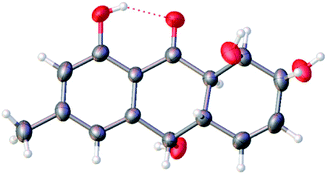
The theoretical calculated electronic circular dichroism (ECD) method was used to elucidate the absolute configuration of 1. The conformational searches of (7R,8R,8aR,10S,10aS)-1 were carried out by the MMFF94S method. The result showed 10 lowest energy conformers with relative energies from 0 to 10 kcal mol−1. The first optimization was at the set of gas-phase B3LYP/6-31G(d) level using the Gaussian 09 package, resulting in 5 conformers whose relative energies were within 2.5 kcal mol−1. Then the conformers were reoptimized at the set of gas-phase B3LYP/6-311+G(d). The total 60 electronic excited states were calculated at the set of gas-phase B3LYP/6-311++G(2d,p). ECD simulations were used by Boltzmann statistics with a standard deviation of σ 0.16 eV. The theoretical ECD spectrum for (7S,8S,8aS,10R,10aR)-1 was obtained by directly reversing the spectrum of (7R,8R,8aR,10S,10aS)-1. The experimental ECD spectrum of 1 showed the first positive (213 nm), second negative (262 nm), and third negative (322 nm) Cotton effects, matching well with the theoretical ECD spectrum for (7R,8R,8aR,10S,10aS)-1 between 200 and 400 nm (Fig. 5), which confirmed the absolute structure of 1. Fortunately, by slowly crystallization from the mixture of MeOH and H2O, single crystals of 1 suitable for X-ray diffraction analysis using Cu Kα radiation were obtained. Thus, the absolute configuration of 1 was established unambiguously as (7R,8R,8aR,10S,10aS) with the Flack's parameter of 0.0(3) (Fig. 6).
Harzianumnone B (2) was obtained as yellow powder with the molecular formula of C15H16O5 determined by HRESIMS indicating eight degrees of unsaturation and had the same molecular formula as 1. The 1H NMR and 13C NMR spectra data (Table 1) of 2 showed strong similarities to those of 1. Careful analysis of the NMR data indicated the same planar structure of 2 as 1. The very difference was the coupling constants of H-10/H-10a (J = 10.0 Hz in 2 vs. J = 2.6 Hz in 1), indicating different orientation of H-10a/H-10. Combining with the NOESY analysis (Fig. 4), the relative configuration of 2 was deduced as 7R*,8R*,8aR*,10R*,10aS*.
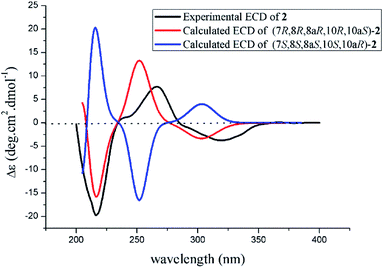
The absolute configuration of 2 was also confirmed by ECD calculation. The Cotton effects of the experimental ECD spectrum of 2 were different with that of 1 between 200 and 400 nm. It was found that the features of ECD spectra were characterized as the first negative (217 nm) and second positive (269 nm) Cotton effects in 2 vs. the first positive (213 nm) and second negative (262 nm) Cotton effects in 1 (Fig. 5 and 7). And the experimental ECD spectrum of 2 matched well with the calculated ECD spectrum of (7R,8R,8aR,10R,10aS)-2. Therefore, the absolute configuration of 2 was determined as 7R,8R,8aR,10R,10aS, only the configuration at C-10 differing from that of 1, indicating that 2 was an epimer of 1.
Compounds 1–9 were evaluated for their DNA topoisomerase I (Topo I) inhibitory activity. Compounds 5, 7, and 8 displayed moderate activity with the MIC values of 100, 100, and 50.0 μM, respectively (Fig. S21†). Interestingly, compounds 1 and 2 showed no activity, while rubrumol (Fig. 2), a hydroanthraquinone with the same planar structure as 1 and 2 obtained from a halo-tolerant endophytic fungus Eurotium rubrum isolated from a salt-tolerance wild plant S. salsa L. collected from ‘BoHai’ seaside, was reported to exhibit Topo I inhibitory activity (IC50 = 23 μM).19 It was indicated that the stereochemistry especially the absolute configurations of 7-OH and 8-OH of these hydroxyanthraquinones should be important for their activities.
It should be noted that topoisomerases are essential enzymes involved in all processes of DNA metabolism, and their inhibitors have been identified as potential anticancer agents.23,24 In the present study, compounds 5, 7 and 8 with Topo I inhibition activities were further assessed for their cytotoxic activities against human tumor cell lines, including HCT-116, SW480, A549, HepG2, HeLa, and PANC-1. Compounds 7 and 8 exhibited cytotoxic activity against HepG2 cell line with the IC50 values of 2.10 and 9.39 μM, respectively. Compound 7 showed cytotoxicity against HeLa cell line with an IC50 value of 8.59 μM (Table S1†). In a previous report, compound 7 was found to have cytotoxic activity against Hep G2 cell line.25 Compound 7 was also found cytotoxicity towards K562 cell line.26 In the present study, it was the first time to report the cytotoxicities of compounds 7 and 8 against HeLa and Hep G2 cell lines, respectively.
All the isolated compounds (1–9) were also evaluated for their and acetylcholinesterase (AChE) inhibitory activities. Compounds 3, 4, 6, 7 and 9 exhibited weak AChE inhibitory activity at the concentration of 100 μM. Additionally, compounds 1–9 were evaluated for their antibacterial activity against pathogenic bacteria S. aureus, E. coli and P. aeruginosa. Compounds 5, 7 and 8 showed moderate antibacterial activity against S. aureus with the MIC values of 6.25, 25.0, 25.0 μM, respectively.
Experimental section
General experimental procedure
Optical rotations were measured on a JASCO P-1020 digital polarimeter. UV spectra were recorded on a Beckman DU 640 spectrophotometer. ECD spectra were obtained on a Jasco J-815-150S circular dichroism spectrometer. IR spectra were recorded on a Nicolet-Nexus-470 spectrometer using KBr pellets. NMR spectra were measured on an Agilent DD2 500 MHz NMR spectrometer (500 MHz for 1H and 125 MHz for 13C), using TMS as an internal standard. The ESIMS and HRESIMS spectra were obtained from a Micromass Q-TOF spectrometer and a Thermo Scientific LTQ Orbitrap XL spectrometer, respectively. The crystallographic data were collected on a Bruker SMART APEX-II CCD diffractometer equipped with graphite monochromatized Cu Kα radiation (λ = 1.54184 Å). Semi-preparative HPLC was performed on a Waters 1525 system coupled with a Waters 2996 photodiode array detector. A Kromasil C18 semi-preparative HPLC column (250 × 10 mm, 5 μm) was used. Silica gel (Qing Dao Hai Yang Chemical Group Co.; 200–300 mesh), Sephadex LH-20 (Amersham Biosciences) and octadecylsilyl silica gel (Unicorn; 45–60 μm) were used for column chromatography. Precoated silica gel GF254 plates (Yantai Zifu Chemical Group Co., Yantai, People's Republic of China) were used for thin-layer chromatography.Fungal material
The fungal strain Trichoderma harzianum (XS-20090075) was isolated from a piece of fresh tissue from the inner part of a soft coral, collected from Xisha Islands coral reef in the South China Sea in September 2009. The strain was deposited in the Key Laboratory of Marine Drugs, the Ministry of Education of China, School of Medicine and Pharmacy, Ocean University of China, Qingdao, China.Identification of fungal cultures
The fungus was identified as Trichoderma harzianum according to its morphological traits and a molecular protocol by amplification and sequencing of the DNA sequences of the ITS region of the rRNA gene as described previously.9 The fungus was identified as T. harzianum whose 622 base pair ITS sequence had 99% sequence identity to that of T. harzianum E11F (KY425721). The sequence data have been submitted to GenBank with accession number KU866299.Extraction and isolation
The fungal strain Trichoderma harzianum (XS-20090075) was fermented in a PDA medium in 150 Erlenmeyer flasks with each flask contained 400 mL medium at room temperature without shaking for 45 days. The culture (60 L) was filtered to separate the broth from the mycelia. Then the mycelia were extracted three times with EtOAc (3 × 4000 mL). The broth was extracted repeatedly with EtOAc (3 × 60 L) to get the EtOAc layer. All the extracts were combined and were evaporated to dryness under reduced pressure to afford a residue (72.6 g). The residue was subjected to vacuum liquid chromatography (VLC) on silica gel using step gradient elution with EtOAc–petroleum ether (PE) (0–100%) and then with MeOH–EtOAc (0–100%) to afford thirteen fractions (Fr. 1–Fr. 13). Fr. 4 was isolated by column chromatography (CC) on silica gel eluted with PE–EtOAc (0–60%) to afford five fractions (Fr. 4.1–Fr. 4.5). Fr. 4.3 was purified by using semi-preparative HPLC on an ODS column (Kromasil C18, 250 × 10 mm, 5 μm, 2 mL min−1) eluted with 80% MeOH–H2O to give compounds 3 (3.0 mg) and 4 (2.8 mg). Fr. 4.5 was subjected to Sephadex LH-20 CC with PE–CHCl2–MeOH (v/v/v, 2![[thin space (1/6-em)]](https://www.rsc.org/images/entities/char_2009.gif) :
:![[thin space (1/6-em)]](https://www.rsc.org/images/entities/char_2009.gif) 1
1![[thin space (1/6-em)]](https://www.rsc.org/images/entities/char_2009.gif) :
:![[thin space (1/6-em)]](https://www.rsc.org/images/entities/char_2009.gif) 1) to give compound 5 (23.1 mg). Fr. 5 was first separated on silica gel CC eluting with CH2Cl2–MeOH (v/v, 100
1) to give compound 5 (23.1 mg). Fr. 5 was first separated on silica gel CC eluting with CH2Cl2–MeOH (v/v, 100![[thin space (1/6-em)]](https://www.rsc.org/images/entities/char_2009.gif) :
:![[thin space (1/6-em)]](https://www.rsc.org/images/entities/char_2009.gif) 3), then isolated on Sephadex LH-20 CC with CH2Cl2–MeOH (v/v, 1
3), then isolated on Sephadex LH-20 CC with CH2Cl2–MeOH (v/v, 1![[thin space (1/6-em)]](https://www.rsc.org/images/entities/char_2009.gif) :
:![[thin space (1/6-em)]](https://www.rsc.org/images/entities/char_2009.gif) 1), and further purified on HPLC eluted with 80% MeOH–H2O (with 0.1% trifluoroacetic acid) to obtain compound 6 (1.8 mg). Fr. 6 was eluted with CH2Cl2–MeOH (v/v, 100
1), and further purified on HPLC eluted with 80% MeOH–H2O (with 0.1% trifluoroacetic acid) to obtain compound 6 (1.8 mg). Fr. 6 was eluted with CH2Cl2–MeOH (v/v, 100![[thin space (1/6-em)]](https://www.rsc.org/images/entities/char_2009.gif) :
:![[thin space (1/6-em)]](https://www.rsc.org/images/entities/char_2009.gif) 3) on silica gel CC, then eluted with CHCl3–MeOH (v/v, 1
3) on silica gel CC, then eluted with CHCl3–MeOH (v/v, 1![[thin space (1/6-em)]](https://www.rsc.org/images/entities/char_2009.gif) :
:![[thin space (1/6-em)]](https://www.rsc.org/images/entities/char_2009.gif) 1) on Sephadex LH-20 CC, and further purified on HPLC with 80% MeOH–H2O for 8 (8.6 mg). Fr. 9 was eluted with CH2Cl2–MeOH (v/v, 20
1) on Sephadex LH-20 CC, and further purified on HPLC with 80% MeOH–H2O for 8 (8.6 mg). Fr. 9 was eluted with CH2Cl2–MeOH (v/v, 20![[thin space (1/6-em)]](https://www.rsc.org/images/entities/char_2009.gif) :
:![[thin space (1/6-em)]](https://www.rsc.org/images/entities/char_2009.gif) 1) on silica gel CC, then eluted with CHCl3–MeOH (v/v, 1
1) on silica gel CC, then eluted with CHCl3–MeOH (v/v, 1![[thin space (1/6-em)]](https://www.rsc.org/images/entities/char_2009.gif) :
:![[thin space (1/6-em)]](https://www.rsc.org/images/entities/char_2009.gif) 1) on Sephadex LH-20 CC to obtain 7 (4.6 mg) and 9 (7.1 mg). Fr. 13 was also eluted with CH2Cl2–MeOH (v/v, 100
1) on Sephadex LH-20 CC to obtain 7 (4.6 mg) and 9 (7.1 mg). Fr. 13 was also eluted with CH2Cl2–MeOH (v/v, 100![[thin space (1/6-em)]](https://www.rsc.org/images/entities/char_2009.gif) :
:![[thin space (1/6-em)]](https://www.rsc.org/images/entities/char_2009.gif) 7) on silica gel CC, then eluted with MeOH on Sephadex LH-20 CC, and further purified on HPLC with 70% MeOH–H2O for 1 (29.0 mg) and 2 (4.0 mg).
7) on silica gel CC, then eluted with MeOH on Sephadex LH-20 CC, and further purified on HPLC with 70% MeOH–H2O for 1 (29.0 mg) and 2 (4.0 mg).
Harzianumnone A (1): yellow crystals; [α]25D −117.9 (c 0.50 mg mL−1, MeOH); UV (MeOH) λmax (log![[thin space (1/6-em)]](https://www.rsc.org/images/entities/char_2009.gif) ε): 216 (3.87), 224 (3.90), 264 (3.91), 332 (3.56) nm; CD (1.20 mM, MeOH) λmax (Δε) 213 (+4.20), 262 (−1.95), 322 (−0.80) nm; IR (KBr) νmax 3422, 2925, 1634, 1384, 1287, 1203, 1025, 758 cm−1; 1H and 13C NMR data, see Table 1; ESIMS m/z 277.2 [M + H]+, 299.1 [M + Na]+; HRESIMS m/z 277.1071 [M + H]+ (calcd for C15H17O5, 277.1071).
ε): 216 (3.87), 224 (3.90), 264 (3.91), 332 (3.56) nm; CD (1.20 mM, MeOH) λmax (Δε) 213 (+4.20), 262 (−1.95), 322 (−0.80) nm; IR (KBr) νmax 3422, 2925, 1634, 1384, 1287, 1203, 1025, 758 cm−1; 1H and 13C NMR data, see Table 1; ESIMS m/z 277.2 [M + H]+, 299.1 [M + Na]+; HRESIMS m/z 277.1071 [M + H]+ (calcd for C15H17O5, 277.1071).
X-ray crystallographic analysis of 1
C15H16O5, Mr = 276.28, monoclinic crystals, space group 4P21P2yb, a = 5.8641(4) Å, b = 9.4679(6) Å, c = 11.6419(9) Å, α = 90°, β = 94.465(6)°, γ = 90°, V = 644.39(7) Å3, Z = 2, Dcalcd = 1.424 g cm−3, T = 293(2) K, μ(Cu Kα) = 1.54184 mm−1, F(000) = 292, crystal size 0.080 × 0.070 × 0.070 mm3, R (reflections) = 0.0424 (1341), wR2 (reflections) = 0.1107 (1563), Flack parameter = 0.0(3). Crystallographic data for 1 have been deposited with the Cambridge Crystallographic Data Centre as supplementary publication number CCDC 1818895.Harzianumnone B (2): yellow powder; [α]25D −45.5 (c 1.00 mg mL−1, MeOH); UV (MeOH) λmax (log![[thin space (1/6-em)]](https://www.rsc.org/images/entities/char_2009.gif) ε): 219 (3.99), 269 (3.83), 331 (3.33) nm; CD (1.81 mM, MeOH) λmax (Δε) 217 (−2.24), 269 (+0.77), 321 (−0.41) nm; IR (KBr) νmax 2926, 1633, 1384, 1289, 1202, 1022, 853, 757 cm−1; 1H and 13C NMR data, see Table 1; ESIMS m/z 277.2 [M + H]+, 299.1 [M + Na]+; HRESIMS m/z 277.1076 [M + H]+ (calcd for C15H17O5, 277.1071).
ε): 219 (3.99), 269 (3.83), 331 (3.33) nm; CD (1.81 mM, MeOH) λmax (Δε) 217 (−2.24), 269 (+0.77), 321 (−0.41) nm; IR (KBr) νmax 2926, 1633, 1384, 1289, 1202, 1022, 853, 757 cm−1; 1H and 13C NMR data, see Table 1; ESIMS m/z 277.2 [M + H]+, 299.1 [M + Na]+; HRESIMS m/z 277.1076 [M + H]+ (calcd for C15H17O5, 277.1071).
DNA Topo I inhibition bioassay
The Topo I inhibitory activity was measured by assessing the relaxation of supercoiled pBR322 plasmid DNA.27,28 Camptothecin (CPT) was used as a positive control. The gel was stained with Gelred and visualized under UV illumination and then photographed with a Gel imaging system.Cytotoxicity assay
The cytotoxicity was measured with the SRB method by using human tumor cell lines HCT-116, SW480, A549, HepG2, HeLa, and PANC-1.29 Adriamycin was used as a positive control. The IC50 values were analysed by GraphPad Prism 5 software.AChE inhibition bioassay
The AChE inhibition activity was measured based on the modified Ellman's method.30,31 Huperzine A and galanthamine were used as positive drugs. The inhibition rates of AChE were calculated using Origin 8.0 software.Antibacterial activity assay
The antibacterial activity was evaluated by the conventional broth dilution assay.32 Three pathogenic bacterial strains, S. aureus, E. coli and P. aeruginosa, were used, and cipofloxacin was used as a positive control.Conclusions
In summary, two new hydroxyanthraquinone, harzianumnones A (1) and B (2), together with seven known analogs, were obtained from the soft coral-derived fungus T. harzianum (XS-20090075). The absolute configurations of 1 and 2 were determined by ECD calculation and single-crystal X-ray diffraction. Compounds 1 and 2 were demonstrated to be a pair of epimers, and were the first report of hydroanthraquinones from the fungus T. harzianum. Compounds 5, 7 and 8 showed moderate Topo I inhibitory activities. Furthermore, compounds 7 and 8 exhibited cytotoxicities against HepG2 cell line, and 7 also showed cytotoxicity against HeLa cell line.Conflicts of interest
The authors declare that they have no conflict of interest.Acknowledgements
This work was supported by the National Natural Science Foundation of China (No. 81673350, U1706210, U1606403); the Fundamental Research Funds for the Central Universities of China (No. 201762017); the Open Research Fund Program of State Key Laboratory of Microbial Metabolism (Shanghai Jiao Tong University) (MMLKF1609), China, Shanghai 200240, China; and the Taishan Scholars Program, China.Notes and references
- S. Agrawal, A. Adholeya, C. J. Barrow and S. K. Deshmukh, Phytochem. Lett., 2018, 23, 15–20 CrossRef.
- J. W. Blunt, A. R. Carroll, B. R. Copp, R. A. Davis, R. A. Keyzers and M. R. Prinsep, Nat. Prod. Rep., 2017, 34, 235–294 RSC.
- F. Mireille, V. Mekala, G. V. Emmanuelle, C. Yanis and D. Laurent, Mar. Drugs, 2016, 14, 1–64 Search PubMed.
- G. E. Xie, X. Zhu, Q. Li, M. Gu, Z. He, J. Wu, J. Li, Y. Lin, M. Li and Z. She, Br. J. Pharmacol., 2010, 159, 689–697 CrossRef PubMed.
- X. Zhu, Z. He, J. Wu, J. Yuan, W. Wen, Y. Hu, Y. Jiang, C. Lin, Q. Zhang and M. Lin, Mar. Drugs, 2012, 10, 694–711 CrossRef PubMed.
- C. H. Chen, W. W. Xiao, X. B. Jiang, J. W. Wang, Z. G. Mao, N. Lei, X. Fan, B. B. Song, C. X. Liao and H. J. Wang, Curr. Med. Chem., 2013, 20, 2145–2154 CrossRef PubMed.
- Z. Huang, X. Nong, Z. Ren, J. Wang, X. Zhang and S. Qi, Bioorg. Med. Chem. Lett., 2017, 27, 787–791 CrossRef PubMed.
- H. L. Li, X. M. Li, X. Li, C. Y. Wang, H. Liu, M. U. Kassack, L. H. Meng and B. G. Wang, J. Nat. Prod., 2017, 80, 162–168 CrossRef PubMed.
- K. L. Yang, M. Y. Wei, C. L. Shao, X. M. Fu, Z. Y. Guo, R. F. Xu, C. J. Zheng, Z. G. She, Y. C. Lin and C. Y. Wang, J. Nat. Prod., 2012, 75, 935 CrossRef PubMed.
- C. J. Zheng, C. L. Shao, Z. Y. Guo, J. F. Chen, D. S. Deng, K. L. Yang, Y. Y. Chen, X. M. Fu, Z. G. She and Y. C. Lin, J. Nat. Prod., 2012, 75, 189–197 CrossRef PubMed.
- S. Y. Liu, C. T. Lo, C. Chen, M. Y. Liu, J. H. Chen and K. C. Peng, J. Biochem. Biophys. Methods, 2007, 70, 391–395 CrossRef PubMed.
- N. Ayyangar, D. Bapat and B. Joshi, J. Sci. Ind. Res., Sect. B, 1961, 20, 493–497 Search PubMed.
- E. Graf, E. Breitmaier and M. Alexa, Planta Med., 1980, 40, 197–201 CrossRef.
- W. d. S. Borges and M. T. Pupo, J. Braz. Chem. Soc., 2006, 17, 929–934 CrossRef.
- R. Y. Gui, L. Xu, Y. Kuang, C. Iiiming, J. C. Qin, L. Liu, S. X. Yang and L. C. Zhao, J. Plant Interact., 2015, 10, 87–92 CrossRef.
- S. Imre, S. Sar and R. H. Thomson, Phytochemistry, 1976, 15, 317–320 CrossRef.
- S. Imre, S. Ertürk and Z. Imre, Z. Naturforsch., C: J. Biosci., 1994, 49, 684–686 Search PubMed.
- A. Andolfi, A. Cimmino, A. M. Villegasfernández, A. Tuzi, A. Santini, D. Melck, D. Rubiales and A. Evidente, J. Agric. Food Chem., 2013, 61, 7301–7308 CrossRef PubMed.
- Y. R. Lin, M. H. Chan, H. L. Peng, K. C. Peng and S. Y. Liu, J. Agric. Food Chem., 2017, 65, 10489 CrossRef PubMed.
- U. Hildebrandt, A. Marsell and M. Riederer, J. Agric. Food Chem., 2018, 66, 3393 CrossRef PubMed.
- P. Sun, J. Huo, T. Kurtán, A. Mándi, S. Antus, H. Tang, S. Draeger, B. Schulz, H. Hussain, K. Krohn, W. Pan, Y. Yi and W. Zhang, Chirality, 2013, 25, 141–148 CrossRef PubMed.
- Y. Zhang, A. Jia, H. Chen, M. Wang, G. Ding, L. Sun, L. Li and M. Dai, J. Antibiot., 2017, 70, 1138 CrossRef PubMed.
- M. Tselepi, E. Papachristou, A. Emmanouilidi, A. Angelis, N. Aligiannis, A. L. Skaltsounis, D. Kouretas and K. Liadaki, J. Nat. Prod., 2011, 74, 2362–2370 CrossRef PubMed.
- S. M. Vos, E. M. Tretter, B. H. Schmidt and J. M. Berger, Nat. Rev. Mol. Cell Biol., 2011, 12, 827–841 CrossRef PubMed.
- Y. H. Liu, X. Yang, J. L. Li, Z. Y. Guo, Z. S. Deng, X. Tu, J. F. Chen and K. Zou, Nat. Prod. Res. Dev., 2013, 25, 431–493 Search PubMed.
- R. Hong, X. L. Cao and Q. Q. Gu, Chin. Pharm. J., 2010, 45, 1720–1723 Search PubMed.
- L. T. Xin, L. Liu, C. L. Shao, R. L. Yu, F. L. Chen, S. J. Yue, M. Wang, Z. L. Guo, Y. C. Fan and H. S. Guan, Mar. Drugs, 2017, 15, 217–225 CrossRef PubMed.
- N. Bogurcu, C. Sevimli-Gur, B. Ozmen, E. Bedir and K. S. Korkmaz, Biochem. Biophys. Res. Commun., 2011, 409, 738–744 CrossRef PubMed.
- P. Skehan, R. Storeng, D. Scudiero, A. Monks, J. Mcmahon, D. Vistica, J. T. Warren, H. Bokesch, S. Kenney and M. R. Boyd, J. Natl. Cancer Inst., 1990, 82, 1107–1112 CrossRef PubMed.
- G. L. Ellman, Arch. Biochem. Biophys., 1958, 74, 443–450 CrossRef PubMed.
- G. L. Ellman, K. D. Courtney, V. Andres Jr and R. M. Featherstone, Biochem. Pharmacol., 1961, 7, 88–95 CrossRef PubMed.
- G. Appendino, S. Gibbons, A. Giana, A. Pagani, G. Grassi, M. Stavri, E. Smith and M. M. Rahman, J. Nat. Prod., 2008, 71, 1427–1430 CrossRef PubMed.
Footnote |
| † Electronic supplementary information (ESI) available: ESIMS, HRESIMS, 1D, 2D NMR data of compounds 1 and 2 and activities results of bioactive compounds. CCDC 1818895. For ESI and crystallographic data in CIF or other electronic format see DOI: 10.1039/c8ra04865g |
| This journal is © The Royal Society of Chemistry 2018 |

