 Open Access Article
Hierarchical porous activated biochar derived from marine macroalgae wastes (Enteromorpha prolifera): facile synthesis and its application on Methylene Blue removal
Xiao-yu Liab,
Dong Hanb,
Jun-feng Xie c,
Zhen-bo Wang
 *b,
Zhi-qiang Gongb and
Bin Lib
aCollege of Mechanical and Electronic Engineering, Shandong University of Science and Technology, Qingdao, 266590, China
bState Key Laboratory of Heavy Oil Processing, College of Chemical Engineering, China University of Petroleum (East China), Qingdao, 266580, China. E-mail: wangzhb@upc.edu.cn; Tel: +86-18953250239
cCollege of Chemistry, Chemical Engineering and Materials Science, Shandong Normal University, Jinan, 250014, China
First published on 16th August 2018
Abstract
Biochar is one of the most promising candidates of the cost-effective adsorbent for wastewater treatment. Herein, a novel hierarchical porous activated biochar derived from Enteromorpha prolifera (EPAC) was synthesized via an oily sludge-assisted “one-step” carbonization and activation approach. The results proved that the oily sludge additive acts as a natural structure directing agent during the EPAC preparation. The resultant EPAC possesses favorable properties such as high surface area and hierarchical pore distribution, which bring about its outstanding adsorption capability (910 mg g−1) for Methylene Blue dyes from wastewater. The adsorption kinetics, isotherms, thermodynamics and the effect of pH and the background ionic species on the adsorption process were investigated. The adsorption data could be well illustrated by Langmuir models and pseudo-second-order models. Furthermore, thermodynamic parameters revealed that the adsorption reaction was an endothermic and spontaneous process. The adsorption process was influenced by the solution pH and background ionic species because of the competitive adsorption. Moreover, the regeneration analysis demonstrates a presentable recyclability of the EPAC. In view of its good adsorption performance, the EPAC prepared in this study has the potential of treating dye wastewater in practical applications.
1. Introduction
The increasing development of the textile, printing, electroplating, tannery, and related industries has led to a large amount of dye-containing wastewater being discharged into the environment.1 These dyestuffs usually have synthetic organic and complex aromatic molecular structures which make them more stable and difficult to biodegrade.2,3 The dye pollution not only destroyed the aquatic ecosystem but also resulted in the entry of pollutants into food chain thus threatening human health by carcinogenic, teratogenic and mutagenic effects. Therefore, removal of the dyestuffs from wastewater has received considerable attention over the past decades.4Many technologies have been explored to remove dyes from industrial effluents, such as adsorption,5 membrane technology,6 photocatalytic degradation,7 advanced oxidation8 and biological treatment.9 Among others, adsorption was proven to be one of the most effective methods for removing a wide variety of pollutants in wastewater due to its high efficiency and simple operation process. A number of materials, including activated carbon, fly ash, zeolites, biomass and biomaterials, have been reported as effective adsorbent.4
Biochar is a kind of environment-friendly and cost-effective material that has been receiving great attention as promising candidates for adsorbent due to its high adsorption capability and great application benefits.10 Currently, algae have been used as the precursor for the preparing biochar because of its composition of cellulose and hemicellulose.11 Enteromorpha prolifera (EP) is a marine macroalgae that is becoming more common due to eutrophication and climate change.12 Since 2007, EP blooms break out each summer in China's Yellow Sea,13 which seriously impact the ocean transportation, tourism and the ecological equilibrium of the ocean. It was reported that millions metric tons of fresh EP were collected each year on the coast of Qingdao.14 Therefore, the conversion of EP into valuable biochar would reduce the ocean pollution and create economic benefits. More recently, EP-derived carbonaceous materials have been developed and explored their uses in different ways. Some researchers have developed EP-based activated carbon for the application in electrochemical capacitor,15 CO2 capture16 and H2 storage.14 But more studies have explored the adsorption properties of EP-based biochar, such as dyes,17 heavy metal ions18,19 and some other organic pollutants20,21 in wastewater. Despite these EP-based biochar adsorbents were synthesized in different ways and exhibited different structure properties, their pore size distributions were usually relatively concentrated and mainly based on micropores, which may limit their adsorption performance. Therefore, it is significant to improve the pore size distribution of EP-based activated biochar.
Herein, we report a simple and cost-effective method for the synthesis of hierarchical porous activated biochar via “one-step” carbonization and chemical activation process, in which the macroalgae EP were used as carbon precursor and oily sludge (OS) as the structure directing reagent. To the best of our knowledge, there is no report concerning the usage of OS as the additive to regulate the pore structure of EP-based activated biochar (EPAC). In addition, the adsorption efficiency of as-received EPAC was demonstrated by using Methylene Blue (MB) as a model adsorbate. Batch adsorption experiments were conducted under various conditions such as contact time, adsorption temperature, initial concentration, pH value of solution and background ionic species. Adsorption isotherms, kinetics and thermodynamics analysis were also performed to estimate the adsorption behavior and mechanism of EPAC.
2. Experimental method
2.1 Material
Fresh EP was collected from the Golden Beach of Qingdao, China. Following washed to remove impurities, it was dried in an oven at 60 °C for 24 h. The employed oily sludge (OS) was collected from tank bottom of Dongying storage depot of petroleum and dried at 80 °C. All other chemical reagents were of analytical grade and used as received without further purification.2.2 Preparation of EPACs
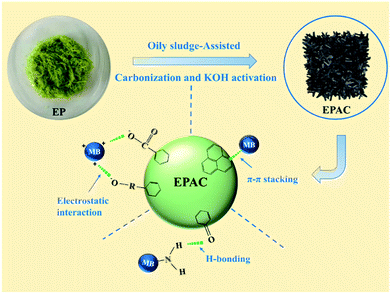
EPAC was prepared in an oily sludge-assisted concurrent carbonization and activation approach, as is shown in Fig. 1. In the typical process, dried EP was mixed with dried OS sample with different mass ratios, and then ground in a knife-milling commercial blender into a fine powder. And then the powder was mixed with KOH at a KOH/C ratio of 3![[thin space (1/6-em)]](https://www.rsc.org/images/entities/char_2009.gif) :
:![[thin space (1/6-em)]](https://www.rsc.org/images/entities/char_2009.gif) 1. The carbonization and activation process was carried out by using “one-step” method in a fixed-bed reactor at a slow heating rate of 10 °C min−1 from room temperature to 700 °C under a nitrogen flow of 50 mL min−1 and held for 1 h. When the system was cooled down to room temperature, the resulting product was washed with 1 M HCl solution and then plenty of distilled water until the pH of washing effluent reached 7. After drying in the oven at 105 °C for 6 h, the EPAC was obtained. EPAC synthesized with the OS/EP mass ratio of 1
1. The carbonization and activation process was carried out by using “one-step” method in a fixed-bed reactor at a slow heating rate of 10 °C min−1 from room temperature to 700 °C under a nitrogen flow of 50 mL min−1 and held for 1 h. When the system was cooled down to room temperature, the resulting product was washed with 1 M HCl solution and then plenty of distilled water until the pH of washing effluent reached 7. After drying in the oven at 105 °C for 6 h, the EPAC was obtained. EPAC synthesized with the OS/EP mass ratio of 1![[thin space (1/6-em)]](https://www.rsc.org/images/entities/char_2009.gif) :
:![[thin space (1/6-em)]](https://www.rsc.org/images/entities/char_2009.gif) 2, 1
2, 1![[thin space (1/6-em)]](https://www.rsc.org/images/entities/char_2009.gif) :
:![[thin space (1/6-em)]](https://www.rsc.org/images/entities/char_2009.gif) 1, 2
1, 2![[thin space (1/6-em)]](https://www.rsc.org/images/entities/char_2009.gif) :
:![[thin space (1/6-em)]](https://www.rsc.org/images/entities/char_2009.gif) 1 were named as EPAC-0.5, EPAC-1, EPAC-2, respectively. The activated biochar derived from EP without OS addition was prepared and named as EPAC-0. The activated char derived from OS with the same procedure was marked as OSAC.
1 were named as EPAC-0.5, EPAC-1, EPAC-2, respectively. The activated biochar derived from EP without OS addition was prepared and named as EPAC-0. The activated char derived from OS with the same procedure was marked as OSAC.
2.3 Structure characterization
The field emission scanning electron microscopy (SEM) images were carried out on a JEOL JSM-6700F SEM. The transmission electron microscopy (TEM) images were obtained on a JEOL-2010 transmission electron microscope. XRD patterns were recorded from Philips X'pert pro Super diffractometer with Cu Kα radiation. The BET surface area and porous properties of the synthesized samples were assessed via multipoint N2 adsorption–desorption experiments which were performed on an automatic Micromeritics ASAP 2020M analyzer at 77 K. The sample was outgassed at 250 °C for 6 h in vacuum before adsorption measurement. And the specific surface area was calculated by Brunauer–Emmett–Teller (BET) method and the pore size distribution (PSD) plots were calculated via the Barrett–Joyner–Halenda (BJH) methods.The pH at the point of zero charge (pHpzc) of the EPAC was measured with pH floating method.22 In detailed, two series of vials filled with 20 mL of CO2-free distilled water were prepared with initial pH ranging from 2 to 11. The pH values were adjusted using 0.1 M HCl and NaOH. Then, 5 mg of EPAC samples were placed in each vial and left 24 h to reach equilibrium at 25 °C. The final pH were then measured and plotted against the initial pH using the average value of the two series. The pHpzc value was therefore obtained from the point at which the initial pH vs. final pH curve crossed the y = x line on the graph.
2.4 Batch adsorption experiments
In order to investigate the adsorption of MB dye as a function of initial concentration, contact time, solution temperature, initial pH and background solution ionic species, a series of batch adsorption experiments were performed in centrifuge tubes. The concentrations of MB solutions were determined by UV/vis spectrophotometer (TU-1900) at the wavelength of 665 nm.For the adsorption isotherm study, 5 mg of as-received adsorbent samples were added to 20 mL of MB solutions with different initial concentrations in a range of 50 to 500 mg L−1 at 25, 35 and 45 °C for 12 h, respectively. The adsorption capacity Qe (mg g−1) of MB at equilibrium was calculated by the following equation:
And then the removal ratios were calculated according to the following equation:
The kinetic studies were carried out at 25, 35 and 45 °C with different initial concentrations of MB (100, 200, 300 and 500 mg L−1), respectively. At the predetermined time intervals (10, 30, 60, 90, 120, 240, 360, 540 and 720 min), the residual concentrations were measured. The adsorption capacity Qt (mg g−1) of MB at different time t was calculated by the following equation:
The effect of solution pH on EPAC adsorption was also investigated. The tests were performed by adding 5 mg EPAC adsorbent into MB solution with a concentration of 100 mg L−1 at 25 °C, the initial pH values of the dye solutions were adjusted from 2–11 by using 0.1 M NaOH or HCl solution.
All the experiments were conducted in triplicated and the average values were used.
3. Results and discussions
3.1 Characterization
In this work, hierarchical porous activated biochar was synthesized by using EP as precursor and OS as additive. The morphology of as-resulted EPACs were characterized by SEM and TEM. As is shown in Fig. 2a, the raw EP exhibits rough surface with no obvious pore structure in it. After carbonization and activation process, EPAC-0 sample possesses porous carbon structure with worm-like surface morphology (Fig. 2b), some fragments were broken off from the bulk by KOH activation effect. By contrast, with the addition of OS, EPAC-0.5 (Fig. 2c) exhibits more disordered pore structure. It can be seen a huge number of mesopores with the pore size of 10–50 nm and macropores with size of 50–500 nm in magnified SEM images of EPAC-0.5 (Fig. 2d). The TEM images in Fig. 2h further confirms the interconnected hierarchical porous frameworks of EPAC-0.5, which is favorable for dye pollutant adsorption. It suggests that the employed OS in this work can significantly affect the morphology of EPAC products. However, with the further increasing of OS addition, the pore structures of EPAC-1 (Fig. 2e) and EPAC-2 (Fig. 2f) were getting worse gradually, because the excess inorganic impurities could not be wiped off during the activation process. The mineral particles which adhered to the interior and surface of the biochar also hindered the activation effect of KOH. In addition, there are only disordered granular particles exist in OSAC sample (Fig. 2g), and no obvious EPAC-like interconnect porous structure. The XRD patterns of these different samples were illustrated in Fig. 2i. The as-resulted EPACs possess a broad and a weak intensity diffraction peak at 25.2° and 43.0°, which are attributed to the (002) and (101) planes of graphitic carbon, respectively. It indicates the characteristic of turbostratic disordered carbon between graphite and amorphous carbon.23 In addition, for EPAC-1, EPAC-2 and OSAC, the XRD patterns not only exhibit the amorphous carbon structure but also can be identified of SiO2 (PDF#85-0796) in them. These results suggest that, the inorganic matters such as SiO2 in oily sludge were embedded into the carbon frameworks during the preparation. And the XRD pattern of EPAC-0.5 shows, no obvious diffraction of SiO2, which is due to the KOH activation effect, the relatively fewer SiO2 micro-particles were decomposed and the amorphous carbon skeleton was left. Thus, the addition of OS can assist the formation of EPAC structure to some extent.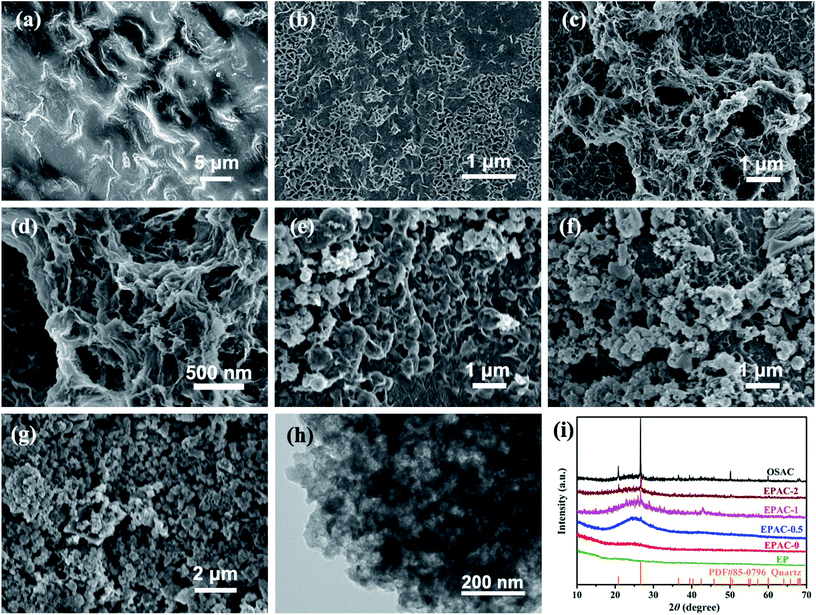 | ||
| Fig. 2 SEM images of EP (a), EPAC-0 (b), EPAC-0.5 (c and d), EPAC-1 (e), EPAC-2 (f) and OSAC (g), TEM image of EPAC-0.5 (h) and XRD patterns of all these samples (i). | ||
In order to study the influence of experimental conditions on the preparation of adsorbents, the textural properties of samples have been evaluated. The N2 adsorption–desorption isotherms are illustrated in Fig. 3a. The isotherm of EPAC-0 could be classified as type I, which is the traditional type of activated carbon. The rich micropores in the material make its specific surface area as high as 1483.9 m2 g−1. When OS was added, the as-resulted EPAC-0.5 exhibits a unique combined I/IV type adsorption–desorption isotherm with H4 type hysteresis loop. The steep increase in low relative pressure is credited to the micropores in the sample, and an increasing slope at higher pressure commonly related to the capillary condensation of N2 gas in mesopores.24 In addition, the specific surface area of EPAC-0.5 can be calculated to 1262.8 m2 g−1, which is relatively lower than EPAC-0. But the total pore volume of it is increased dramatically. This is because the OS act as a hard-template and meso-/macro- pore former25 for EP-based biochar to present a hierarchical porous structure. With the increasing ratio of OS addition, the specific surface areas and pore volumes decrease gradually, and the average pore widths increase little by little. This is due to the higher amount of OS which brings more SiO2 mineral impurity will interfere with KOH activation effect, thereby limiting the generation of smaller micropores. It is unfavorable to the development of pore volume and does not reduce the average pore size obviously. On the other hand, the SiO2 which was etched away during the preparation process leaves mostly large-sized pores, and thus also increased the average pore width. But for OSAC prepared only by OS, the type IV adsorption–desorption isotherm of it demonstrates the dominate position of mesopores and macropores (Table 1).
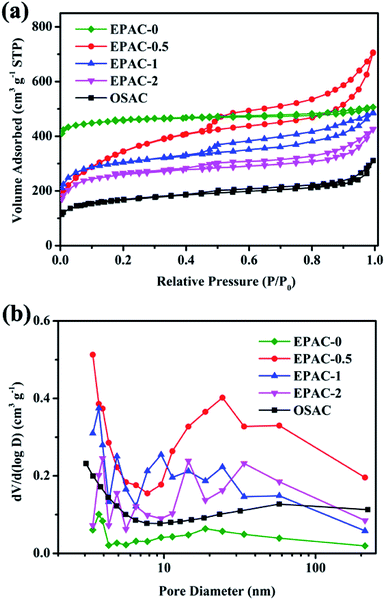 | ||
| Fig. 3 N2 adsorption–desorption isotherms (a) and pore size distributions (b) of EPAC-0, EPAC-0.5, EPAC-1, EPAC-2 and OSAC. | ||
| SBET (m2 g−1) | Pore volume (cm3 g−1) | Average pore width (nm) | |
|---|---|---|---|
| EPAC-0 | 1483.9 | 0.075 | 3.171 |
| EPAC-0.5 | 1262.8 | 0.546 | 3.383 |
| EPAC-1 | 1008.6 | 0.306 | 3.711 |
| EPAC-2 | 872.7 | 0.265 | 3.934 |
| OSAC | 564.5 | 0.238 | 3.055 |
3.2 Effect of OS addition on adsorption
To investigate the adsorption capability of these different samples which synthesized by different OS additive amount, adsorption experiments were carried out using the same concentration of MB solution (100 mg L−1). As is shown in Fig. 4a, the adsorption performance of each samples varies. The raw dried EP possessed poorest adsorption capacity due to its poor porous structure. And then the carbonization and activation process significantly enhanced the adsorption performance of EPAC-0. The developed pore structure played a positive role in increasing the adsorption capacity of MB, but the high proportion of micropores does not have much effect on MB dye molecules adsorption. The adsorption process quickly reached equilibrium. As for EPAC-0.5, due to its higher ratio of mesopores caused by OS additive, the adsorption capacity of MB has been greatly improved to 346 mg g−1. With the increasing ratios of OS, adsorption performances of EPAC-1 and EPAC-2 have been gradually reduced to 263.2 mg g−1 and 194 mg g−1, respectively. It is consistent with the variation of the pore characteristics analyzed above.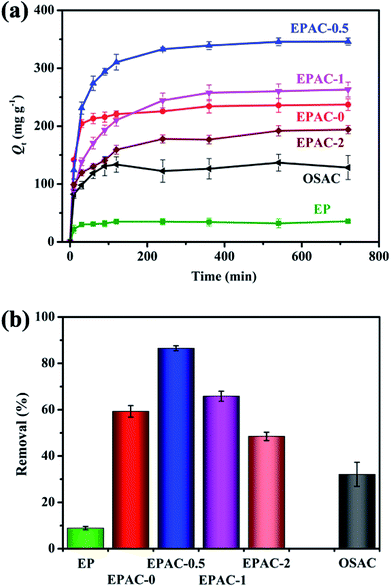 | ||
| Fig. 4 The relationship of adsorption capacity towards the time of different adsorbents (a) and the removal ratios of MB by different adsorbents (b). | ||
Fig. 4b shows the calculated removal ratios of different adsorbents toward MB. Among these adsorbents, EPAC-0.5 exhibits the highest MB removal rate which represents the most superior adsorption performance. Therefore, unless specially noted, all the following analysis of the adsorption characteristics of EPAC in this paper is mainly focused on the EPAC-0.5.
3.3 Effect of solution pH on adsorption
The initial pH value of the solution is one of the key factors that determine the interaction between adsorbate and adsorbent. It can affect not only the speciation of the surface functional groups of the adsorbent but also the state of the adsorbate in the solution.26 The effect of solution pH on the ability of EPAC-0.5 to remove MB dye was investigated, and the results are presented in Fig. 5b. The adsorption of MB was strongly pH-dependent. The removal ratio ofMB increased from 60.9 to 89.4% when the initial pH range is 2–11. The result responds to the surface charges of the adsorbent. As is illustrated in Fig. 5a, the pHpzc value for EPAC-0.5 was determined to be about 5.9, which may be due to the presence of the oxygen functional group on the surface. As is well known, when the solution pH value is below the pHpzc, the adsorbent becomes protonated and exhibits a positive net charge on the surface, which is which is apt to attract anions, and vice versa. Considering MB is a basic dye, it is expected to form positively charged ions over a wide pH range of solution. Therefore, the excessive H+ leads to great competitive adsorption with MB, which further contributes to the relatively low adsorption efficiency at pH range of 2–5. When the solution pH increased to 6–11, the surface of EPAC-0.5 was negatively charged. And the strong electrostatic attraction between EPAC and MB could enhance the adsorption capability.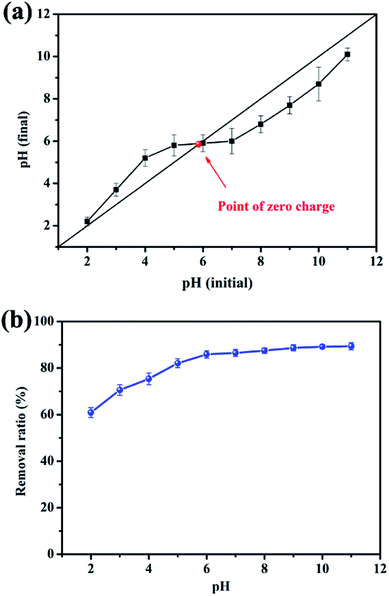 | ||
| Fig. 5 Determination of the pHpzc for EPAC-0.5 via pH drift method (a) and the effect of initial solution pH on removal efficiency of MB (b). | ||
3.4 Adsorption isotherms
Adsorption isotherm reveals the relationship between the adsorbate concentration in liquid phase and solid phase when the adsorption process reaches equilibrium at a certain temperature.45 Fig. 6 shows adsorption isotherms of MB onto EPAC-0.5. The adsorption amounts with the increase of the initial concentration of MB solution, which may be due to the higher concentration with larger driving force to overcome the resistances in the procedure of dye molecules transfer from liquid to solid phase. In addition, the maximum adsorption amount of MB increased with the temperature increasing, which are 752.8, 830.8 and 910 mg g−1 at 25, 35 and 45 °C, respectively. It indicates that this adsorption process was endothermic.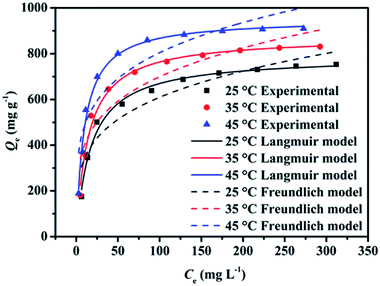 | ||
| Fig. 6 Adsorption isotherms of MB adsorption onto EPAC at different temperatures and the corresponding Langmuir and Freundlich model fitting curves. | ||
As is shown in Fig. 6, the adsorption equilibrium data were fitted by Langmuir and Freundlich models in this work. Both the two models are expressed as follows:46
| Freundlich: Qe = KFCe1/nF |
The related fitting parameters of the two models are presented in Table 2. The correlation coefficients (R2) of Langmuir model are higher than 0.98, which implying that Langmuir model gives a better fit to the experimental data. As is known that, the Langmuir model reveals the adsorbate molecules are adsorbed as monolayers on homogeneous surfaces of adsorbents. It means that the adsorption process of MB onto EPAC is dominated by monolayer physical adsorption. Interestingly, physical adsorption is commonly exothermic and prefers a lower operation temperature, which is inconsistent with the experimental results mentioned above. Hence, this adsorption process can be considered to be complex, where both physical adsorption and chemical adsorption play important role in it.
| Isotherm model | Langmuir | Freundlich | |||||
|---|---|---|---|---|---|---|---|
| T (°C) | Qe exp (mg g−1) | Qm (mg g−1) | KL (L mg−1) | R2 | KF (mg g−1) (L mg−1)1/n | nF | R2 |
| 25 | 752.8 | 788.4 | 0.05637 | 0.988 | 193.3 | 4.011 | 0.889 |
| 35 | 830.8 | 874.5 | 0.06893 | 0.988 | 232.3 | 4.179 | 0.857 |
| 45 | 910 | 952.4 | 0.10183 | 0.992 | 294 | 4.574 | 0.809 |
The maximum adsorption capacities of EPAC predicted by Langmuir model were 788.4, 874.5 and 952.4 mg g−1, respectively. These remarkable values are higher than many other MB dye adsorbents reported in the literature which are shown in Table 3. Therefore, this novel EPAC can be treated as an excellent candidate for dyes removal from wastewater.
| Adsorbent | Adsorption capacity (mg g−1) | |
|---|---|---|
| EPAC (this study) | 910 | |
| Biochar derived from other precursors | Corn stalk27 | 144 |
| Wheat straw28 | 208 | |
| Wheat straw29 | 396.9 | |
| Corn straw30 | 436 | |
| Prosopis juliflora31 | 91 | |
| Eucalyptus sawdust32 | 178.57 | |
| Palm date seed33 | 612.1 | |
| Coconut husk34 | 434.78 | |
| Dry distillers grains35 | 477 | |
| Waste cotton36 | 346.32 | |
| Activated multiwalled carbon nanotubes37 | 399 | |
| Chitosan-clay composite38 | 193.23 | |
| N-doped porous carbon nanosheet39 | 962.1 | |
| Nanoporous polymer40 | 57.74 | |
| Fe3O4 magnetic particles41 | 99.4 | |
| Acid-base treated vermiculite42 | 203 | |
| Hollow spherical sludge carbon43 | 149 | |
| Cellulose nanocrystal–alginate hydrogel44 | 256.41 | |
3.5 Adsorption kinetics analyses
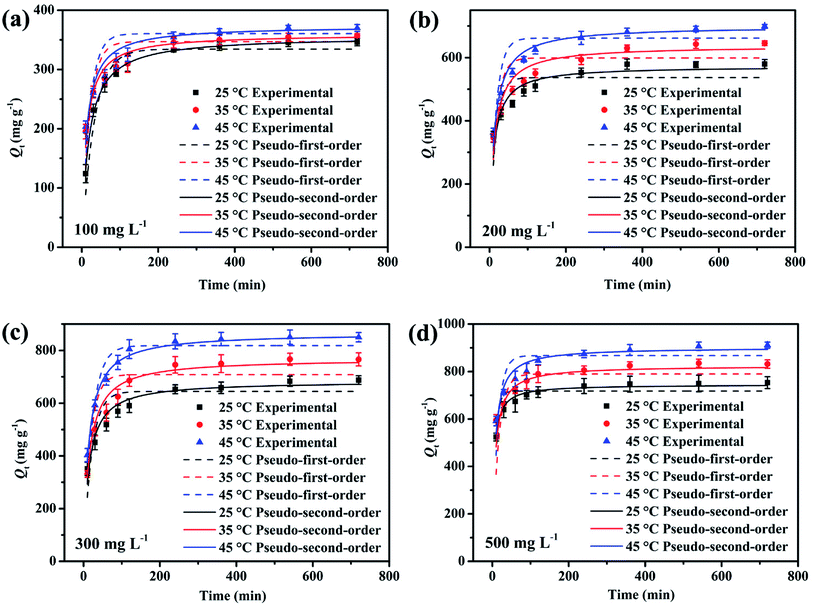
Adsorption kinetic as an important index to evaluate adsorbent performance was used to investigate the adsorption rate, which can be influenced by lots of parameters such as the reactivity of the adsorbent, the pH or temperature of the adsorbate solutions, the surface and composition features of the adsorbate molecules, and so on.47 Hence, adsorption kinetic was commonly utilized to study the adsorption process and the adsorption mechanism.Fig. 7 gives the adsorption kinetics curves of MB adsorbed onto EPAC-0.5 at different temperatures. It is clear that the adsorption rate was extremely fast in the first 90 min, then gradually slowed down and basically reached equilibrium in 4 h. This is because that there are rich effective adsorption sites on the surface of EPAC at the beginning of the adsorption. However, as the adsorption continues, the number of available active sites gradually decreased, resulting in the slower adsorption rate. The adsorption capacity of EPAC towards MB increased with the contact time, initial concentration and temperature. The higher initial concentration brings a greater concentration gradient at the interface between the solution and adsorbent, which results in larger diffusion driving force. Similarly, higher temperature also increases diffusion rate and collision chances of molecules. To investigate the mechanism of adsorption, the pseudo-first-order and pseudo-second-order models were employed in this work to explain the adsorption kinetics data, which are illustrated as follows:48
The pseudo-first-order model:
The pseudo-second-order model:
The fitting curves of these two models were also shown in Fig. 7, and the fitting parameters are presented in Table 4. It is clear that the pseudo-second-order model gives the better fit to the experimental data, with bigger R2 values at each experimental conditions. Additionally, the values of Qe calculated by the model were found to be close to those determined experimentally. The pseudo-second- order model assumes that the adsorbate concentration is constant in time and the total number of active binding sites depends on the amount of adsorbate adsorbed at equilibrium. It indicates that the adsorption process of MB onto EPAC could occur via chemical adsorption.
| C0 (mg L−1) | T (°C) | Qe exp (mg g−1) | Pseudo-first-order | Pseudo-second-order | ||||
|---|---|---|---|---|---|---|---|---|
| K1 (min−1) | Qe cal (mg g−1) | R2 | K2 (10−3 g mg−1 min−1) | Qe cal (mg g−1) | R2 | |||
| 100 | 25 | 346 | 0.03088 | 334.366 | 0.8813 | 1.58422 | 356.207 | 0.9959 |
| 35 | 357.2 | 0.04926 | 347.007 | 0.6640 | 2.44388 | 359.742 | 0.9439 | |
| 45 | 370.1 | 0.04935 | 360.444 | 0.7428 | 2.3241 | 373.672 | 0.9458 | |
| 200 | 25 | 579.6 | 0.06601 | 536.783 | 0.4132 | 1.72204 | 572.958 | 0.8411 |
| 35 | 645.6 | 0.06235 | 598.796 | 0.5963 | 1.32674 | 637.44 | 0.8947 | |
| 45 | 698.8 | 0.06165 | 661.571 | 0.6779 | 1.20281 | 699.422 | 0.9526 | |
| 300 | 25 | 687.6 | 0.04733 | 644.490 | 0.6794 | 1.09604 | 683.706 | 0.9289 |
| 35 | 766 | 0.05594 | 708.369 | 0.8987 | 0.91809 | 768.675 | 0.9835 | |
| 45 | 850 | 0.04488 | 818.119 | 0.8548 | 0.88139 | 866.392 | 0.9877 | |
| 500 | 25 | 753.2 | 0.12894 | 718.291 | 0.9042 | 3.10743 | 744.937 | 0.9878 |
| 35 | 831.6 | 0.0625 | 789.625 | 0.5429 | 1.71082 | 824.504 | 0.8978 | |
| 45 | 910.8 | 0.07248 | 866.953 | 0.6212 | 1.62562 | 901.429 | 0.9398 | |
3.6 Thermodynamic analysis
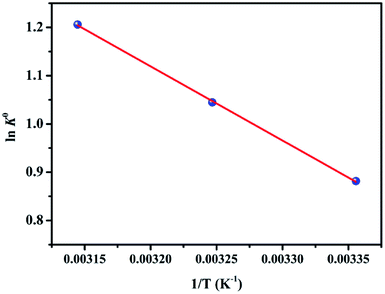
The study on adsorption thermodynamic properties is helpful for understanding the adsorption behavior and mechanisms. The thermodynamic parameters such as changes in enthalpy (ΔH0), entropy (ΔS0) and Gibb's free energy (ΔG0) of adsorption can be estimated by the following functions:45ΔG0 = −RT![[thin space (1/6-em)]](https://www.rsc.org/images/entities/char_2009.gif) ln ln![[thin space (1/6-em)]](https://www.rsc.org/images/entities/char_2009.gif) K0 K0 |
where K0 is the thermodynamic equilibrium constant. R (8.314 J mol−1 K−1) is the gas constant and T (K) is the solution temperature. In Fig. 8 and Table 5, the thermodynamic parameters for adsorption of MB onto EPAC-0.5 are calculated and presented. As is shown that, the negative values of ΔG0 at all different temperatures implied that the adsorption process was spontaneous in nature. In addition, the decrease in negative values of ΔG0 with increasing temperature indicates that the adsorption became more favorable at the higher temperature. Moreover, the positive values of ΔH0 was 12.774 kJ mol−1, confirming the adsorption process was endothermic which is consistent with the results of adsorption kinetics and isotherms. And the positive value of ΔS0 suggests increased randomness at the solid–liquid interface during the MB adsorptions. All these parameters may imply that the higher temperature provides more sufficient energy to MB molecules to overcome the diffuse layer on the interface and to be adsorbed onto EPAC.
| T (K) | ΔG0 (kJ mol−1) | ΔH0 (kJ mol−1) | ΔS0 (kJ mol−1 K−1) |
|---|---|---|---|
| 298 | −2.184 | 12.774 | 0.05018 |
| 308 | −2.675 | ||
| 318 | −3.188 |
3.7 Effect of background solution on adsorption
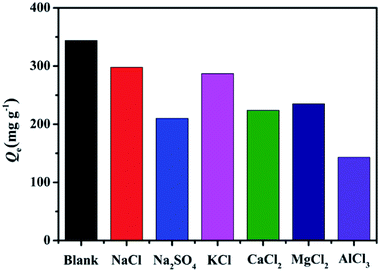
In fact, the adsorption process of target pollutants is usually affected by other ions in the background solution.49 In order to further investigate the influence of background solution, MB adsorption experiment onto EPAC in different inorganic salt solutions such as NaCl, Na2SO4, KCl, CaCl2, MgCl2, AlCl3 with same concentration of 0.01 mol L−1, respectively. As shown in Fig. 9, all these inorganic salt ions reduced the adsorption amount of MB. The influence on adsorption appears in the following sequence: NaCl < KCl < MgCl2 < CaCl2 < Na2SO4 < AlCl3. There is a clear trend that the multivalent metal cations have stronger inhibit effect on the adsorption process of MB than monovalent metal cations, which can be explained by the competition adsorption mechanism. The Al3+, Ca2+ and Mg2+ could compete with positive charged MB ions for the available negative adsorption active sites on EPAC. However, for the monovalent Na+ and K+, they may slight compete with MB during adsorbed onto EPAC surface. In addition, as for the same concentration of NaCl and Na2SO4, due to the higher molar concentration of Na+, more intense competition effect for the adsorption active sites was exhibited by Na2SO4 background solution. The study of the influence of background solution on adsorption of MB dye demonstrated that electrostatic adsorption force is one important possible mechanism for the removal of MB onto EPAC.3.8 Regeneration performance
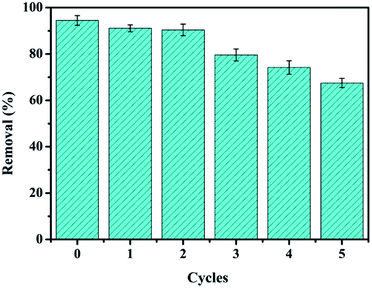
Regeneration capacity is commonly one of the key properties to evaluate the economic value of adsorbents in the practical application. Desorption study will help to regenerate the spent EPAC so that it can be reused to adsorb MB. In this experiment, the adsorbed MB was released from spent EPAC by treatment with 0.1 M NaOH solution. The adsorption–desorption cycles were repeated five times by using the same adsorbent. As is shown in Fig. 10, the dye removal efficiency decreased gradually with the increasing reuse cycles. About 67.5% removal rate can be reached after five reuse cycles, which shows a moderate regeneration performance. This indicated that the MB molecules adsorbed on EPAC were not fully removed during the regeneration process, which is mainly caused by the strong interactions between MB and EPAC. On the one hand, some of the MB molecules might adsorb on EPAC with the creation of chemical bonds which permanently being attached to the surface of EPAC adsorbent. On the other hand, due to the porous structure of the adsorbent, some of the adsorption sites might not be available to the NaOH eluent to penetrate, thus not all the MB molecules are able to be desorbed. Another possible reason for the decreasing of the dye removal efficiency is that once the eluent reaches the effective adsorption sites and replaces the adsorbed MB molecules, they may occupy the adsorption sites and not allow the dye molecules adsorbed there in the following adsorption cycle.42 However, although our EPAC does not exhibit excellent regeneration capacity, it still has great potential for practical dye removal applications in wastewater treatment. This is due to the cost of the EPAC adsorbents is fairly low as they are prepared from algae waste and oily sludge waste, which make the demand for their regeneration performance less stringent.3.9 Possible mechanism
Determination of the adsorption mechanism would be a challenging task because various factors often play important roles towards the adsorbent–adsorbate interactions simultaneously. Commonly, the interactions between carbonaceous adsorbents and dye adsorbate molecules are performed through π–π stacking, electrostatic interaction, hydrophobic interaction, hydrogen bonding interaction or formation of other complexes. In the previous analysis, different kinetic and isotherm models have been used to fit the experimental data, and the corresponding adsorption theory could also explain the experimental results. It suggests that the chemical adsorption plays a significant role in the adsorption of MB onto EPAC. The mechanism of interaction could be through π–π stacking, H-bonding interactions and electrostatic interaction. Among them, π–π stacking occurs between the π-electron system of EPAC and the aromatic ring of the MB structure. The H-bonding and electrostatic interactions may root in the surface functional group of EPAC. In addition, the hierarchical porous structure of EPAC has also expected to be beneficial to the adsorption properties, as this provides sufficient adsorption sites and promotes the diffusion of the dye molecules throughout the biochar structure.4. Conclusions
In this work, EPAC was synthesized by applying a facile OS-assisted concurrent carbonization and activation process. The OS additives acted as a structure directing reagent during the preparation process. Thus, the EPAC possesses outstanding structure properties, such as high specific surface area (1262.8 m2 g−1), hierarchical pore size distribution and rich surface functional groups, which favor the dye removal. The EPAC adsorbents exhibited competitive adsorption capacity for MB. The Langmuir isotherm model and pseudo-second-order model fitted the experimental data very well in the isotherm and kinetic studies, respectively. It suggested that the rate-limiting step of the adsorption process was chemical adsorption. The analysis of thermodynamic showed that the adsorption of MB onto EPAC was an endothermic and spontaneous process. In addition, the adsorption was affected by the pH and ionic species of the background solution, which due to competition adsorption. Moreover, the EPAC showed a moderate regeneration performance. In conclusion, this study provides a feasible approach to produce hierarchical porous biochar efficiently and opens up a new way for comprehensive utilization of Enteromorpha prolifera and other algae wastes.Conflicts of interest
There are no conflicts to declare.Acknowledgements
This work was financial supported by the Fundamental Research Funds for the Central Universities (No. 17CX06031), the Innovative Project for Postgraduate of UPC (No. YCXJ2016033), the Natural Science Foundation of Shandong Province (No. ZR2017BEE042).References
- G. Mezohegyi, F. P. van der Zee, J. Font, A. Fortuny and A. Fabregat, J. Environ. Manage., 2012, 102, 148–164 CrossRef PubMed.
- M. Solís, A. Solís, H. I. Pérez, N. Manjarrez and M. Flores, Process Biochem., 2012, 47, 1723–1748 CrossRef.
- P. Nautiyal, K. A. Subramanian and M. G. Dastidar, J. Environ. Manage., 2016, 182, 187–197 CrossRef PubMed.
- V. K. Gupta and Suhas, J. Environ. Manage., 2009, 90, 2313–2342 CrossRef PubMed.
- T. Zhang, X. Huang and T. Asefa, Chem. Commun., 2015, 51, 16135–16138 RSC.
- K. Goh, H. E. Karahan, L. Wei, T.-H. Bae, A. G. Fane, R. Wang and Y. Chen, Carbon, 2016, 109, 694–710 CrossRef.
- X.-f. Tan, Y.-g. Liu, Y.-l. Gu, Y. Xu, G.-m. Zeng, X.-j. Hu, S.-b. Liu, X. Wang, S.-m. Liu and J. Li, Bioresour. Technol., 2016, 212, 318–333 CrossRef PubMed.
- H. Narayani, R. Augustine, S. Sumi, M. Jose, K. D. Nair, M. Samsuddin, H. Prakash and S. Shukla, Sep. Purif. Technol., 2017, 172, 338–349 CrossRef.
- L. C. Apostol, L. Pereira, R. Pereira, M. Gavrilescu and M. M. Alves, Biodegradation, 2012, 23, 725–737 CrossRef PubMed.
- L. Lonappan, T. Rouissi, R. K. Das, S. K. Brar, A. A. Ramirez, M. Verma, R. Y. Surampalli and J. R. Valero, Waste Management, 2016, 49, 537–544 CrossRef PubMed.
- K. W. Jung, T. U. Jeong, H. J. Kang and K. H. Ahn, Bioresour. Technol., 2016, 211, 108–116 CrossRef PubMed.
- Z. Tian, M. Xiang, J. Zhou, L. Hu and J. Cai, Electrochim. Acta, 2016, 211, 225–233 CrossRef.
- J. Li, G. Wang, M. Chen, J. Li, Y. Yang, Q. Zhu, X. Jiang, Z. Wang and H. Liu, Bioresour. Technol., 2014, 169, 110–118 CrossRef PubMed.
- X. X. Wu, Z. W. Tian, L. Q. Hu, S. Huang and J. J. Cai, RSC Adv., 2017, 7, 32795–32805 RSC.
- X. Gao, W. Xing, J. Zhou, G. Wang, S. Zhuo, Z. Liu, Q. Xue and Z. Yan, Electrochim. Acta, 2014, 133, 459–466 CrossRef.
- Z. Zhang, K. Wang, J. D. Atkinson, X. Yan, X. Li, M. J. Rood and Z. Yan, J. Hazard. Mater., 2012, 229–230, 183–191 CrossRef PubMed.
- Y. Li, Q. Du, T. Liu, Y. Qi, P. Zhang, Z. Wang and Y. Xia, Appl. Surf. Sci., 2011, 257, 10621–10627 CrossRef.
- M. Wang, F. Hao, G. Li, J. Huang, N. Bao and L. Huang, Ecotoxicol. Environ. Saf., 2014, 104, 254–262 CrossRef PubMed.
- A. Özer, G. Gürbüz, A. Çalimli and B. K. Körbahti, Chem. Eng. J., 2009, 146, 377–387 CrossRef.
- K. Qiao, W. Tian, J. Bai, J. Dong, J. Zhao, X. Gong and S. Liu, Ecotoxicol. Environ. Saf., 2018, 149, 80–87 CrossRef PubMed.
- X. Zhu, Y. Gao, Q. Yue, Y. Kan, W. Kong and B. Gao, Ecotoxicol. Environ. Saf., 2017, 145, 289–294 CrossRef PubMed.
- M. C. Ncibi, S. Gaspard and M. Sillanpaa, J. Hazard. Mater., 2015, 286, 195–203 CrossRef PubMed.
- X. Li, K. Liu, Z. Liu, Z. Wang, B. Li and D. Zhang, Electrochim. Acta, 2017, 240, 43–52 CrossRef.
- X. L. Yu, J. F. Zhao, R. T. Lv, Q. H. Liang, Y. Bai, Z. H. Huang, W. C. Shen and F. Y. Kang, RSC Adv., 2015, 5, 75403–75410 RSC.
- A. L. Cazetta, T. Zhang, T. L. Silva, V. C. Almeida and T. Asefa, Appl. Catal., B, 2018, 225, 30–39 CrossRef.
- X. X. Huang, Y. G. Liu, S. B. Liu, X. F. Tan, Y. Ding, G. M. Zeng, Y. Y. Zhou, M. M. Zhang, S. F. Wang and B. H. Zheng, RSC Adv., 2016, 6, 94–104 RSC.
- Y. L. Li, Y. L. Li, L. P. Li, X. J. Shi and Z. Wang, Adv. Powder Technol., 2016, 27, 684–691 CrossRef.
- X. Y. Han, L. Chu, S. M. Liu, T. M. Chen, C. Ding, J. L. Yan, L. Q. Cui and G. X. Quan, Bioresources, 2015, 10, 2836–2849 Search PubMed.
- R. P. Han, L. J. Zhang, C. Song, M. M. Zhang, H. M. Zhu and L. J. Zhang, Carbohydr. Polym., 2010, 79, 1140–1149 CrossRef.
- F. Lian, G. N. Cui, Z. Q. Liu, L. Duo, G. L. Zhang and B. S. Xing, J. Environ. Manage., 2016, 176, 61–68 CrossRef PubMed.
- V. Nair and R. Vinu, Bioresour. Technol., 2016, 216, 511–519 CrossRef PubMed.
- L. Sun, D. M. Chen, S. G. Wan and Z. B. Yu, Bioresour. Technol., 2015, 198, 300–308 CrossRef PubMed.
- M. A. Islam, I. A. W. Tan, A. Benhouria, M. Asif and B. H. Hameed, Chem. Eng. J., 2015, 270, 187–195 CrossRef.
- I. A. W. Tan, A. L. Ahmad and B. H. Hameed, J. Hazard. Mater., 2008, 154, 337–346 CrossRef PubMed.
- Y. Wang, J. Zhou, L. Jiang, C. Ulven, G. Lubineau, G. Liu and J. Xiao, J. Polym. Environ., 2015, 23, 595–605 CrossRef.
- E. Ekrami, F. Dadashian and M. Arami, Desalin. Water Treat., 2015, 57, 7098–7108 CrossRef.
- J. Ma, F. Yu, L. Zhou, L. Jin, M. Yang, J. Luan, Y. Tang, H. Fan, Z. Yuan and J. Chen, ACS Appl. Mater. Interfaces, 2012, 4, 5749–5760 CrossRef PubMed.
- M. Auta and B. H. Hameed, Chem. Eng. J., 2014, 237, 352–361 CrossRef.
- J. Gong, H. J. Lin, M. Antonietti and J. Y. Yuan, J. Mater. Chem. A, 2016, 4, 7313–7321 RSC.
- H. Su, W. Li, Y. Han and N. Liu, Sci. Rep., 2018, 8, 6506 CrossRef PubMed.
- S. Y. Zhu, S. Fang, M. X. Huo, Y. Yu, Y. Chen, X. Yang, Z. Geng, Y. Wang, D. J. Bian and H. L. Huo, J. Hazard. Mater., 2015, 292, 173–179 CrossRef PubMed.
- W. Stawinski, A. Wegrzyn, T. Danko, O. Freitas, S. Figueiredo and L. Chmielarz, Chemosphere, 2017, 173, 107–115 CrossRef PubMed.
- Z. J. Wu, L. J. Kong, H. Hu, S. H. Tian and Y. Xiong, ACS Sustainable Chem. Eng., 2015, 3, 552–558 CrossRef.
- N. Mohammed, N. Grishkewich, R. Berry and K. Tam, Cellulose, 2015, 22, 3725–3738 CrossRef.
- A. T. Xie, J. D. Dai, X. Chen, P. Ma, J. S. He, C. X. Li, Z. P. Zhou and Y. S. Yan, Chem. Eng. J., 2016, 304, 609–620 CrossRef.
- Z. T. Han, B. Sani, W. Mrozik, M. Obst, B. Beckingham, H. K. Karapanagioti and D. Werner, Water Res., 2015, 70, 394–403 CrossRef PubMed.
- A. L. Cazetta, O. Pezoti, K. C. Bedin, T. L. Silva, A. Paesano Junior, T. Asefa and V. C. Almeida, ACS Sustainable Chem. Eng., 2016, 4, 1058–1068 CrossRef.
- D. Kolodynska, J. Krukowska and P. Thomas, Chem. Eng. J., 2017, 307, 353–363 CrossRef.
- M. M. Zhang, Y. G. Liu, T. T. Li, W. H. Xu, B. H. Zheng, X. F. Tan, H. Wang, Y. M. Guo, F. Y. Guo and S. F. Wang, RSC Adv., 2015, 5, 46955–46964 RSC.
| This journal is © The Royal Society of Chemistry 2018 |

