 Open Access Article
Gene function prediction based on combining gene ontology hierarchy with multi-instance multi-label learning
Zejun Liab,
Bo Liao *a,
Yun Lia,
Wenhua Liub,
Min Chenab and
Lijun Caia
aCollege of Information Science and Engineering, Hunan University, Changsha, Hunan 410082, China
bSchool of Computer and Information Science, Hunan Institute of Technology, Hengyang, 412002, China
First published on 10th August 2018
Abstract
Gene function annotation is the main challenge in the post genome era, which is an important part of the genome annotation. The sequencing of the human genome project produces a whole genome data, providing abundant biological information for the study of gene function annotation. However, to obtain useful knowledge from a large amount of data, a potential strategy is to apply machine learning methods to mine these data and predict gene function. In this study, we improved multi-instance hierarchical clustering by using gene ontology hierarchy to annotate gene function, which combines gene ontology hierarchy with multi-instance multi-label learning frame structure. Then, we used multi-label support vector machine (MLSVM) and multi-label k-nearest neighbor (MLKNN) algorithm to predict the function of gene. Finally, we verified our method in four yeast expression datasets. The performance of the simulated experiments proved that our method is efficient.
Introduction
In post-genomic era, predicting the functions of genes is one of the biggest challenges of genome function annotation. With the rapid advancements in high-throughput bio-based technologies, such as microarray expression profiles, a large number of biological data have been produced.1,2 These data provide valuable information for predicting gene functions. Recently, time-series gene expression profile datasets have been widely used to predict gene function, in which genes with similar expression patterns may have similar functions.3 Many efforts have been made to settle this task based on this assumption. Zhao et al.4 presented a new technique, namely, Annotating Genes with Positive Samples (AGPS), for defining negative samples in gene function prediction. Barutcuoglu et al.5 developed a Bayesian framework for combining multiple classifiers based on the functional taxonomy constraints. Experiments show that over 105 nodes sub-hierarchy of the gene ontology (GO) the Bayesian framework improves predictions for 93 nodes. Vinayagam et al.6 developed a large-scale annotation system and annotations were provided through GO terms by applying multiple SVMs for the classification of correct and false predictions. Pei et al.7 proposed a novel method for the function annotation of new biological sequences by using the variable-precision rough set theory. Doniger et al.8 proposed a tool called MAPPFinder, which created a global gene-expression profile across all areas of biology by integrating the annotations of the GO project. Huang et al.9 discussed various sorts and varieties of gene annotation enrichment analysis tools. Approximately 68 gene annotation enrichment tools that are currently available in the community were collected in this survey. These tools are uniquely categorized into three major classes, according to their underlying enrichment algorithms. Zhang et al.10 have created a web-based tool for data analysis and data visualization for sets of genes called GOTree Machine (GOTM). Although this tool was originally intended to analyze sets of co-regulated genes identified from microarray analysis, it is adaptable for use with other gene sets from other high-throughput analyses. Draghici et al.11 developed Onto-Express as a novel tool capable of automatically translating differentially regulated genes into functional profiles that characterize the impact of the condition studied. Despite the good performance of the machine learning techniques, there are still two characteristics of the function-prediction task that are different from common machine learning tasks: (1) a single gene may have multiple functions; and (2) the functions are organized in a hierarchy, i.e., a gene that is related to some functions is automatically related to all its ancestral functions (this is called the hierarchy constraint).12 Therefore, we combined multi-label learning frame with gene ontology hierarchy13 to settle this task.In this study, we improved multi-instance hierarchical clustering (MIHC)14 with gene ontology hierarchy. Then, MLSVM and MLKNN classifiers were used to predict the function of genes in time-course gene expression profile.1 There are numerous classification methods that have been used in bioinformatics.15–18 In the section of Materials and methods, we will introduce the predicting task, MLSVM and MLKNN algorithms. And, the MIHC method will be introduced. In the section of Experiment and results, we describe the application of MIHC method to the real data in GO database to examine its effectiveness. Numerical results show that the proposed method has better precision, recall-rate and harmonic mean value.
Materials and methods
Gene function prediction task
The goal of gene function annotation task is to find the function of un-annotation genes. The general calculation approach is to calculate the relationship between the genes and the various functions by a variety of biological models to predict the un-annotation genes.19–23From the correspondence between genes and its functions, a gene can be transcribed and translated into various proteins and can execute many different functions.24–27 Similarly, the in vivo biological process is not borne by a single gene, but by multiple genes working together.15 Therefore, the relationship formed between the genes and its corresponding function is N to N mapping. Among the learning frameworks, the multi-instance multi-label learning framework is perfectly suited for N to N mapping. There is a certain degree of correlation between genes and genes and between gene functions and gene functions. However, the degradation processing in multi-instance multi-label learning framework destroys these correlations. Therefore, it is necessary to maintain the relevance when multi-instance multi-label learning framework is implemented.
Gene ontology hierarchy
GO database is a standard model with a hierarchical tree structure, designed to standardize biological knowledge of genes and their products. Overall, GO database is a directed acyclic graph (DAG), covering three branches: Biological Process (BP), Molecular Function (MF) and Cellular Components (CC). Also, there is no intersection between any two of the three branches. Moreover, GO database contains gene annotations of most of the microorganisms, plants and animal species, and GO terms can be used in multiple databases, maintaining the consistency of each gene described in different databases.GO database was constructed by DAG, which treats GO terms as nodes of DAG and the relationship of GO terms as edges of DAG. The GO DAG also describes its terms by referring terms of the tree structure, such as tree root node, parent nodes, child nodes, leaf nodes and levels. This makes GO DAG easier to be understood. In GO DAG, the parent node closer to the root is described as rougher, while child nodes further from the root are described as finer. Therefore, genes annotated with the GO terms have the highest possible level of details, which corresponds to the lowest level of abstraction.28
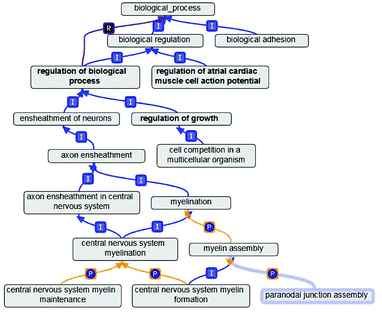
There are three semantic relations between GO terms, namely, is_a, part_of and regulates. Among the three relationships, is_a and part_of relationships are transitive, while regulates relationships can be classified as the regulation of relations and under the control of the relationship. We simply describe these three relationships as follows. (1) The is_a relationship shows a relationship comprising a single included relationship. It also has the transitive. In other words, A is_a B represents A is subset of B. Moreover, the relationship can be inferred from A is_a C and C is_a B. We formulated these derivation relationships as is_a × is_a → is_a. (2) The part_of relationships are similar to is_a relationships. A part_of B indicates that if A is present, then A is a subset of B, but A does not necessarily occur. Similar to is_a relationship, part_of relationship also has the transitive. Therefore, we can also formulate the derivation relationships of part_of as part_of × part_of → part_of. (3) In comparison with the previous two relationships, the regulates relationship is slightly different. In GO semantics, if A can directly affect B, this affection, called A to B, has a regulatory role, i.e., A regulates B. The expressions of the three relationships in the GO database are shown in the Fig. 1. In Fig. 1, the alphabet “I” represents is_a relationship, “P” represents part_of relationship and “R” represents regulates relationship.
MIML learning framework
The multi-instance multi-label learning (MIML) framework was proposed by Zhou et al.29 Formally, MIML can be defined as follows:Let x = {x1,x2,…,xm} represent set of instances and y = {y1,y2,…,yn}denote set of labels. Given the dataset {(X1,Y1),(X2,Y2),…,(Xt,Yt)}, the goal of the learning task is the mapping of f: 2x → 2y, where Xi ⊂ x is a bag-of-instances while Yi ⊂ y is a subset of labels.
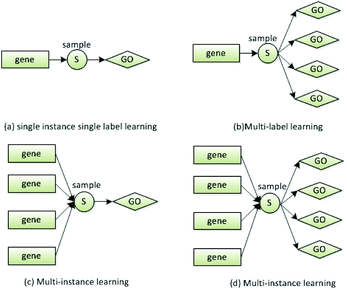
In this study, we solved the MIML task by degeneration approach. First, MIML task was degenerated into multi-instance learning (MLL) or multi-label learning (MIL). Then, MLL or MIL was continually degenerated into single instance single label learning (SISL). The relationships of these learning frameworks are shown in Fig. 2. As shown in the subgraph (b), a gene is annotated by multiple GO terms. Fig. 2(c) shows that a GO term is a set of genes. The relationship shown in (b) is called multi-label,30 and that shown in (c) is called multi-instance.31 We used (b) or (c) as a bridge to degenerate (d) into (a). In this study, we used MLL algorithm to predict the annotation of novel genes. The pseudo code of MLL algorithms, which are MLSVM32,33 and MLKNN,34,35 are shown in Tables 1 and 2.
| Input: S-the training set, T-the test samples | |
| Output: YT-the set of predicted labels of T | |
| 1 | For training set S = {(xi,Yi)|i = 1,2,…,N}, calculate the kernel matrix |
| 2 | For each label y ∈ Y, Y = {Yi|i = 1,2,…,N} |
| 3 | Produce a sub-training set Sy = {(xi,ψ(xi,y))|i = 1,2,…,N} |
| 4 | Train a SVM model My = svmtrain(Sy) |
| 5 | For a test sample ti ∈ T |
| 6 | Its labels are obtained by Yti = {y|My(ti) ≥ 0} |
| 7 | End |
| 8 | End |
| 9 | YT = {Yti|i = 1,2,…,N} |
MIHC+ algorithm
Despite the MIHC algorithm making many efforts on gene annotation task, there are some limitations. MIHC does not consider the GO DAG when it clusters GO terms. In this study, we improved on this issue with GO hierarchy when GO terms were clustered.Hierarchical Clustering36 is a widely used machine learning technology. General hierarchical clustering algorithm can be described as follows:
Step 1: determine all objects' dissimilarities by calculating the distance between each pair of objects, like Euclidean distance.
Step 2: collect two closest objects or clusters and merge them into one class.
Step 3: recalculate all dissimilarities between new clusters or objects.
Step 4: return to Step 2 until certain conditions are satisfied or certain number of clusters generated.
However, it is absurd that all objects are clustered into the same class. Hence, when certain conditions are satisfied, the algorithm is stopped. The end condition of MIHC algorithm is that no new cluster is generated. We still used formulae in MIHC to calculate the distance between bag-of-instances.
| Corr(Gi) = ∑|corr(genei,genej)|, where genei,genej ∈ Gi | (1) |
 | (2) |
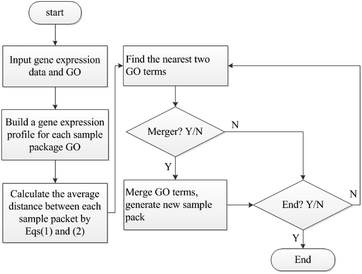
The flowchart of MIHC+ algorithm is shown in the Fig. 3. In the algorithm, the merger condition is the most important. We also defined the merger calculate condition as D(GOi,GOj) ≤ max(D(GOi),D(GOj)), but MIHC+ algorithm needs another condition to merge two GO terms. Following the GO hierarchy, we up-propagated the two GO terms; if one of them owns a common ancestor in the GO database, we merge them. If there are no more new GO terms needed to be merged, the algorithm comes to an end. In other words, MIHC+ algorithm completely obeys the knowledge of GO hierarchy.
Experiment and results
Experiment
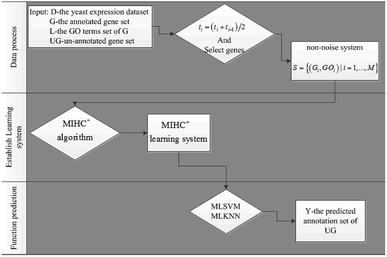
Time-series expression datasets in the experiment were obtained from ref. 37, and can be downloaded from ref. 38. These four datasets are yeast cell cycle expression data with different time points and circumstances. Gene annotation data can be obtained from GO database, which can be downloaded from ref. 39. We used the method in ref. 40 to preprocess the raw data and always make the first value 0. Then, the average transformation ti = (ti + ti−1)/2 was used to smooth out spikes. After the data process, we used the method in ref. 14 to select genes that are significantly correlated with each other in the same function. Then, the non-noise system of expression data and annotation are represented as S = {(Gi,GOi)|i = 1,…,M}. Subsequently, the MIHC+ algorithm was used to the construct learning system. Finally, MLSVM and MLKNN classifiers were used to verify the performance of the learning system. The flow chart of the gene function prediction is shown in Fig. 4.Leave-one-out and leave-a-percent-out cross validation41 approaches were used for evaluating the performance of the function prediction algorithm. We selected the latter method to evaluate the MIHC+ method. To accurately measure the performance, the receiver operating characteristic (ROC) curve and area under the ROC curve (AUC) were introduced to quantify the results. The classifications were often based on continuous random variables. The probability of belonging in a class varies with different threshold parameters. In other words, the values of true and false positive rates (TPR and FPR, respectively) vary with different threshold parameters. The ROC curve parametrically plots TPR versus FPR with varying parameters. TPR and FPR were calculated by eqn (3) and (4).
| TPR = TP/(TP + FN) | (3) |
| FPR = FP/(FP + TN) | (4) |
Results
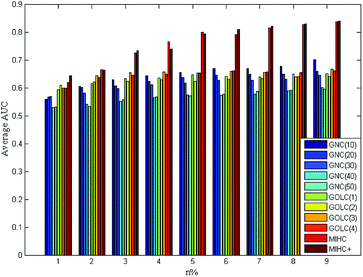
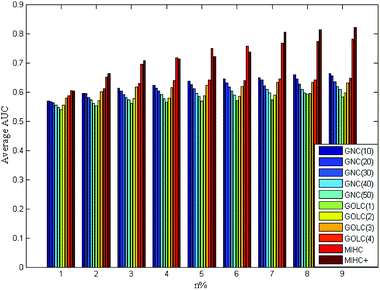
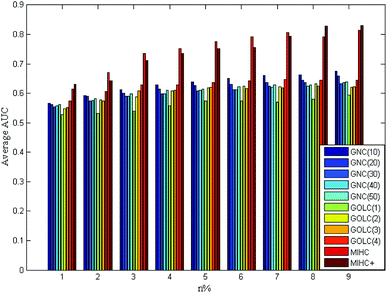
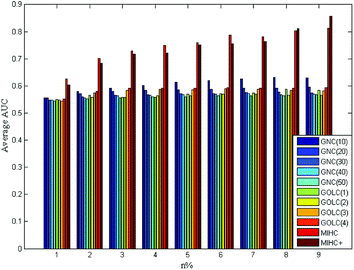
The four yeast time-course expression datasets are alpha, cdc15, cdc28 and elution, which record mRNA level of 18, 24, 17 and 14 time points in whole cell cycle under different circumstances, respectively. For each expression dataset, MIHC+ and other three methods (GNC, GOLC and MIHC) in ref. 14 were used to construct learning system. Then, all learning systems were tested by MLSVM and MLKNN classifiers. In the classification task, the multi-label learning task is decomposed into a series of binary classification tasks. The experimental settings are the same as that in ref. 14. For each expression dataset, the average results obtained from each learning system by MLSVM classifier are shown in Fig. 5–8. The data in these figures indicate that the MIHC+ learning system has a similar performance with MIHC. The results from cdc28 dataset are shown in Table 3. However, MIHC+ method can give more biological information. From MIHC+ learning system, we found that the GO term named ‘GO: 0009987’ appears in all of these datasets and only 7 genes, which own ‘GO: 0009987’, appear in cdc28 and cdc15 dataset. From the GO, we find that ‘GO: 0009987’ named “cellular process” is defined as “any process that is carried out at the cellular level, but not necessarily restricted to a single cell”. For example, cell communication occurs among more than one cell, but at the cellular level.| Method | n% | |||||||||
|---|---|---|---|---|---|---|---|---|---|---|
| 10 | 20 | 30 | 40 | 50 | 60 | 70 | 80 | 90 | ||
| GNC | λ = 10 | 0.559 | 0.606 | 0.631 | 0.644 | 0.656 | 0.671 | 0.670 | 0.679 | 0.703 |
| λ = 20 | 0.569 | 0.603 | 0.607 | 0.625 | 0.638 | 0.646 | 0.650 | 0.650 | 0.661 | |
| λ = 30 | 0.571 | 0.583 | 0.599 | 0.612 | 0.618 | 0.629 | 0.628 | 0.632 | 0.646 | |
| λ = 40 | 0.529 | 0.543 | 0.552 | 0.567 | 0.577 | 0.574 | 0.578 | 0.589 | 0.602 | |
| λ = 50 | 0.532 | 0.535 | 0.558 | 0.569 | 0.572 | 0.579 | 0.588 | 0.592 | 0.596 | |
| GOLC | ι = 1 | 0.594 | 0.617 | 0.634 | 0.635 | 0.648 | 0.643 | 0.641 | 0.651 | 0.653 |
| ι = 2 | 0.609 | 0.623 | 0.624 | 0.631 | 0.624 | 0.632 | 0.635 | 0.640 | 0.643 | |
| ι = 3 | 0.601 | 0.644 | 0.657 | 0.658 | 0.654 | 0.661 | 0.656 | 0.643 | 0.668 | |
| ι = 4 | 0.601 | 0.638 | 0.647 | 0.651 | 0.654 | 0.663 | 0.658 | 0.656 | 0.662 | |
| MIHC | 0.621 | 0.666 | 0.727 | 0.767 | 0.800 | 0.794 | 0.817 | 0.828 | 0.838 | |
| MIHC+ | 0.644 | 0.665 | 0.735 | 0.740 | 0.796 | 0.811 | 0.822 | 0.831 | 0.840 | |
The results of the experiments in four datasets proved that genes involved in the same biological processes may vary with external environment. Moreover, the ref. 37 also points towards this view because yeast cells automatically turn on or turn off certain genes' expression in order to adapt to the external environment when cells are in different growth environments. We present some GO terms and its genes for four different datasets in Table 4–7. As summarized in these tables, all of genes in the unit of “Genes” have the corresponding GO terms in the unit of “GO terms”.
| Environment | Alph | ||||
| Genes | YBR189W | YGL189C | YGR214W | YJR123W | YOL121C |
| YER025W | YGR094W | YGR285C | YNL178W | ||
| YGL123W | YGR118W | YHR064C | YNL209W | ||
| GO terms | GO:0008152 | GO:0009987 | GO:0044237 | GO:0044238 | GO:0071704 |
| Environment | cdc15 | ||||
| Genes | YBR048W | YGL030W | YKL006W | YLR333C | YOL120C |
| YDL061C | YGL103W | YKR057W | YLR367W | YOL127W | |
| YDL083C | YGR034W | YKR094C | YLR388W | YOR063W | |
| YDR064W | YGR214W | YLR075W | YML073C | YOR167C | |
| YDR418W | YHR203C | YLR167W | YML091C | YPL131W | |
| YER102W | YIL069C | YLR185W | YNL209W | ||
| YFR031C-A | YIL133C | YLR264W | YOL040C | ||
| GO terms | GO:0000462 | GO:0006396 | GO:0016072 | GO:0042274 | GO:0071704 |
| GO:0000469 | GO:0006725 | GO:0022613 | GO:0043170 | GO:0071840 | |
| GO:0000478 | GO:0006807 | GO:0030490 | GO:0044085 | GO:0090304 | |
| GO:0000479 | GO:0008152 | GO:0034470 | GO:0044237 | GO:0090305 | |
| GO:0000480 | GO:0009987 | GO:0034641 | GO:0044238 | GO:0090501 | |
| GO:0006139 | GO:0010467 | GO:0034660 | GO:0044260 | GO:0090502 | |
| GO:0006364 | GO:0016070 | GO:0042254 | GO:0046483 | GO:1901360 | |
| Environment | cdc28 | ||||
| Genes | YBL027W | YDL191W | YJR145C | YLR367W | YOR312C |
| YBL087C | YDR025W | YKL180W | YNL162W | YPL143W | |
| YBR048W | YDR064W | YKR057W | YNL302C | YPL198W | |
| YBR084C-A | YDR447C | YKR094C | YOL120C | YPR132W | |
| YBR181C | YHL001W | YLR185W | YOL121C | ||
| YDL075W | YJL189W | YLR287C-A | YOR234C | ||
| GO terms | GO:0009987 | GO:0044699 | GO:0044763 | ||
| Environment | Elution | ||||
| Genes | YBL047C | YEL048C | YJL154C | YLR361C | YNL192W |
| YBL099W | YER096W | YJR017C | YLR371W | YOR273C | |
| YBR038W | YFL038C | YJR032W | YLR417W | YOR332W | |
| YBR127C | YFR026C | YJR121W | YML034W | YPR156C | |
| YCR069W | YGR106C | YKL002W | YML078W | YPR165W | |
| YDL089W | YGR138C | YKL080W | YMR054W | ||
| YDR304C | YHL006C | YKL203C | YMR089C | ||
| YDR519W | YHR079C | YLR106C | YNL026W | ||
| GO terms | GO:0009987 | ||||
Conclusion
In this study, we improve the MIHC method with gene ontology hierarchy (MIHC+ method) to construct a learning system. Our method was verified on four yeast gene expression datasets. The MIHC+ method treats gene ontology hierarchy as the relationship between gene annotations and then, Hierarchical Clustering follows the GO hierarchy to cluster them. Compared with other learning systems employed in this study, the MIHC+ method obtained more biological knowledge from the time-series expression dataset. It also has a similar performance with MIHC method. In future research, we will combine gene annotation information with other biological information (e.g., single nucleotide polymorphism,42,43 and miRNA44–52) to diagnose complex diseases more accurately.Conflicts of interest
There are no conflicts to declare.Acknowledgements
This study was supported by National Natural Science Foundation of China (Grant Nos. 61672223, 61672214 and 61772192), National Nature Science Foundation of Hunan Province (Grant No. 2016JJ4029). Key research and development project of Hunan Province (Grant No. 2015GK3029).References
- X. Chen, Y. A. Huang, Z. H. You, G. Y. Yan and X. S. Wang, Bioinformatics, 2016, 33, 733–739 Search PubMed.
- B. Liao, Y. Jiang, G. Yuan, W. Zhu, L. Cai and Z. Cao, PLoS One, 2014, 9, e104314 CrossRef PubMed.
- X. Zhou, M. C. J. Kao and W. H. Wong, Proc. Natl. Acad. Sci. U. S. A., 2002, 99, 12783–12788 CrossRef PubMed.
- X. M. Zhao, Y. Wang, L. Chen and K. Aihara, BMC Bioinf., 2008, 9, 1–14 CrossRef PubMed.
- Z. Barutcuoglu, R. E. Schapire and O. G. Troyanskaya, Bioinformatics, 2006, 22, 830–836 CrossRef PubMed.
- A. Vinayagam, R. König, J. Moormann, F. Schubert, R. Eils, K. H. Glatting and S. Suhai, BMC Bioinf., 2004, 5, 116 CrossRef PubMed.
- Z. L. Pei, X. H. Shi, M. Niu, X. N. Tang and L.S. Liu, J. Bionic Eng., 2007, 4, 177–184 CrossRef.
- S. W. Doniger, N. Salomonis, K. D. Dahlquist, K. Vranizan, S. C. Lawlor and B. R. Conklin, Genome Biol., 2003, 4, R7 CrossRef PubMed.
- D. W. Huang, B. T. Sherman and R. A. Lempicki, Nucleic Acids Res., 2009, 37, 1 CrossRef PubMed.
- B. Zhang, D. Schmoyer, S. Kirov and J. Snoddy, BMC Bioinf., 2004, 5, 1–8 CrossRef PubMed.
- S. Draghici, P. Khatri, R. P. Martins, G. C. Ostermeier and S. A. Krawetz, Genomics, 2003, 81, 98–104 CrossRef PubMed.
- L. Schietgat, C. Vens, J. Struyf, H. Blockeel, D. Kocev and S. Dzeroski, BMC Bioinf., 2010, 11, 2 CrossRef PubMed.
- B. Liao, X. Li, L. Cai, Z. Cao and H. Chen, IEEE/ACM Trans. Comput. Biol. Bioinf., 2015, 12, 113–122 Search PubMed.
- B. Liao, Y. Li, Y. Jiang and L. Cai, PLoS One, 2014, 9, e90962 CrossRef PubMed.
- X. Chen and L. Huang, PLoS Comput. Biol., 2017, 13, e1005912 CrossRef PubMed.
- C. Xing, B. Ren, C. Ming, Q. Wang, L. Zhang and G. Yan, PLoS Comput. Biol., 2016, 12, e1004975 CrossRef PubMed.
- B. Liao, X. Li, W. Zhu and Z. Cao, IEEE/ACM Trans. Comput. Biol. Bioinf., 2012, 9, 1529–1534 Search PubMed.
- B. Liao, B. Liao, X. Sun and Q. Zeng, Bioinformatics, 2010, 26, 2678–2683 CrossRef PubMed.
- X. Chen, D. Xie, Q. Zhao and Z. H. You, Briefings Bioinf., 2017, 18, 558 Search PubMed.
- X. Chen, C. C. Yan, X. Zhang and Z.-H. You, Briefings Bioinf., 2016, bbw060 CrossRef PubMed.
- B. Liao, Y. Jiang, W. Liang, W. Zhu, L. Cai and Z. Cao, IEEE/ACM Trans. Comput. Biol. Bioinf., 2014, 11, 1146–1156 Search PubMed.
- Y. Wang, Z. You, L. Xiao, C. Xing, T. Jiang and J. Zhang, Int. J. Mol. Sci., 2017, 18, 1029 CrossRef PubMed.
- Z. H. You, Z. A. Huang, Z. Zhu, G. Y. Yan, Z. W. Li, Z. Wen and X. Chen, PLoS Comput. Biol., 2017, 13, e1005455 CrossRef PubMed.
- X. Chen, C. C. Yan, X. Zhang, X. Zhang, F. Dai, J. Yin and Y. Zhang, Briefings Bioinf., 2016, 17, 696 CrossRef PubMed.
- X. Chen and G. Y. Yan, Bioinformatics, 2013, 29, 2617–2624 CrossRef PubMed.
- X. Li, B. Liao, L. Cai, Z. Cao and W. Zhu, IEEE/ACM Trans. Comput. Biol. Bioinf., 2013, 10, 688–695 Search PubMed.
- Z. W. Li, Z. H. You, X. Chen, J. Gui and R. Nie, Int. J. Mol. Sci., 2016, 17, 1396 CrossRef PubMed.
- P. Khatri and S. Drăghici, Bioinformatics, 2005, 21, 3587–3595 CrossRef PubMed.
- Z. H. Zhou, M. L. Zhang, S. J. Huang and Y. F. Li, Corros. Abstr., 2008, arxiv: abs/0808.3231 Search PubMed.
- G. Tsoumakas, I. Katakis and D. Taniar, Int. J. Data Warehous. Min., 2007, 3, 1–13 Search PubMed.
- Z. H. Zhou, Multi-instance learning: A survey, Technical Report, 2004,Department of Computer Science & Technology, 2004, p. 1–31 Search PubMed.
- Y. X. Li, S. Ji, S. Kumar, J. Ye and Z. H. Zhou, IEEE/ACM Trans. Comput. Biol. Bioinf., 2012, 9, 98–112 Search PubMed.
- C. Cortes and V. Vapnik, Mach. Learn., 1995, 20, 273–297 Search PubMed.
- T. Denœux, IEEE Trans. Syst. Man Cybern. Syst., 2008, 25, 804–813 CrossRef.
- M. L. Zhang and Z. H. Zhou, Pattern Recognit., 2007, 40, 2038–2048 CrossRef.
- S. C. Johnson, Psychometrika, 1967, 32, 241–254 CrossRef PubMed.
- P. T. Spellman, G. Sherlock, M. Q. Zhang, V. R. Iyer, K. Anders, M. B. Eisen, P. O. Brown, D. Botstein and B. Futcher, Mol. Biol. Cell, 1998, 9, 3273–3297 CrossRef PubMed.
- http://genome-www.stanford.edu/cellcycle/data/rawdata/.
- http://www.geneontology.org/GO.downloads.annotations.shtml.
- J. Ernst, G. J. Nau and Z. Barjoseph, Bioinformatics, 2005, 1(21 Suppl), i159 CrossRef PubMed.
- A. Magi, L. Tattini, M. Benelli, B. Giusti, R. Abbate and S. Ruffo, PLoS One, 2012, 7, e38767 CrossRef PubMed.
- X. Li, Bioinformatics, 2017, 33, 2829–2836 CrossRef PubMed.
- X. Li, Curr. Bioinf., 1969, 12, 367–372 Search PubMed.
- X. Chen, C. C. Yan, X. Zhang, Z. H. You, L. Deng, Y. Liu, Y. Zhang and Q. Dai, Sci. Rep., 2016, 6, 21106 CrossRef PubMed.
- G. Li, J. Luo, X. Qiu, L. Cheng and P. Ding, J. Biomed. Inf., 2018, 82, 169–177 CrossRef PubMed.
- G. Li, J. Luo, Q. Xiao, C. Liang, P. Ding and B. Cao, IEEE Access, 2017, 5, 24032–24039 Search PubMed.
- G. Li, J. Luo, Q. Xiao, C. Liang and P. Ding, RSC Adv., 2018, 8, 4377–4385 RSC.
- X. Chen, L. Wang, J. Qu, N.-N. Guan and J.-Q. Li, Bioinformatics, 2018 DOI:10.1093/bioinformatics/bty503.
- X. Chen, D. Xie, L. Wang, Q. Zhao, Z. H. You and H. Liu, Bioinformatics, 2018 Search PubMed.
- H. Lee, S. Lee and H. L. Chang, Appl. Math. Comput., 2016, 286, 232–249 CrossRef.
- X. Chen, L. Huang, D. Xie and Q. Zhao, Cell Death Dis., 2018, 9, 3 CrossRef PubMed.
- J. Qu, X. Chen, Y. Z. Sun, J. Q. Li and Z. Ming, J. Cheminf., 2018, 10, 30 Search PubMed.
| This journal is © The Royal Society of Chemistry 2018 |

