 Open Access Article
Electrochemical surface engineering of magnesium metal by plasma electrolytic oxidation and calcium phosphate deposition: biocompatibility and in vitro degradation studies
M. Bobby Kannan *ab,
R. Waltera,
A. Yamamotob,
H. Khakbaza and
C. Blawertc
aBiomaterials and Engineering Materials (BEM) Laboratory, College of Science and Engineering, James Cook University, Townsville, Queensland 4811, Australia. E-mail: bobby.mathan@jcu.edu.au
bResearch Center for Functional Materials, National Institute for Materials Science (NIMS), Tsukuba, Ibaraki 305-0044, Japan
cInstitute of Materials Research, Helmholtz-Zentrum Geesthacht, Zentrum für Material-und Küstenforschung GmbH, Geesthacht D 21502, Germany
First published on 16th August 2018
Abstract
In this study, the surface of magnesium metal was electrochemically engineered for enhanced biocompatibility and controlled degradation in body fluid. Firstly, a plasma electrolytic oxidation (PEO) coating was formed on magnesium, followed by electrochemical deposition of calcium phosphate (CaP) using an unconventional electrolyte. Cytocompatibility tests using L929 cells revealed that the PEO-CaP coating significantly improved the biocompatibility of magnesium. In vitro electrochemical degradation experiments in simulated body fluid (SBF) showed that the PEO-CaP coating improved the degradation resistance of magnesium significantly. The corrosion current density (icorr) of the PEO-CaP coated magnesium was ∼99% and ∼97% lower than that of bare magnesium and the PEO-only coated magnesium, respectively. Similarly, electrochemical impedance spectroscopy (EIS) results showed that the polarisation resistance (RP) of the PEO-CaP coated magnesium was one-order of magnitude higher as compared to the PEO-only coated magnesium and two-orders of magnitude higher than the bare magnesium, after 72 h immersion in SBF. Scanning electron microscopy (SEM) analysis revealed no localized degradation in the PEO-CaP coated magnesium. The study demonstrated that the PEO-CaP coating is a promising combination for enhancing the biocompatibility and reducing the degradation of magnesium for potential biodegradable implant applications.
1. Introduction
In recent years, a wide range of biocompatible coatings including calcium phosphates (CaPs),1–4 plasma electrolytic oxidation (PEO) coatings5–7 and biodegradable polymers8–10 have been studied for magnesium and its alloys, primarily to reduce their initial degradation rate for potential biodegradable implant applications. These coatings could potentially delay the localized degradation of magnesium-based materials, which is critical, since localised degradation sites in these materials can act as stress concentration points and facilitate crack propagation and failure in load-bearing conditions.11–14Biocompatible CaPs have been commonly used as coatings on metallic implant materials such as titanium-based materials and stainless steel to improve osseointegration and osteoconductivity.15–17 Recently, there has been a surge in the research on CaP coatings on magnesium-based materials, especially for controlling their degradation rate.3,18,19 While CaP coatings using different methods have shown some improvement in the degradation resistance of these highly degrading materials, there are concerns regarding the poor adherence and cracking of the coatings on magnesium-based materials, which limit their performance.3
PEO is a high voltage anodizing technique which produces a hard abrasion-resistant and well-adherent coating on metal substrates.20–22 A significant amount of work has been done on PEO coatings on magnesium-based materials.6,23,24 Typically, in a PEO coating the layer adjacent to the substrate is thin and highly compact, which has been shown to greatly contribute to the overall degradation resistance of the coating.24,25 On top of this compact barrier layer is a thick and highly porous layer with a pore size ∼1–10 μm.23,26 This porous structure forms during the coating process due to the co-existence of molten oxide and gas bubbles caused by high energy discharges.20 Our research group6 investigated the in vitro degradation performance of a pulsed-potential silicate-based PEO coating on magnesium. A 65% reduction in the corrosion current (icorr) and one-order of magnitude increase in the polarisation resistance (RP) as compared to the bare metal were observed. However, EIS modelling indicated that very little of the overall RP came from the porous layer, and was instead dominated by the compact inner barrier layer. The porous nature of the outer layer allows penetration of electrolyte over time and reduces the effectiveness of the coating under relatively long-term exposure.27 The aggressive chloride ions in body fluid could penetrate through the pores and attack the inner compact layer, which has been reported to be mainly magnesium oxide.28
In order to reduce the penetration of electrolyte through pores and/or micro cracks in PEO coatings, researchers have recently focused on dual-layer coatings.29–34 A second coating layer to seal the PEO outer porous layer could produce magnesium-based implants with acceptable service life. Liu et al.29 chemically coated a CaP layer on top of a PEO coated pure magnesium. The authors reported a lower volume of evolved hydrogen during a degradation period of 132 h (meaning low degradation) for the PEO-CaP coated magnesium as compared to the PEO-only coated magnesium. Interestingly, the potentiodynamic polarisation results showed only a slight decrease in the icorr, from ∼5 μA cm−2 to ∼3 μA cm−2. Microscopy analysis of the dual-layer coating exhibited two regions, flake-like and porous spherical-shaped structures. This morphology may still allow penetration of electrolyte through the coating layer and attack of the base metal under long-term exposure.
Recently, our research group32 electrochemically deposited CaP on silicate-based PEO coated magnesium using a pulsed constant-current method. A 96% reduction in the icorr and a two-order of magnitude increase in the RP of the PEO-CaP coated magnesium as compared to bare magnesium were reported. However, the RP of the PEO-CaP coated magnesium decreased with exposure time, to a minimum of 20% of its original value after 72 h immersion. Gao et al.34 produced PEO-hydroxyapatite on a magnesium substrate. The authors reported a significant improvement in the degradation resistance of the coated magnesium when compared to both bare magnesium and PEO-alone coated magnesium. But the RP of this coating dropped rapidly during the immersion period, reducing the RP approximately one-third of its original value after only 4 h immersion. SEM images revealed porosity and cracking, which allow penetration of electrolyte and contact the substrate. These dual-layer coating studies suggest that the coverage of CaP particles on PEO coating should be improved for effective long-term performance.
One practical approach to extend the performance life of the coating is to improve the packing of CaP particles on the PEO layer such that the porosity of the coating is low and thus reduces the permeation of the electrolyte. Recently, our research group35,36 demonstrated that the packing density of CaP coating on magnesium-based materials can be increased by electrochemical deposition in an unconventional electrolyte. It was found that addition of ethanol to the conventional CaP coating solution reduces hydrogen evolution reaction during the coating process and consequently produces a more compact CaP coating. This novel approach could produce a CaP coating on PEO with sufficient long-term stability and also delay the localized degradation of magnesium-based materials.
The aim of this study was to produce a high-performance PEO-CaP coating on pure magnesium using electrochemical methods. The cytocompatibility of the PEO-CaP coated magnesium was evaluated using murine fibroblast L929 by WST-1 assay and compared with the PEO-only coated and bare magnesium. The in vitro degradation behaviour of the bare and coated magnesium samples was investigated using electrochemical techniques.
2. Material and methods
2.1. Material and coatings
In this study, pure magnesium (chemical composition given in Table 1) was used as a base material for coating. Plasma electrolytic oxidation (PEO) coating was carried out in an electrolyte containing 2 g L−1 Ca(OH)2 and 10 g L−1 Na3PO4. Prior to the PEO coating, the samples were incrementally ground from 120 to 1200 grit SiC paper, followed by ultrasonically cleaning in ethanol and then dried. A pulsed DC supply was used for a treatment time of 10 min, with a constant voltage of 450 V and 2 ms/18 ms pulse on/off time. The optimisation of the PEO processing parameters can be found elsewhere.37 Three specimens with dimensions of 15 × 15 × 4 mm or one specimen with dimension of 25 × 25 × 4 mm were treated in one batch and the maximum current allowed was set to 2 A. The final current at the end of the 10 min treatment was recorded as 0.125 ± 0.015 A.| Element | Zn | Ca | Fe | Cu | Al | Mn | Si | Mg |
| Weight % | 0.008 | 0.003 | 0.004 | 0.001 | 0.007 | 0.002 | 0.01 | 99.965 |
Electrochemical deposition of calcium phosphate (CaP) was done on the PEO coated magnesium using a typical three-electrode system, with an Ag/AgCl (in saturated KCl) reference electrode, graphite counter electrode and sample as working electrode. The coating solution contained 0.1 M Ca(NO3)2, 0.06 M NH4H2PO4 and 30% v/v ethanol. Our previous work35 on a bare magnesium metal showed that 30% v/v ethanol addition decreased the conductivity of the coating electrolyte, which significantly reduced the hydrogen evolution/bubble bursting and thereby improved the packing density of the CaP coating. The CaP coating was performed using a potentiostat (Model: VersaSTAT 3 potentiostat controlled by PowerCORR software) under a constant potential of −3 VAg/AgCl (based on our previous work)38 for 1 h. The PEO and PEO-CaP coatings were characterised using X-ray diffraction (XRD; Diffractometer Model: Rint-Ultima III, Rigaku Co., Tokyo, Japan; operated at 40 kV to 40 mA with Cu-Kα for the diffraction angle in the range from 10° to 60°) and Fourier transform infrared (FTIR) spectroscopy (Model: Perkin Elmer spectrum 100 FTIR spectrometer). The coating thickness was measured using a coating thickness gauge (Model: Dual Scope®) and the morphology of the coatings was examined using a scanning electron microscope (SEM; Model: Jeol JSM5410L).
2.2. Cytocompatibility testing
The cytocompatibility evaluation of the pure magnesium, PEO and PEO-CaP coated magnesium samples was carried out using L929 murine fibroblast, which is one of the recommended cell lines by ISO10993-5. Eagle's minimum essential medium (Eagle's MEM “Nissui” 1, Nissui Pharmaceutical Co. Ltd., Japan) supplemented with 10% (v/v) fetal bovine serum (E-MEM + FBS) was employed as the cell culture medium. The chemical composition of E-MEM is shown in Table 2. The sample dimensions were as follows: 15 × 15 × 4 mm for pure magnesium and PEO-CaP coated magnesium, and 25 × 25 × 4 mm for PEO-only coated magnesium. After ultrasonic cleaning with absolute ethanol followed by acetone, the test samples were sterilized in ethylene oxide gas. The sterilized samples were placed in a deep vessel where L929 cells were inoculated at a density of 1000 cells per mL in 27.5 mL of E-MEM + FBS for pure magnesium and PEO-CaP, and in 70 mL for PEO to maintain the cell suspension to sample total surface area ratio as 4 mL cm−2. As a control, both uncoated and coated samples were sterilized in the same manner and immersed in the same amount of E-MEM + FBS without cells. The samples were placed in a CO2 incubator (37 °C, 5% CO2 in humidified air) for 1, 4 and 7 days without medium exchange. A 5.4 mL portion of the supernatant from each vessel was transferred to a new smaller vessel, and a 0.6 mL portion of the mixture of 1 mM WST-1 [2-(4-iodophenyl)-3-(4-nitrphenyl)-5-(2,4-disulfophenyl)-2H-tetrazolium, monosodium salt]39 and 0.2 mM 1-methoxy-5-methylphenazinium methylsulfate (1-methoxy PMS) in PBS(−) was added. The sample was aseptically transferred into a new vessel containing the supernatant and WST-1 reagents, and placed into a CO2 incubator for additional 4 h. After the additional incubation, the absorbance of the supernatant was measured at 450 nm by a microplate reader (Multiskan FC, Thermo Scientific, USA). The relative cell viability (RCV) on the sample was calculated by the following equation:| RCV = As/Ss − Ac/Sc | (1) |
| Components | Concentration (mg L−1) | Components | Concentration (mg L−1) |
|---|---|---|---|
| NaCl | 6800 | L-Phenylalanine | 32 |
| NaHCO3 | 2200 | L-Cystine·HCl·H2O | 31.4 |
| KCl | 400 | L-Methionine | 15 |
| CaCl2 | 200 | L-Tryptophan | 10 |
| NaH2PO4 | 115 | Sodium succinate·6H2O | 100 |
| MgSO4 | 93.5 | Succinic acid | 75 |
| D-Glucose | 1000 | i-Inositol | 2 |
| Phenol red | 6 | Choline bitartrate | 1.8 |
| L-Glutamine | 292 | D-Ca pantothenate | 1 |
| L-Arginine·HCl | 126 | Folic acid | 1 |
| L-Lysine·HCl | 73 | Pyriodoxal HCl | 1 |
| L-Leucine | 52 | Niacinamide | 1 |
| L-Isoleucine | 52 | Thiamine HCl | 1 |
| L-Threonine | 48 | Riboflavin | 0.1 |
| L-Valine | 46 | Biotin | 0.02 |
| L-Histidine·HCl·H2O | 42 | Kanamycin | 60 (titer) |
| L-Tyrosine | 36 |
2.3. In vitro degradation testing
The electrochemical in vitro degradation experiments were carried out in duplicate using a potentiostat (Model: ACM Gill AC) and a typical three-electrode system, as described earlier for the CaP coating. The electrolyte was simulated body fluid (SBF) maintained at 37 °C during the testing. The pH of the SBF was 7.40 and tris(hydroxymethyl)aminomethane (TRIS) buffer was added to the SBF to maintain the pH during the testing. The chemical composition of the SBF used in this study is shown in Table 3.41 The test samples were immersed in SBF for 2 h prior to the electrochemical experiments for establishing a relatively stable open circuit potential (OCP). Electrochemical impedance spectroscopy (EIS) was performed over the frequency range of 105 Hz to 10−2 Hz at 5 mV AC amplitude. Equivalent circuit modelling of the EIS results was done using ZSimpWin V. 3.21 software. Potentiodynamic polarisation experiments were carried out at a scan rate of 0.5 mV s−1. Post-degradation analysis was performed using FTIR, XRD and SEM.3. Results and discussion
3.1. Coating characterisation
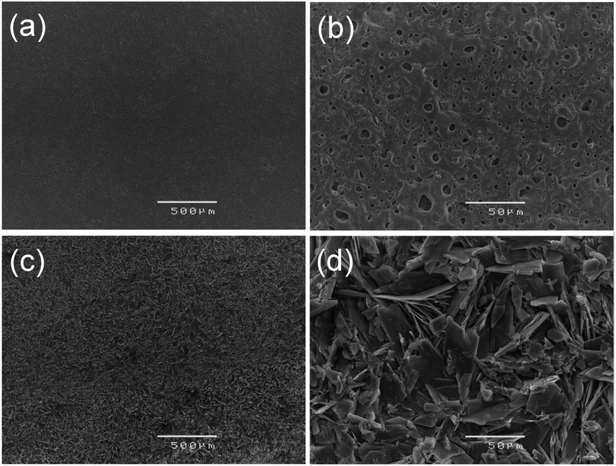
Fig. 1 (a–d) show the SEM micrographs of PEO and PEO-CaP coated magnesium samples. The PEO coating microstructure reveals a typical porous structure with different sizes of pores which are distributed evenly across the entire surface (Fig. 1a and b). The PEO coating thickness was measured to be ∼19 ± 3 μm. The electrochemical coating produced CaP particles of different shapes and sizes, but the coating completely covered the porous PEO layer. The total thickness of the PEO-CaP coating was 27 ± 5 μm. The FTIR spectra for the PEO and PEO-CaP coatings are shown in Fig. 2. The PEO coating exhibited only a single broad band at 995 cm−1 corresponding to phosphate, whereas PEO-CaP coating showed strong bands at 1130, 1056 and 984 cm−1 corresponding to phosphate, and bands at 1648 cm−1 and 873 cm−1 corresponding to hydroxide and carbonate groups, respectively.42,433.2. Cytocompatibility
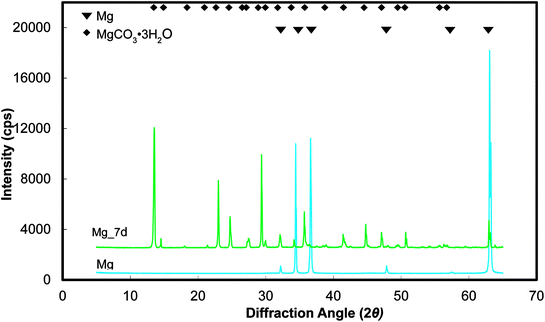
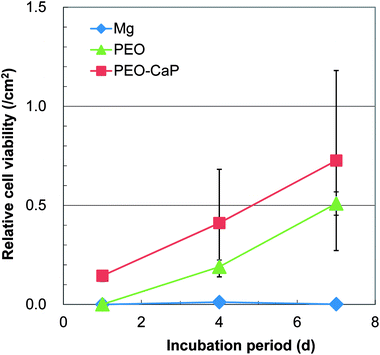
Representative optical micrographs of the bare magnesium and coated magnesium samples after 1, 4, 7 d of cell culture are shown in Fig. 3. Cell growth was observed on the PEO and PEO-CaP coatings, but almost no cells were observed on pure magnesium after 4 and 7 d of incubation. Interestingly, hexagonal column-shaped crystals were formed on the pure magnesium after 7 d of incubation. XRD analysis confirmed that the crystals are MgCO3·3H2O (Fig. 4). Both the PEO and PEO-CaP coatings supported cell growth, but interestingly the morphology of cells was different. Cells were well spread on the PEO coating, while they were spherical and dense on the PEO-CaP coating. The WST-1 assay results presented in Fig. 5 suggest that the relative cell viability on PEO and PEO-CaP coatings increased with increase in the incubation period, whereas pure magnesium did not show any increase in the cell viability throughout the incubation period. The PEO-CaP coating exhibited a higher relative cell viability than the PEO-only coating. It can be noted that the standard deviation in the data for PEO-CaP coating appears to be higher with the increase in the incubation period. This could be due to the difference in the packing of the CaP particles.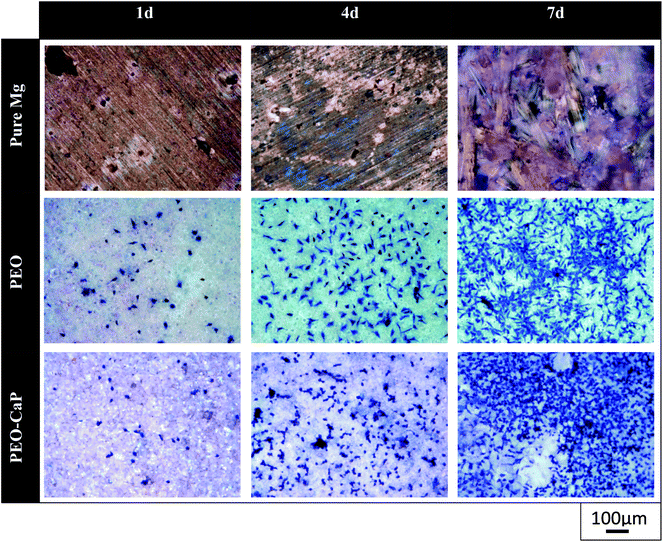 | ||
| Fig. 3 Optical images of L929 cells on pure magnesium, PEO and PEO-CaP coated magnesium samples (note: the cells were stained (blue) using Giemsa's staining solution). | ||
SEM micrographs of pure magnesium, PEO and PEO-CaP coated magnesium samples after 7 d of immersion in E-MEM + FBS are shown in Fig. 6. The hexagonal column-shaped crystals completely covered the surface of pure magnesium. The PEO coated samples exhibited porous structures, which appeared similar to the samples before immersion. However, the PEO-CaP coated magnesium samples exhibited a morphology that was different to the samples before immersion (see Fig. 1c and d). Further, a few small holes can be seen in Fig. 6d, which suggest that some CaP particles have detached/dissolved and thereby exposed the underneath PEO layer pores.
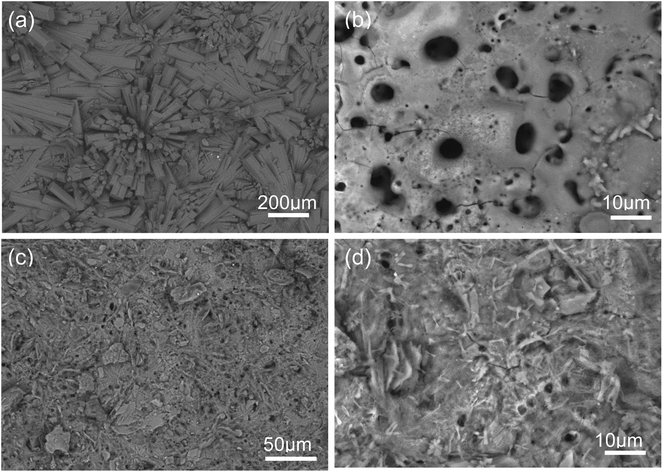 | ||
| Fig. 6 SEM micrographs of: (a) pure magnesium, (b) PEO coating, and (c and d) PEO-CaP coatings on magnesium samples, after 7 d immersion in EMEM + FBS. | ||
XRD spectra of the PEO and PEO-CaP coated magnesium samples before and after immersion in E-MEM + FBS are shown in Fig. 7(a and b). The PEO coated magnesium with the increase in the immersion period reveals decrease in the peaks corresponding to MgO (2θ = 43.0 and 62.5°). In the case of PEO-CaP coated magnesium, the peaks corresponding to CaHPO4·2H2O (2θ = 11.7, 21.0 and 29.4°) was clearly evident before sample immersion, but it faded with increase in the immersion periods. However, the MgO peaks were seen even after 7 d of immersion.
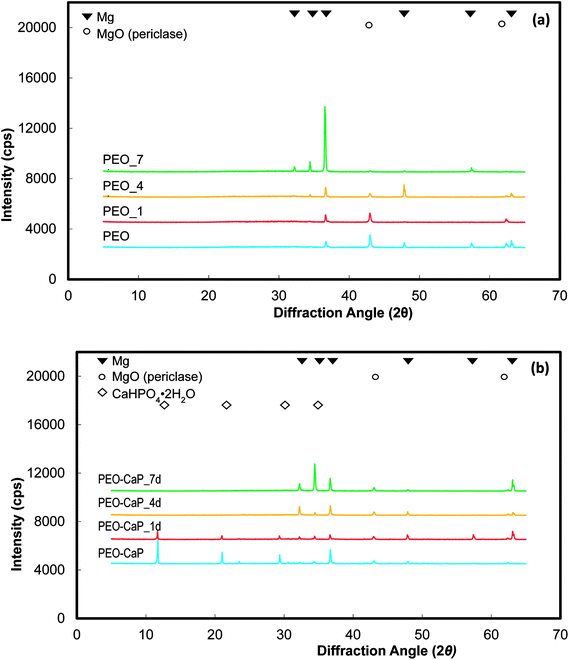 | ||
| Fig. 7 XRD spectra of: (a) PEO and (b) PEO-CaP coated magnesium samples, before and after immersion in E-MEM + FBS. | ||
The cytocompatibility results clearly suggest that the PEO-CaP coated magnesium has a better biocompatibility than pure magnesium. Continuous cell growth was observed through the 7 d of incubation period for both the PEO and PEO-CaP coated magnesium samples, whereas no evidence of cells was observed on pure magnesium after 7 d of incubation. However, it was interesting to note that the morphology of the cells were different between the PEO and PEO-CaP coated magnesium samples, i.e., the cells were relatively more spread on the PEO coated magnesium than on PEO-CaP coated Mg. Optical microscopic observation suggested that cells could not spread over the ridges created by the piles of platelet-like CaP. Surface topography in nano and micrometer scales has been reported to significantly influence cellular adhesion behaviour.44 Hence, further studies should be carried out to understand the effect of CaP particle morphology on cellular adhesion behaviour. Cell spreading is generally considered to be important for cell survival.45 However, in the present study, the cell growth on PEO-CaP coated magnesium was higher than in PEO-only coated magnesium. As can be seen in Fig. 6d, the CaP particles tend to detach/dissolve over the incubation period. This would increase the calcium and phosphate ion concentrations in the culture medium and thereby facilitate the growth and differentiation of certain types of cells (e.g. osteoblasts).46,47 These results suggest that CaP particle morphology and dissolution rate potentially control cellular behaviour and growth.
3.3. In vitro degradation
The potentiodynamic polarisation curves of pure magnesium, PEO and PEO-CaP coated magnesium samples are shown in Fig. 8, and the corresponding electrochemical parameters are shown in Table 4. The PEO coating did not show any significant difference in the corrosion potential (Ecorr) as compared to pure magnesium. However, a ∼61% reduction in the corrosion current (icorr) was observed for the PEO coating (11.34 μA cm−2) as compared to the bare metal (28.79 μA cm−2). In the case of PEO-CaP coating, the corrosion potential was shifted towards the noble direction, i.e., −1.5 VAgAg/Cl. The PEO-CaP coating reduced the icorr to 0.383 μA cm−2, a ∼97% reduction as compared to the PEO-only coated magnesium and a ∼99% reduction as compared to pure magnesium. It was noted that both pure magnesium and PEO-only coated magnesium samples exhibited breakdown potentials (Ebd) at ∼−1.45 V in their anodic polarisation curves. The breakdown potential at this potential range is generally attributed to the dissolution of magnesium hydroxide.48 However, the PEO-CaP coated magnesium samples did not show any distinct breakdown potential, which suggests that the penetration of chloride ions has been largely inhibited.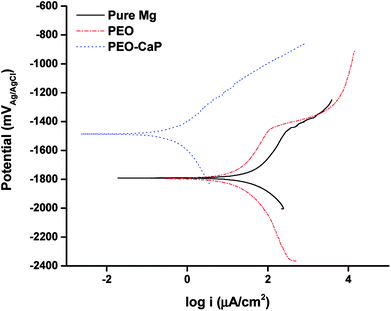 | ||
| Fig. 8 Potentiodynamic polarisation curves for pure magnesium, PEO and PEO-CaP coated magnesium samples in SBF. | ||
| Material | icorr (μA cm−2) | Ecorr (VAg/AgCl) | Ebd (VAg/AgCl) |
|---|---|---|---|
| Pure Mg | 28.79 ± 15.57 | −1.83 ± 0.05 | −1.45 |
| PEO | 11.34 ± 1.47 | −1.815 ± 0.021 | −1.45 |
| PEO-CaP | 0.383 ± 0.041 | −1.5 ± 0.014 | N/A |
Fig. 9 shows the Nyquist plots and the equivalent circuit model for pure magnesium, PEO and PEO-CaP coated magnesium samples immersion in SBF for over 2 to 72 h. The corresponding data of the modelling are presented in Table 5. For the pure magnesium, Rs is the solution resistance, Q1 represents double-layer capacitance, R1 represents charge transfer resistance, and R2 and Q2 represent film effects. For the PEO and PEO-CaP coated magnesium samples, Rs is the solution resistance, Q1 and R1 represent the porous outer layer, and R2 and Q2 represent the compact inner layer. The RP values obtained from these plots are shown with respect to time in Fig. 10. The PEO coated magnesium samples exhibited an initial RP of 3498 Ω cm2 and increased to 7107 Ω cm2 after 24 h. This could be due to a small growth of the compact inner layer or blocking of the pores in the layer by the degradation products of magnesium as a result of the SBF contact. However, the RP decreased to 5588 Ω cm2 after 72 h immersion, which can be attributed to permeation of chloride ions attacking the inner compact layer. From 2 h to 24 h immersion, the plots showed only a single layer capacitive loop. From 48 h onward, a second mid-frequency capacitive loop becomes visible, suggesting that the coating was only partially protective. The CaP coating on the PEO layer increased the RP by two-order of magnitude. The initial RP was measured to be ∼358 kΩ cm2, which slowly decreased to ∼45 kΩ cm2 after 72 h immersion. The PEO-CaP coated magnesium samples plots for all immersion period showed only a single capacitive loop, which implies that there was very little coating breakdown or penetration of the electrolyte when compared to the PEO-only coated magnesium.
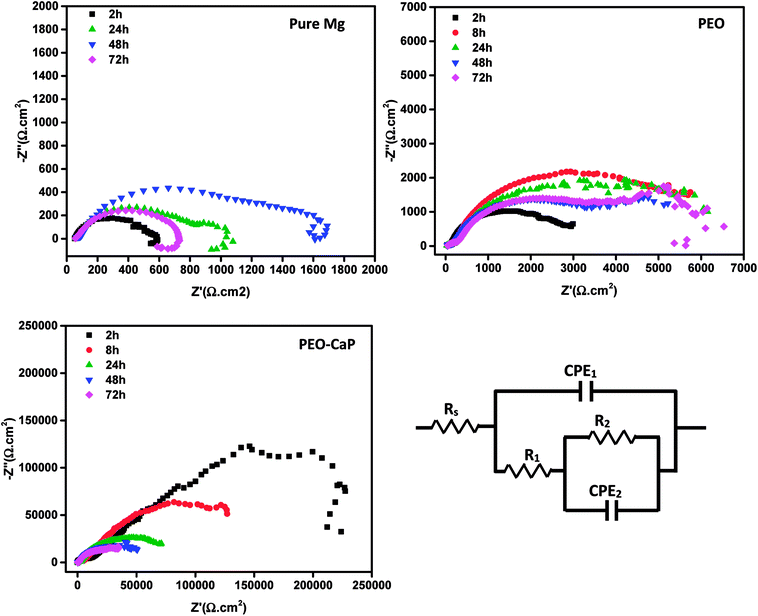 | ||
| Fig. 9 Nyquist plots for pure magnesium, PEO and PEO-CaP coated magnesium samples in SBF, and the equivalent circuit used for modelling the spectra. | ||
| Material | Time (h) | CPE1 (Ω−1 cm−2 s−n × 10−6) | n | R1 (Ω cm2) | CPE2 (Ω−1 cm−2 s−n × 10−6) | n | R2 (Ω cm2) |
|---|---|---|---|---|---|---|---|
| Pure Mg | 2 | 48.52 ± 3.65 | 0.8 | 411.2 ± 73.54 | 3430.5 ± 516.89 | 0.9 | 64.82 ± 61.76 |
| 24 | 63.27 ± 12.16 | 0.8 | 549.1 ± 355.53 | 4669 ± 2402.75 | 0.9 | 190 ± 7.21 | |
| 48 | 95.31 ± 35.33 | 0.6 | 383.57 ± 421.34 | 1375.48 ± 1925.47 | 0.9 | 912.5 ± 1071.27 | |
| 72 | 56.41 ± 4.69 | 0.8 | 243.47 ± 287.69 | 1407.95 ± 1914.91 | 0.9 | 398.55 ± 354.61 | |
| PEO | 2 | 20.1 ± 7.25 | 0.5 | 100.43 ± 17.1 | 34.1 ± 8.21 | 0.8 | 3397.33 ± 887.98 |
| 8 | 34.6 ± 15 | 0.5 | 221.97 ± 44.5 | 17.1 ± 7.47 | 0.8 | 6554.33 ± 1795.02 | |
| 24 | 31.5 ± 27.1 | 0.6 | 341.97 ± 151.75 | 14.3 ± 14.5 | 0.9 | 6764.67 ± 801.3 | |
| 48 | 54.5 ± 15.3 | 0.5 | 481.83 ± 124.4 | 4.06 ± 0.16 | 1 | 5267.67 ± 1504.78 | |
| 72 | 53.2 ± 20.5 | 0.5 | 631.23 ± 100.95 | 3.45 ± 0.69 | 1 | 4957.33 ± 1273.79 | |
| PEO-CaP | 2 | 1.25 ± 0.35 | 0.73 | 17![[thin space (1/6-em)]](https://www.rsc.org/images/entities/char_2009.gif) 290 ± 1655 290 ± 1655 |
4.45 ± 0.49 | 0.74 | 340![[thin space (1/6-em)]](https://www.rsc.org/images/entities/char_2009.gif) 850 ± 110 850 ± 110![[thin space (1/6-em)]](https://www.rsc.org/images/entities/char_2009.gif) 804 804 |
| 8 | 0.5 ± 0.5 | 0.71 | 4018 ± 2212 | 6.53 ± 0.45 | 0.64 | 198![[thin space (1/6-em)]](https://www.rsc.org/images/entities/char_2009.gif) 800 ± 34 800 ± 34![[thin space (1/6-em)]](https://www.rsc.org/images/entities/char_2009.gif) 648 648 |
|
| 24 | 0.71 ± 0.46 | 0.71 | 2293 ± 745 | 9.67 ± 1.48 | 0.71 | 87![[thin space (1/6-em)]](https://www.rsc.org/images/entities/char_2009.gif) 710 ± 7919 710 ± 7919 |
|
| 48 | 0.77 ± 0.32 | 0.72 | 1549 ± 242 | 13.51 ± 1.47 | 0.73 | 51![[thin space (1/6-em)]](https://www.rsc.org/images/entities/char_2009.gif) 450 ± 8598 450 ± 8598 |
|
| 72 | 1.52 ± 0.88 | 0.67 | 1278 ± 167 | 15.3 ± 2.01 | 0.74 | 44![[thin space (1/6-em)]](https://www.rsc.org/images/entities/char_2009.gif) 100 ± 1061 100 ± 1061 |
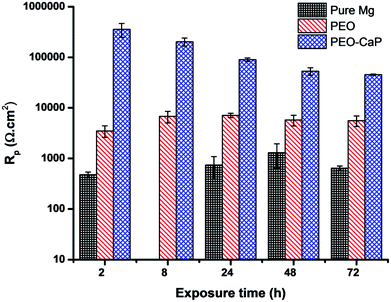 | ||
| Fig. 10 Polarisation resistance (RP) vs. time plots for pure magnesium, PEO and PEO-CaP coated magnesium samples in SBF (mean ± SD, n = 2). | ||
As listed in Table 6, the PEO-CaP coating produced in this study exhibited a relatively low corrosion current (0.383 μA cm−2), as well as a substantially high polarisation resistance (∼45 kΩ cm2 after 72 h immersion in SBF) as compared to the PEO-CaP coating reported in the literature.29,32,34,49–51 For example, Liu et al.29 reported an icorr of ∼3 μA cm−2, which is an order of magnitude higher than the current study. Similarly, Gao et al.34 reported only an RP value of ∼2800 Ω cm2 for PEO-CaP coating on magnesium after 1 h immersion in SBF, which even dropped to ∼1000 Ω cm2 after 4 h immersion. They used a relatively high temperature technique i.e., depositing the hydroxyapatite layer at 75 ± 3 °C. This was most likely done to emulate previous studies that were utilized on titanium substrate.15,52 However, magnesium dissolution at this temperature may have negatively influenced the coating process. A previous study53 by our research group showed that the substrate dissolution behavior is a critical factor in determining the packing of CaP particles on magnesium alloys. In another study, we reported32 an RP value of 10 kΩ cm2 (72 h, SBF) for PEO-CaP coated pure magnesium, where a conventional electrolyte was used for the CaP coating. A greater cathodic charge density during the CaP electrodeposition results in an increased volume of hydrogen evolution, which damages the coating as the H2 bubbles detach. In this study, the lower temperature coupled with the ethanol addition to the coating solution (which decreases the cathodic charge density) resulted in a better CaP packing and consequently exhibited a higher performance.
| Electrolyte | Uncoated | PEO-CaP coated | References | |||
|---|---|---|---|---|---|---|
| Metal | icorr (μA cm−2) | Rp (Ω cm2) | icorr (μA cm−2) | Rp (Ω cm2) | ||
| SBF | Pure Mg | 28.79 | 642.02 (72 h) | 0.383 | 45![[thin space (1/6-em)]](https://www.rsc.org/images/entities/char_2009.gif) 378 (72 h) 378 (72 h) |
Current work |
| SBF | Pure Mg | — | — | ∼3 | — | 29 |
| SBF | Pure Mg | 23.5 | 1180 (48 h) | 0.85 | 10![[thin space (1/6-em)]](https://www.rsc.org/images/entities/char_2009.gif) 000 (72 h) 000 (72 h) |
32 |
| SBF | Pure Mg | ∼700 | ∼140 (1 h) | ∼30 | ∼2800 (1 h), ∼1000 (4 h) | 34 |
| Hank's solution | AZ31 Mg alloy | 10.5 | 2238 | 0.452 | 29![[thin space (1/6-em)]](https://www.rsc.org/images/entities/char_2009.gif) 400 400 |
49 |
| SBF | AZ31B Mg alloy | 76 | 114 | 1.17 (pH: 5.6), 2.18 (pH: 9.4) | 46![[thin space (1/6-em)]](https://www.rsc.org/images/entities/char_2009.gif) 490 (pH: 5.6), 16 490 (pH: 5.6), 16![[thin space (1/6-em)]](https://www.rsc.org/images/entities/char_2009.gif) 389 (pH: 9.4) 389 (pH: 9.4) |
50 |
| SBF | AZ31 Mg alloy | 611.71 | 109.28 | 16.71 | 4309, ∼1700 (170 h) | 51 |
3.4. Post-degradation characterisation
Fig. 11 shows the SEM micrographs of PEO and PEO-CaP coated magnesium samples after in vitro degradation. The PEO layer shown in Fig. 11a and b seems relatively unattacked with only some areas of degradation products forming across some pores, which is consistent with this type of coatings.24 However, the porous outer layer allows permeation of the electrolyte while providing relatively little resistance to degradation, instead relying on the much thinner inner layer to protect the substrate. For the PEO-CaP coated magnesium samples, there are signs of attack across the entire surface exposing the floret-like regions (Fig. 11c and d). However, there are no areas of particularly heavy localised attack, suggesting that the CaP particles were closely packed.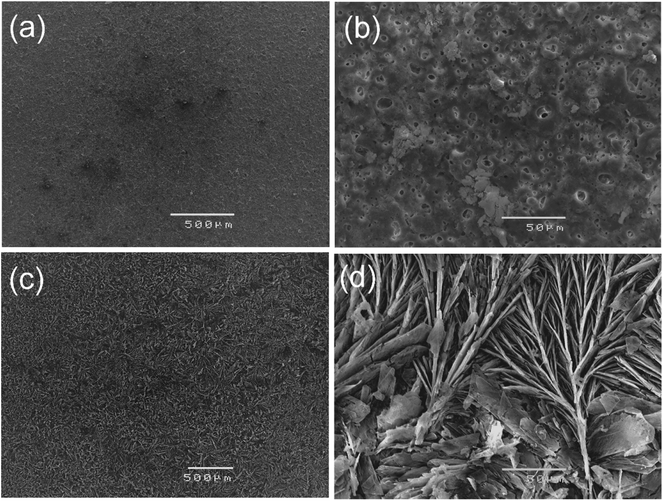 | ||
| Fig. 11 SEM micrographs of: (a and b) PEO and (c and d) PEO-CaP coated magnesium samples, following 72 h immersion in SBF. | ||
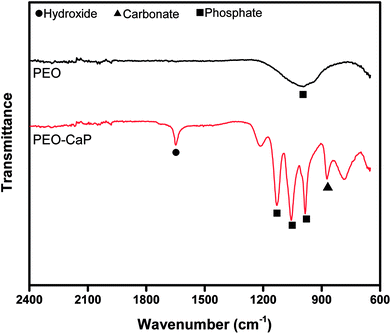
Fig. 12 shows the FTIR spectra of the PEO and PEO-CaP coatings following immersion in SBF. For the PEO coating, the most notable change was the appearance of a carbonate band at 1426 cm−1. Magnesium carbonate formation on magnesium-based materials in SBF has been reported earlier.54 For the PEO-CaP coating, the hydroxide and carbonate bands at 1649 cm−1 and 873 cm−1 were evident, respectively. Additional carbonate bands appeared at 1520 cm−1 and 1388 cm−1. The strong phosphate bands have merged, showing only a broad phosphate band at ∼1000 cm−1.
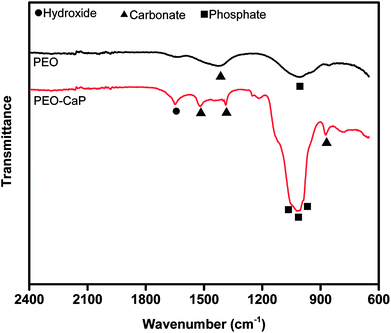 | ||
| Fig. 12 FTIR spectra of PEO and PEO-CaP coatings on pure magnesium, following 72 h immersion in SBF. | ||
Since the performance of these coatings is closely dependent on the through-going porosity, it is useful to quantify the amount of through-going porosity. The below equation was used to estimate the through-going porosity of the coating:55
 | (2) |
Another interesting point to be noted is that the performance of the PEO-CaP coating in E-MEM + FBS was slightly inferior to that in SBF. The detachment/dissolution of CaP particles were higher in E-MEM + FBS (Fig. 6) as compared to that in SBF (Fig. 11). However, in our recent work18 on CaP coated Mg–Ca alloy an opposite behaviour was observed. This suggests that the base material play an important role on the degradation performance of the coating. We recently reported that cathodic activity of magnesium-based materials affects the coating performance.53 The present study confirms that the aggressiveness of an electrolyte cannot be generalized, other factors such the base material (purity and alloying elements) and nature of the coating (type and morphology) also play a critical role in the degradation process.
4. Conclusions
The biocompatibility and degradation resistance of pure magnesium were enhanced by the combined PEO-CaP coating produced by electrochemical methods. The porous PEO coating on magnesium acted as a scaffold for CaP deposition. Cytocompatibility tests showed that PEO-CaP coating substantially improved the biocompatibility of magnesium. In vitro degradation experiments showed that the PEO-CaP coated magnesium exhibiting significantly higher degradation resistance than the pure magnesium and PEO-only coated magnesium. While the PEO-only layer improved the polarisation resistance of magnesium by an order of magnitude, the addition of CaP layer added another order of magnitude improvement. This enhanced degradation resistance to PEO-CaP coated magnesium can be attributed to the better packing of CaP particles which largely minimized the electrolyte permeation.Conflicts of interest
There are no conflicts to declare.Acknowledgements
The authors would like to thank the National Institute for Materials Science (NIMS) for the MANA-NIMS Fellowship (MBK) and JSPS KAKENHI (Grant number 26282151) for partial financial support.References
- M. B. Kannan, Surf. Coat. Technol., 2016, 301, 36–41 CrossRef.
- M. Kannan, Hydroxyapatite (HAp) for Biomedical Applications, 2015, p. 289 Search PubMed.
- H. Hornberger, S. Virtanen and A. Boccaccini, Acta Biomater., 2012, 8, 2442–2455 CrossRef PubMed.
- M. A. Surmeneva, T. M. Mukhametkaliyev, H. Khakbaz, R. A. Surmenev and M. B. Kannan, Mater. Lett., 2015, 152, 280–282 CrossRef.
- Y. Gu, S. Bandopadhyay, C.-f. Chen, Y. Guo and C. Ning, J. Alloys Compd., 2012, 543, 109–117 CrossRef.
- A. Alabbasi, M. Bobby Kannan, R. Walter, M. Störmer and C. Blawert, Mater. Lett., 2013, 106, 18–21 CrossRef.
- C. Blawert, S. P. Sah, N. Scharnagl and M. B. Kannan, in Surface Modification of Magnesium and its Alloys for Biomedical Applications, Woodhead Publishing, 2015, pp. 193–234, DOI:10.1016/B978-1-78242-078-1.00008-6.
- Y. Chen, Y. Song, S. Zhang, J. Li, C. Zhao and X. Zhang, Biomed. Mater., 2011, 6, 025005 CrossRef PubMed.
- A. Alabbasi, S. Liyanaarachchi and M. B. Kannan, Thin Solid Films, 2012, 520, 6841–6844 CrossRef.
- M. B. Kannan, in Surface Modification of Magnesium and its Alloys for Biomedical Applications, Woodhead Publishing, 2015, pp. 355–376, DOI:10.1016/B978-1-78242-078-1.00013-X.
- M. B. Kannan and L. Orr, Biomed. Mater., 2011, 6, 045003 CrossRef PubMed.
- M. B. Kannan and R. S. Raman, Biomaterials, 2008, 29, 2306–2314 CrossRef PubMed.
- M. B. Kannan and R. S. Raman, Scr. Mater., 2008, 59, 175–178 CrossRef.
- M. Bobby Kannan, R. Singh Raman, F. Witte, C. Blawert and W. Dietzel, J. Biomed. Mater. Res., Part B, 2011, 96, 303–309 CrossRef PubMed.
- M. Manso, C. Jimenez, C. Morant, P. Herrero and J. Martınez-Duart, Biomaterials, 2000, 21, 1755–1761 CrossRef PubMed.
- Q. Liu, J. Ding, F. K. Mante, S. L. Wunder and G. R. Baran, Biomaterials, 2002, 23, 3103–3111 CrossRef PubMed.
- T. M. Sridhar, U. Kamachi Mudali and M. Subbaiyan, Corros. Sci., 2003, 45, 2337–2359 CrossRef.
- M. B. Kannan, R. Walter and A. Yamamoto, ACS Biomater. Sci. Eng., 2015, 2, 56–64 CrossRef.
- S. Shadanbaz and G. J. Dias, Acta Biomater., 2012, 8, 20–30 CrossRef PubMed.
- A. Yerokhin, X. Nie, A. Leyland, A. Matthews and S. Dowey, Surf. Coat. Technol., 1999, 122, 73–93 CrossRef.
- F. Walsh, C. Low, R. Wood, K. Stevens, J. Archer, A. Poeton and A. Ryder, Trans. IMF, 2009, 87, 122–135 CrossRef.
- M. Shokouhfar, C. Dehghanian, M. Montazeri and A. Baradaran, Appl. Surf. Sci., 2012, 258, 2416–2423 CrossRef.
- H. F. Guo, M. Z. An, H. B. Huo, S. Xu and L. J. Wu, Appl. Surf. Sci., 2006, 252, 7911–7916 CrossRef.
- J. Liang, P. B. Srinivasan, C. Blawert, M. Störmer and W. Dietzel, Electrochim. Acta, 2009, 54, 3842–3850 CrossRef.
- A. Ghasemi, V. Raja, C. Blawert, W. Dietzel and K. Kainer, Surf. Coat. Technol., 2008, 202, 3513–3518 CrossRef.
- L. R. Krishna and G. Sundararajan, J. Met., 2014, 66, 1045–1060 Search PubMed.
- J. Liang, P. B. Srinivasan, C. Blawert and W. Dietzel, Electrochim. Acta, 2010, 55, 6802–6811 CrossRef.
- C. Blawert, S. P. Sah, J. Liang, Y. Huang and D. Höche, Surf. Coat. Technol., 2012, 213, 48–58 CrossRef.
- G. Y. Liu, J. Hu, Z. K. Ding and C. Wang, Appl. Surf. Sci., 2011, 257, 2051–2057 CrossRef.
- Y. Shi, M. Qi, Y. Chen and P. Shi, Mater. Lett., 2011, 65, 2201–2204 CrossRef.
- D. Sreekanth and N. Rameshbabu, Mater. Lett., 2012, 68, 439–442 CrossRef.
- A. Alabbasi, M. Bobby Kannan and C. Blawert, Mater. Lett., 2014, 124, 188–191 CrossRef.
- Y. Xiong, C. Lu, C. Wang and R. Song, Appl. Surf. Sci., 2014, 322, 230–235 CrossRef.
- Y. Gao, A. Yerokhin and A. Matthews, Surf. Coat. Technol., 2015, 269, 170–182 CrossRef.
- M. B. Kannan, J. Biomed. Mater. Res., Part A, 2013, 101A, 1248–1254 CrossRef PubMed.
- M. B. Kannan, Mater. Lett., 2012, 76, 109–112 CrossRef.
- P. B. Srinivasan, J. Liang, C. Blawert, M. Störmer and W. Dietzel, Appl. Surf. Sci., 2010, 256, 4017–4022 CrossRef.
- M. B. Kannan, Y. H. He and A. Sandham, Mater. Sci. Forum, 2010, 654–656, 2196–2199 Search PubMed.
- M. Ishiyama, M. Shiga, K. Sasamoto, M. Mizoguchi and P.-g. He, Chem. Pharm. Bull., 1993, 41, 1118–1122 CrossRef.
- K. Sasaki, N. Tanaka, M. Watanabe and M. Yamada, Toxicol. In Vitro, 1991, 5, 403–406 CrossRef PubMed.
- A. Oyane, H. M. Kim, T. Furuya, T. Kokubo, T. Miyazaki and T. Nakamura, J. Biomed. Mater. Res., Part A, 2003, 65, 188–195 CrossRef PubMed.
- E. V. Pecheva, L. D. Pramatarova, M. F. Maitz, M. T. Pham and A. V. Kondyuirin, Appl. Surf. Sci., 2004, 235, 176–181 CrossRef.
- L. Pramatarova, E. Pecheva, R. Presker, M. Pham, M. Maitz and M. Stutzmann, Eur. Cells Mater., 2005, 9, 9–12 CrossRef PubMed.
- A. Curtis and C. Wilkinson, Biomaterials, 1997, 18, 1573–1583 CrossRef PubMed.
- C. S. Chen, M. Mrksich, S. Huang, G. M. Whitesides and D. E. Ingber, Science, 1997, 276, 1425–1428 CrossRef PubMed.
- M. M. Dvorak, A. Siddiqua, D. T. Ward, D. H. Carter, S. L. Dallas, E. F. Nemeth and D. Riccardi, Proc. Natl. Acad. Sci. U. S. A., 2004, 101, 5140–5145 CrossRef PubMed.
- Y. C. Chai, S. J. Roberts, J. Schrooten and F. P. Luyten, Tissue Eng., Part A, 2010, 17, 1083–1097 CrossRef PubMed.
- M. Bobby Kannan and R. Singh, J. Biomed. Mater. Res., Part A, 2010, 93, 1050–1055 Search PubMed.
- H. Tang, W. Tao, C. Wang and H. Yu, RSC Adv., 2018, 8, 12368–12375 RSC.
- Z. Yao, Q. Xia, L. Chang, C. Li and Z. Jiang, J. Alloys Compd., 2015, 633, 435–442 CrossRef.
- B. Niu, P. Shi, E. Shanshan, D. Wei, Q. Li and Y. Chen, Surf. Coat. Technol., 2016, 286, 42–48 CrossRef.
- M. Yousefpour, A. Afshar, X. Yang, X. Li, B. Yang, Y. Wu, J. Chen and X. Zhang, J. Electroanal. Chem., 2006, 589, 96–105 CrossRef.
- R. Walter, M. Bobby Kannan, Y. He and A. Sandham, Mater. Lett., 2014, 130, 184–187 CrossRef.
- Y. Xin, K. Huo, H. Tao, G. Tang and P. K. Chu, Acta Biomater., 2008, 4, 2008–2015 CrossRef PubMed.
- C. Liu, Q. Bi, A. Leyland and A. Matthews, Corros. Sci., 2003, 45, 1257–1273 CrossRef.
| This journal is © The Royal Society of Chemistry 2018 |

