 Open Access Article
Corrosion and hydrogen evolution rate control for X-65 carbon steel based on chitosan polymeric ionic liquids: experimental and quantum chemical studies†
S. M. Elsaeed *a,
El Sayed H. El Tamanyb,
H. Ashourb,
E. G. Zakia,
E. A. Khamisa and
H. A. El Nagyb
aEgyptian Petroleum Research Institute (EPRI), Nasr City, Cairo, Egypt. E-mail: shy_saeed@yahoo.com; Tel: +201005097684
bChemistry Department, Faculty of Science, Suez Canal University, Ismailia, Egypt
First published on 12th November 2018
Abstract
The corrosion performance of carbon steel was tested in four polymeric ionic liquids (PILs) that differed only in the fatty acid linked to the chitosan (CS) amine group. The measurements were implemented involved the hydrogen evolution rate (HER), gravimetric measurements, potentiodynamic polarization (PDP), electrochemical impedance spectroscopy (EIS), and quantum chemical estimations. The morphology and the elements arranged on the metal were considered by a scanning electron microscopy (SEM) system attached to an energy dispersive X-ray (EDX) system. The addition of polymeric ionic liquids hindered the rate of hydrogen generation. The order of the inhibitors efficiency was CSPTA-lauric > CSPTA-myristic > CSPTA-palmitic > CSPTA-stearic. The polarization method proved that the percentage inhibition efficiency increases with increasing the inhibitors concentration in 1 M HCl, representing a drop in the corrosion rate of carbon steel. On the other hand, the percentage inhibition decreased with the increase in temperature. Quantum chemical calculations revealed that the tested ionic liquids could react with the iron surface via electron transfer from the metal atom to ionic liquid molecule.
1. Introduction
Developing environmentally friendly polymeric ionic liquids (PILs) has attracted great interest due to their unique chemical and physical properties. These properties are the key factors for considering PILs for green innovative applications because ILs can meet green environmental requirements, such as related to their purity, non-toxicity, and commercial accessibility. In addition, they have the ability to inhibit the corrosion of materials used for pipelines, tanks, and technical equipment.1,2Ionic liquids (ILs) are salts that are organic liquids composed of unpacked well ions, permitting free movement, and consequently have flow properties.3,4 Moreover, there is a great interest in ILs as green corrosion inhibitors because of their large number of advantages, such as low toxicity, high thermal steadiness, low volatility, elevated ionic conductivity, and great action as corrosion inhibitors.5–8 Among these features of ILs, their very small vapor pressure (will not vaporize), non-polluted environmentally friendly nature are attractive and make them less harmful as metal corrosion inhibitors. The metal corrosion inhibited by PILs is because of their adsorption on the iron surface.9–11
Imidazolium ILs and their derivatives are one of the most effective and the most commonly used ILs as corrosion inhibitors in different corrosive media for carbon steel.12–17 In addition, it was reported that quaternary ammonium,18,19 phosphonium,20 and pyridinium salts ILs21,22 could be used for the protection of steel. Taghavikish et al.23 reported the improved anticorrosion ability for PILs based on thiol-ene derivatives. In addition, Atta et al.24 investigated the enhanced anticorrosion ability of hyperbranched PILs. The results from the present work are in good agreement with our previous work25 in which PILs were prepared based on acrylamides followed by quaternization with different aliphatic tertiary amines.
Chitosan (CS) ionic liquid polymers are attractive materials to apply as green corrosion inhibitors.26–28 CS is a harmless, ecofriendly decomposable, and β-D-glucose(1,4)amine polysaccharide linked with N-acetyl glucosamine.29,30 It is produced from the deacetylation of chitin,31–33 the most widespread polysaccharide in the environment after cellulose.34 It is found in shrimp and crab and insects cuticles.35 CS and its products have widespread potential in the field of medicine, paper, textile, food, cosmetics, and several other industries.36–38
Several new materials can be produced from CS because of its high capability of being functionalized. Modifications of CS functional groups (e.g., NH2 or OH groups) allow it to be applied in several manufacturing processes, owing to its improved water solubility over CS itself.39–42
The aim of this research was to prepare PILs from chitosan by means of interacting with p-toluene sulfonic acid. Then, amidation with some fatty acids, for example, stearic (C18), palmitic (C16), myristic (C14), and lauric (C12) acids. Moreover, we aimed to study the control of hydrogen generation by PILs derivatives. In addition, the electrochemical steel anticorrosion behavior in 1 M solution of HCl was inspected by way of different techniques using potentiodynamic polarization and impedance spectroscopy (EIS) (Nyquist and Bode plots). Chemical quantum estimations were approved to elucidate the inhibition process by the prepared PILs at a molecular level. Furthermore, the surface morphology was examined through scanning electron microscopy (SEM) to detect the effect of the adsorbing films.
2. Experimental
2.1. Preparation of PILs inhibitors
Carbon steel (X-65 type) was the working electrode used with a composition: C 0.10, Si 0.21, Mn 1.53, P 0.02, S 0.06, Ni 0.03, Cr 0.05, Mo 0.003, V 0.004, Cu 0.05, Al 0.01, and the rest was Fe. These samples were obtained from an unused petroleum pipeline.
(a) Preparation of chitosan-p-toluene sulfonate salt (CSPTA). First, 4.8 g of PTSA was solubilized in 80 ml distilled water and then mixed with CS (3.8 g) in a flask connected to a reflux condenser with stirring under an inert atmosphere. Then, the temperature was raised to 70 °C and sustained for 24 h. Last, acetone was added to the reacted mixture, which was washed with ether and dried in a vacuum oven at 40 °C.
(b) CSPTA amidation reaction with fatty acids. First, 2 g of CSPTA was stirred with 100 ml of water until dissolved and 1.3 g of fatty acid was mixed with 80 ml methanol then added with stirring well. The fatty acid/CSPTA solution molar ratio was 0.34
![[thin space (1/6-em)]](https://www.rsc.org/images/entities/char_2009.gif) :
:![[thin space (1/6-em)]](https://www.rsc.org/images/entities/char_2009.gif) 1. DCC (15 ml) dissolved in methanol (0.08 g l−1) was further added at room temperature. The reaction was finished under shaking in a nitrogen atmosphere for 20 h. Finally, precipitation was performed using 250 ml acetone, followed by filtration, washing with diethyl ether, absolute methanol, and finally vacuum drying at 20 °C.
1. DCC (15 ml) dissolved in methanol (0.08 g l−1) was further added at room temperature. The reaction was finished under shaking in a nitrogen atmosphere for 20 h. Finally, precipitation was performed using 250 ml acetone, followed by filtration, washing with diethyl ether, absolute methanol, and finally vacuum drying at 20 °C.
2.2. Hydrogen evolution measurements
A water replacement method was conducted to evaluate the hydrogen evolution rate similar to that formerly described.43,44 Initially, 100 ml of 1 M HCl (the corrosive medium) was placed into a container and a carbon steel coupon with dimensions of 3.5 cm × 2.5 cm was dipped in to the test solution. Then, the container was quickly closed to stop any loss of hydrogen gas. Finally, at fixed time periods, the hydrogen gas volume generated throughout the corrosion reaction was practically recorded from the volume of gas replacing the water level in the burette (in cm3).2.3. Electrochemical measurements
A Voltalab 80 Potentiostat PGZ 402 Tacussel Radiometer was used to quantify the electrochemical experiments. The technique was controlled by Voltamaster-4 software. Tests were performed via an electrochemical cell of 100 ml glass with spaces for 3 electrodes filled with 100 ml of corrosive medium (1 M HCl). The three electrodes comprised a saturated calomel electrode (SCE) as the reference electrode, a platinum electrode as an auxiliary electrode, and carbon steel working electrode (WE).Before all the experiments, the steel electrode surface was polished manually with different emery papers below 2500 grade. In order to gain the open-circuit potential, the electrode potential was steadied for 1 h in test solution previously to initiate the measurements. The electrode zone subjected to the destructive acidic media was 1 cm2 and the total measurements were employed at room temperature. Besides, the potential was altered from −900 to −300 mV vs. SCE, with a scan rate of 2 mV s−1 to acquire the potentiodynamic curves.
Nyquist and Bode plots were utilized assumed to define the EIS with a frequency range between 100 kHz and 50 mHz with an amplitude of 10 mV.
2.4. Gravimetric experiments
The effect of various temperatures on the corrosion rate (mg cm−2 h−1) of the carbon steel was attained by performing the weight loss test for the carbon steel samples in 1 M HCl solution with and without inhibitors (250 ppm). The carbon steel sheets with the dimension of 2 cm × 2.5 cm × 0.3 cm were immersed in test solution for 8 h. After that, the carbon steel samples were washed by distilled water and ethanol, dried in cold air, and then weighed using an analytical balance.2.5. Surface morphology studies
A scanning electron microscopy (SEM) instrument Quanta Model 250 FEG joined with EDX Part (energy dispersive X-ray) analyses was utilized for this examination with an accelerating voltage of 30 kV and a magnification force of X = 2000. Surface morphology was tested after dipping in the uninhibited solution (blank) and in an inhibited solution of 100 ppm of the CSPTA-lauric acid inhibitor.2.6. Chemical quantum calculations
PILs molecular structures were geometrically modernized by density functional theory (DFT) method by means of the 3-21 G** premise set with Hyperchem 7.5. Chemical quantum calculation parameters (e.g., EHOMO (the highest occupied molecular orbital energy), ELUMO (the lowest unoccupied molecular orbital energy), energy gap (energy difference between the LUMO and HOMO energy levels), X (electronegativity), η (hardness), softness (σ = 1/η), chemical potential (π = −X), and number of electron transferred (ΔN)) were assessed for the prepared PILs molecules.3. Results and discussion
Chitosan is sparingly soluble in water but its solubility can occur in basic aqueous solution through deprotonation of the CS amino group or it is soluble in slightly acidic medium.45,46 The present work aimed to make CS soluble in water by reacting the amine group with PTSA. Then, the ionic liquid product was amidated through stearic, palmitic, myristic, and lauric acid with the addition of DCC as a catalyst to yield the CS polymeric ionic liquid, as represented in Scheme 1.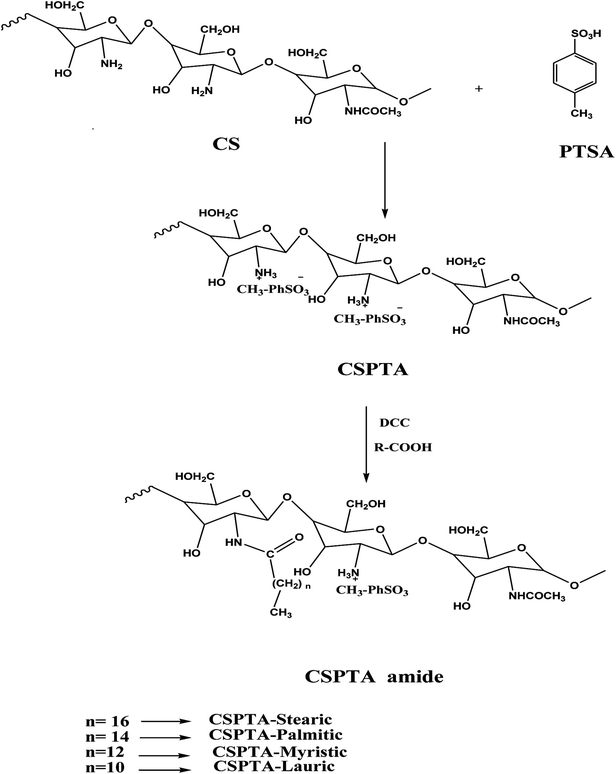 | ||
| Scheme 1 Quaternization of CS amine group by PTSA, followed by amidation with different saturated fatty acids. | ||
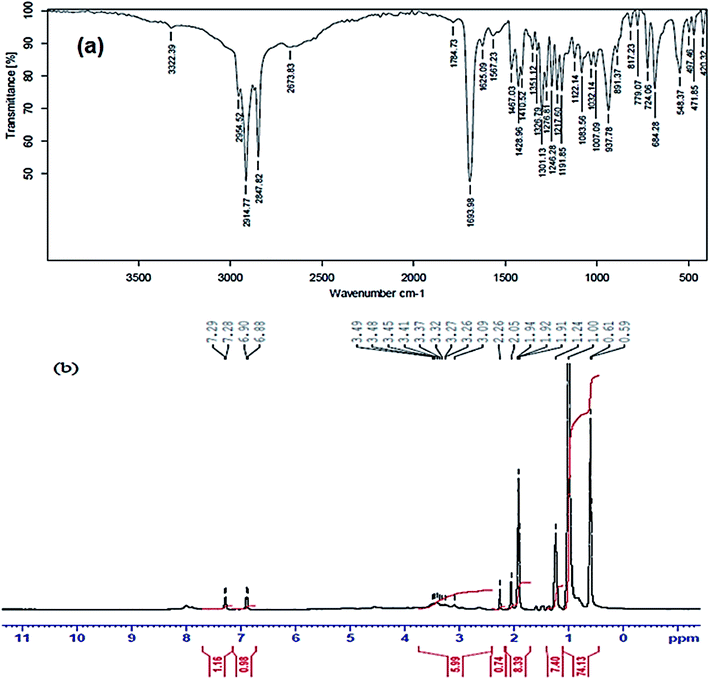
FTIR and 1H-NMR analyses were used to elucidate the chemical structures of the formed CSPTA and CSPTA-lauric. The synthesis of CSPTA was elucidated by FTIR spectroscopy (S1a†), which displayed the distinguish broad –OH band at 3444 cm−1, bands at 3100, 1637, and 1010 cm−1 for C–H stretching, C![[double bond, length as m-dash]](https://www.rsc.org/images/entities/char_e001.gif) C bonds, and bending of phenyl group of PTSA, respectively. Also, it showed a band at 2923 cm−1 assigned to the CH aliphatic of CS and a band at 1210 cm−1 for stretching C–N. The appearance of a band at 1070 and 1345 cm−1 could be recognized as due to S
C bonds, and bending of phenyl group of PTSA, respectively. Also, it showed a band at 2923 cm−1 assigned to the CH aliphatic of CS and a band at 1210 cm−1 for stretching C–N. The appearance of a band at 1070 and 1345 cm−1 could be recognized as due to S![[double bond, length as m-dash]](https://www.rsc.org/images/entities/char_e001.gif) O bond in PTSA, which points to CSPTA formation.
O bond in PTSA, which points to CSPTA formation.
Fig. 1(a) shows the FTIR spectrum of CSPTA-lauric, which displays a strong absorption band at 1693 cm−1, indicating C![[double bond, length as m-dash]](https://www.rsc.org/images/entities/char_e001.gif) O amides. The strong band at 1693 cm−1 proves the amide linkage formation between the CS amino group and lauric acid carboxyl group. A band appearing at 3322 cm−1 was assigned to stretching N–H. Peaks at 1625 and 937 cm−1 were recognized due to C
O amides. The strong band at 1693 cm−1 proves the amide linkage formation between the CS amino group and lauric acid carboxyl group. A band appearing at 3322 cm−1 was assigned to stretching N–H. Peaks at 1625 and 937 cm−1 were recognized due to C![[double bond, length as m-dash]](https://www.rsc.org/images/entities/char_e001.gif) C bonds and bending of CH for the aromatic ring in PTSA. Also, peaks appearing at 1217 and 1301 cm−1 are for C–N and S
C bonds and bending of CH for the aromatic ring in PTSA. Also, peaks appearing at 1217 and 1301 cm−1 are for C–N and S![[double bond, length as m-dash]](https://www.rsc.org/images/entities/char_e001.gif) O stretching, respectively.
O stretching, respectively.
In addition, the 1H-NMR spectra for CSPTA and CSPTA-lauric are given in S1b† and Fig. 1(b), respectively. These display signals at shifts of 7.1 ppm (dd, 2H, J = 6.03 Hz), and 7.5 ppm (dd, 2H, J = 6.25 Hz) and peaks at 8.2 ppm signifying +NH3– and proving the reaction of amino groups of CS with PSTA in S1b.† This peak at 8.2 ppm was slight in Fig. 1(b), indicating that the amidation occurs but not with all –NH2 groups. In Fig. 1(b), the appearance of new peaks at 1.9 (t, 3H, C![[H with combining low line]](https://www.rsc.org/images/entities/char_0048_0332.gif) 3–(CH2)10) and 3.3 (m, CH3–(C
3–(CH2)10) and 3.3 (m, CH3–(C![[H with combining low line]](https://www.rsc.org/images/entities/char_0048_0332.gif) 2)10) confirmed the amidation. The disappearance of the signal at 2.8 ppm (s, 2H, C–N
2)10) confirmed the amidation. The disappearance of the signal at 2.8 ppm (s, 2H, C–N![[H with combining low line]](https://www.rsc.org/images/entities/char_0048_0332.gif) 2) pointed to that there were no available amine groups after reacting the CS with PTSA and lauric acid. In S1b,† the signals at δ 3.5–3.9 ppm confirmed the methylene groups of CS, with a peak at 1.84 ppm (s,3H, –NHCO–C
2) pointed to that there were no available amine groups after reacting the CS with PTSA and lauric acid. In S1b,† the signals at δ 3.5–3.9 ppm confirmed the methylene groups of CS, with a peak at 1.84 ppm (s,3H, –NHCO–C![[H with combining low line]](https://www.rsc.org/images/entities/char_0048_0332.gif) 3) in CSPTA and signal at 2.5 ppm (s, 3H, C
3) in CSPTA and signal at 2.5 ppm (s, 3H, C![[H with combining low line]](https://www.rsc.org/images/entities/char_0048_0332.gif) 3-Ph) in PTSA, while the signals at 2.8 and 4.7 ppm could be attributed to –NH and –OH, respectively.
3-Ph) in PTSA, while the signals at 2.8 and 4.7 ppm could be attributed to –NH and –OH, respectively.
3.1. Hydrogen evolution measurements
Fig. 2 and S2† show the volume of hydrogen progressed from carbon steel corrosion in solution of 1 M HCl with time in the absence and presence of inhibitors. There was a clear and remarkable increase for hydrogen production with the increasing steel immersion time. From the volume produced, the hydrogen generation rate (Hr) was evaluated via the next expression:47| Hr = (V2 − V1)/(t2 − t1) | (1) |
| IH% = [1 − (Hr/Hro)] × 100 | (2) |
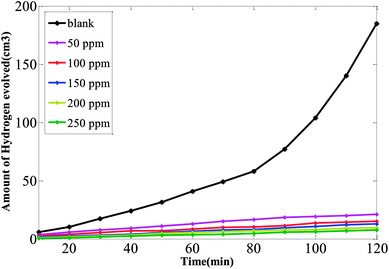 | ||
| Fig. 2 Volume of hydrogen evolved with time for carbon steel in 1 M HCl at various concentrations of CSPTA-lauric. | ||
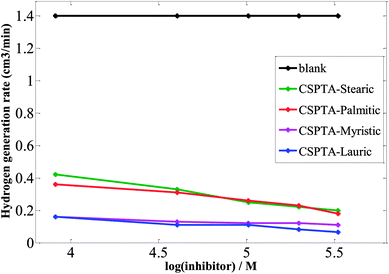 | ||
| Fig. 3 Relation between hydrogen generation rates vs. logarithmic inhibitor concentrations for carbon steel in 1 M HCl. | ||
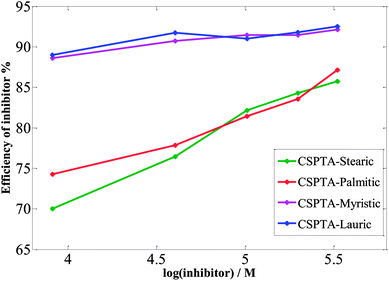 | ||
| Fig. 4 Variation of the efficiency of inhibitors with logarithmic inhibitors concentrations in 1 M HCl. | ||
These inhibitors inhibit the dissociation of carbon steel in HCl and accordingly, hinder the cathodic hydrogen evolving reaction via adsorption at the metal/acid solution interface.53,54 The ability of these PILs inhibitors as hydrogen evolving inhibitors is influenced by their structures. Inhibitors are able to arrange a thin film on the metal surface. Additionally, the chemisorption on the surface was increased by the PILs' chemical structures owing to coordination bonds among the metal surface and the electron pairs on N, O, and S atoms in the PILs' structures, the CO group p-electron, and as protonated moieties.55
Values of the mean and standard deviation (SD) for the amount of hydrogen evolved at different concentrations of PILs inhibitors in 1 M HCl solution are recorded in Table 1. In addition, values of the mean and standard deviation (SD) for the hydrogen evolution rate for the carbon steel electrode in 1 M HCl solution are recorded in Table 2.
| Inhibitor | Concentration (ppm) | Mean value | SD value |
|---|---|---|---|
| Blank | 000 | 61.95 | ±55.64 |
| CSPTA-stearic | 50 | 27.57 | ±15.03 |
| 100 | 21.23 | ±12.08 | |
| 150 | 16.69 | ±8.864 | |
| 200 | 15.79 | ±8.12 | |
| 250 | 12.63 | ±7.35 | |
| CSPTA-palmitic | 50 | 22.45 | ±13.01 |
| 100 | 19.87 | ±11.24 | |
| 150 | 16.15 | ±9.284 | |
| 200 | 13.48 | ±8.327 | |
| 250 | 10.25 | ±6.4 | |
| CSPTA-myristic | 50 | 11.28 | ±5.598 |
| 100 | 8.642 | ±4.408 | |
| 150 | 8.442 | ±4.539 | |
| 200 | 7.825 | ±4.236 | |
| 250 | 7.283 | ±3.932 | |
| CSPTA-lauric | 50 | 13.29 | ±5.94 |
| 100 | 9.067 | ±4.126 | |
| 150 | 7 | ±3.85 | |
| 200 | 5.5 | ±2.922 | |
| 250 | 3.917 | ±2.318 |
| Inhibitor | Mean value | SD value |
|---|---|---|
| Blank | 1.4 | 0 |
| CSPTA-stearic | 0.284 | ±0.09072 |
| CSPTA-palmitic | 0.268 | ±0.06979 |
| CSPTA-myristic | 0.128 | ±0.01924 |
| CSPTA-lauric | 0.105 | ±0.03651 |
3.2. Measurements of potentiodynamic polarization (PDP)
The curves of steel electrochemical polarization in 1 M HCl solution in the presence and absence of the produced PILs with the varied inhibitor concentrations are revealed in Fig. 5 and S3.† A drop in anodic and cathodic currents was presented in the presence of the inhibitor. The decrease was more obvious at higher inhibitor concentrations. This may be recognized as due to a defensive film protecting the steel surface from the corrosive medium. Adsorpting of the inhibitor on the steel surface reduces the hydrogen evolution (cathodic reaction) and reduces the iron metal dissolution (anodic reaction).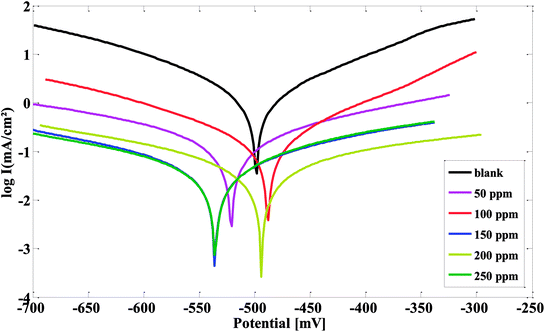 | ||
| Fig. 5 Polarization plots of steel electrode obtained in 1 M HCl solution and containing various concentrations of CSPTA-lauric. | ||
The polarization parameters, i.e., corrosion potential (Ecorr), current density of corrosion (Icorr), slopes of cathodic Tafel (βc) slopes of anodic Tafel (βa), were obtained from the polarization curves and are recorded in Table 3. The surface coverage degree (θ) and the inhibition efficiency (IE %) were considered from the Icorr values via the next relation:56,57
| θ = [1 − (Icorr(2)/Icorr(1))] | (3) |
| IE % = [1 − (Icorr(2)/Icorr(1))] × 100 | (4) |
| Inhibitor | Concentration (ppm) | βa (mV) | βc (mV) | Ecorr (mV) | Icorr (mA cm−2) | θ | IE% |
|---|---|---|---|---|---|---|---|
| Blank | 000 | 162.1 | −188.5 | −493 | 3.47 | — | — |
| CSPTA-Stearic | 50 | 94.5 | −162.6 | −536 | 0.9 | 0.7406 | 74 |
| 100 | 173.8 | −155.4 | −628 | 0.8 | 0.7694 | 76.9 | |
| 150 | 193.2 | −143.3 | −550 | 0.7 | 0.7982 | 79.8 | |
| 200 | 196.3 | −148.5 | −551 | 0.6 | 0.8270 | 82.7 | |
| 250 | 149.9 | −149.9 | −553 | 0.4 | 0.8847 | 88.4 | |
| CSPTA-palmitic | 50 | 172.3 | −169.4 | −551 | 0.7 | 0.7982 | 79.8 |
| 100 | 179.5 | −214.6 | −546 | 0.59 | 0.8299 | 82.9 | |
| 150 | 119.4 | −159.3 | −543 | 0.34 | 0.9020 | 90.2 | |
| 200 | 131.6 | −212 | −548 | 0.33 | 0.9048 | 90.4 | |
| 250 | 126.2 | −173.4 | −543 | 0.24 | 0.9308 | 93 | |
| CSPTA-myristic | 50 | 333.8 | −143.7 | −518 | 0.4 | 0.8847 | 88.4 |
| 100 | 167.8 | −145.6 | −504 | 0.3 | 0.9135 | 91.3 | |
| 150 | 224.5 | −264.9 | −519 | 0.19 | 0.9452 | 94.5 | |
| 200 | 219.9 | −250.5 | −521 | 0.18 | 0.9481 | 94.8 | |
| 250 | 103.4 | −132.5 | −488 | 0.14 | 0.9596 | 95.6 | |
| CSPTA-lauric | 50 | 227.3 | −260.8 | −513 | 0.17 | 0.9510 | 95.1 |
| 100 | 105 | −130.5 | −490 | 0.13 | 0.9625 | 96.3 | |
| 150 | 290.3 | −326.2 | −537 | 0.089 | 0.9743 | 97.4 | |
| 200 | 300.7 | −230.2 | −497 | 0.055 | 0.9841 | 98.4 | |
| 250 | 189.8 | −226.5 | −536.5 | 0.046 | 0.9867 | 98.6 |
The values of IE% tracked the matching trend with those attained from the hydrogen evolution measurements but with dissimilar values related with the various techniques. Furthermore, the type of inhibitor can be regarded as an anodic or cathodic if the Ecorr value exceeded a value of 85 mV.58–60 From Table 3, it can be seen that the Ecorr value varies with a maximum shift in Ecorr less than 85 mV, demonstrating a mixed mode for corrosion (disturbs the anodic and cathodic reaction together). Nevertheless, the cathodic direction was more noticeable as a minor shift of Ecorr in the cathodic trend. The potentiodynamic results reveal that the prepared PILs efficiently reduced the corrosion of steel, even used in lesser concentrations in 1 M HCl.
Values of the mean and standard deviation (SD) corrosion current density for the carbon steel electrode at different concentrations of PILs inhibitors in 1 M HCl solution are indicated in S4.†
3.3. Electrochemical impedance spectroscopy (EIS) measurements
The inhibition behavior in 1 M HCl for carbon steel in the absence and presence of several concentrations of CSPTA-stearic, CSPTA-palmitic, CSPTA-myristic, and CSPTA-lauric (the prepared PILs) were also explored using EIS. Fig. 6 and S5† show the EIS Nyquist plots in various concentrations of the PILs inhibitors.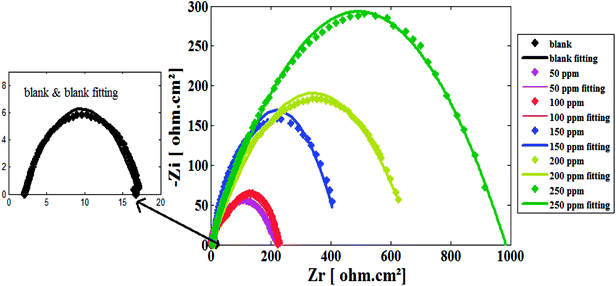 | ||
| Fig. 6 Nyquist plots for carbon steel electrode in 1 M HCl solution with and without various concentrations of CSPTA-lauric. | ||
In Fig. 6, the diameter of capacitive loop in the Nyquist plot is enlarged as the inhibitor concentration is increased. This designates that the charge-transfer reaction is mainly controlling the steel corrosion.61
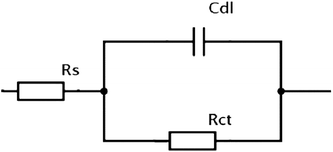
Values of Rc (charge-transfer resistance) and Cdl (double-layer capacitance) resulting from Nyquist plots in the absence and presence of the varied concentrations of PILs inhibitors are listed in Table 4. Values of Cdl are reduced, but the values of Rc are enlarged in the presence of PILs inhibitors, confirming the protecting efficiency of PILs, which is greatly reliant on their concentration. Additionally, the decrease in Cdl values can occur as a result of the electrical double-layer thickness, which exchanges the PILs moieties (that have a lower dielectric constant) with the water molecules (that have a higher dielectric constant). The corrosion occurrence is typically associated with the double-layer performance.62 Besides, working as inhibitors occurs by arranging and adsorption via substituting the water molecules existing at the steel/corrosive medium interface.63
| Inhibitor | Concentration (ppm) | Rc (Ohm) | Cdl (μF cm−2) | θ | IE% |
|---|---|---|---|---|---|
| Blank | 000 | 16.97 | 680.2 | — | — |
| CSPTA-stearic | 50 | 35 | 626.1 | 0.5151 | 51.5 |
| 100 | 39 | 466.3 | 0.5648 | 56.4 | |
| 150 | 62 | 120.6 | 0.7262 | 72.6 | |
| 200 | 84 | 94.53 | 0.7979 | 79.7 | |
| 250 | 86 | 88.34 | 0.8026 | 80.2 | |
| CSPTA-palmitic | 50 | 40 | 190.6 | 0.5757 | 57.5 |
| 100 | 62 | 120.6 | 0.7262 | 72.6 | |
| 150 | 65 | 118.1 | 0.7389 | 73.8 | |
| 200 | 107 | 62.34 | 0.8414 | 84.1 | |
| 250 | 122 | 62.99 | 0.8609 | 86 | |
| CSPTA-myristic | 50 | 83 | 88.06 | 0.7955 | 79.5 |
| 100 | 160 | 72.09 | 0.8939 | 89.3 | |
| 150 | 220 | 45.04 | 0.9228 | 92.2 | |
| 200 | 248 | 33.01 | 0.9315 | 93.1 | |
| 250 | 320 | 40.53 | 0.9469 | 94.6 | |
| CSPTA-lauric | 50 | 218 | 45 | 0.9321 | 93 |
| 100 | 235 | 33.01 | 0.9352 | 93.5 | |
| 150 | 425 | 47.4 | 0.9600 | 96 | |
| 200 | 668 | 41.6 | 0.9745 | 97.4 | |
| 250 | 991 | 36.9 | 0.9828 | 98.2 |
Both the Rc and IE% values improved as the inhibitor concentration is increased, as shown in Fig. 6 and pointed out in Table 4. The inhibition effectiveness (IE%) can be estimated from the results gained by using the next relation:64,65
| IE% = 1 − (Rc1/Rc2) × 100 | (5) |
Values of the mean and standard deviation (SD) for Zi [ohm cm2] for the carbon steel electrode at different concentrations of PILs inhibitors in 1 M HCl solution are indicated in S6.†
Fig. 8 and S7† display the Bode and phase angle plots for the PILs inhibitors for carbon steel in 1 M HCl. In order to define the improved phenomena happening at the interfaces, a frequency range for the Bode-phase curve was applied. At high frequencies, the phase angle was utilized to present an overall indication of the inhibition performance. It is well known that the phase angle value of −90° represents the perfect capacitive action.66,67
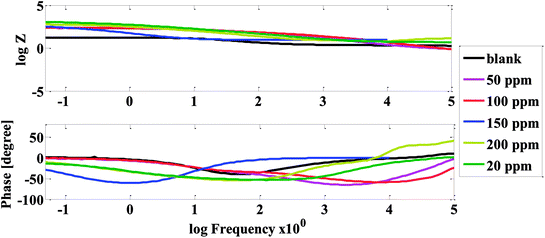 | ||
| Fig. 8 Bode plots for carbon steel electrode in 1 M HCl solution with and without various concentrations of CSPTA-lauric. | ||
Fig. 8 illustrates a growth of the phase angle variation as the concentration of the inhibitor is increased and consequently, the phase angle shifts regularly near to the effective capacitive action. In the Bode plot, at lower frequencies, the absolute impedance improved. This confirmed that the developed surface was protected as the concentration of inhibitor increased, which is correlated to the adsorption effect of the inhibitor on the carbon steel surface.68
3.4. Gravimetric experiments
The effect of various temperatures on the corrosion rate (mg cm−2 h−1) of the carbon steel with and without the PILs inhibitors at a concentration of 250 ppm is indicated in Table 5 and Fig. 9. The inhibitory efficiency of an IL is calculated as follows:| CR = ΔW/At | (6) |
| IE % = [1 − (CR/CRo)] × 100 | (7) |
| Inhibitor | Temperature (T)/K | |||||||
|---|---|---|---|---|---|---|---|---|
| 318 | 328 | 338 | 348 | |||||
| Corr. rate (CR) (mg cm−2 h−1) | IE % | CR | IE % | CR | IE % | CR | IE % | |
| Blank | 7.25 | — | 10.23 | — | 13.51 | — | 19.21 | — |
| CSPTA-stearic | 1.672 | 76.9 | 3.521 | 65.58 | 5.75 | 57.43 | 9.51 | 50.49 |
| CSPTA-palmitic | 0.723 | 90.02 | 1.082 | 89.42 | 2.51 | 81.42 | 6.130 | 68.08 |
| CSPTA-myristic | 0.451 | 93.77 | 0.872 | 91.47 | 2.053 | 84.80 | 5.752 | 70.05 |
| CSPTA-lauric | 0.253 | 96.51 | 0.502 | 95.09 | 1.751 | 87.03 | 3.271 | 82.97 |
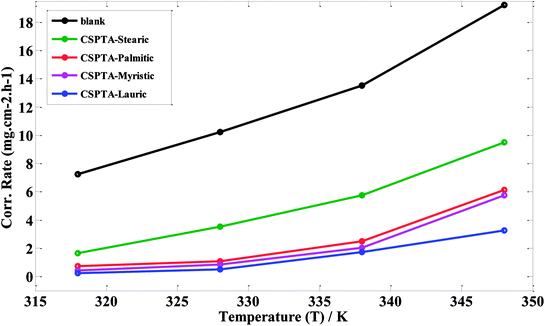 | ||
| Fig. 9 Effect of various temperatures on the corrosion rate (mg cm−2 h−1) of carbon steel with and without PILs inhibitors at a concentration of 250 ppm. | ||
3.5. Surface morphology investigations
Scanning electron microscopy (SEM) and energy dispersive X-ray (EDX) investigations were done to examine the surface morphology and to detect the elements composition formed on the metal surface before and after the involvement of the inhibitor in the corrosive medium.Fig. 10(a) exhibits the EDX bands for elements adsorbed on the carbon steel surface in the absence of inhibitors (blank). Signals of Fe and O ascertain that iron oxide is present, due to metal dissolution (anodic reaction). Also, Fig. 10(a) displays the SEM picture after dropping in 1 M HCl without inhibitor. A coarse severely corroded surface with annihilation was noted on the steel surface.
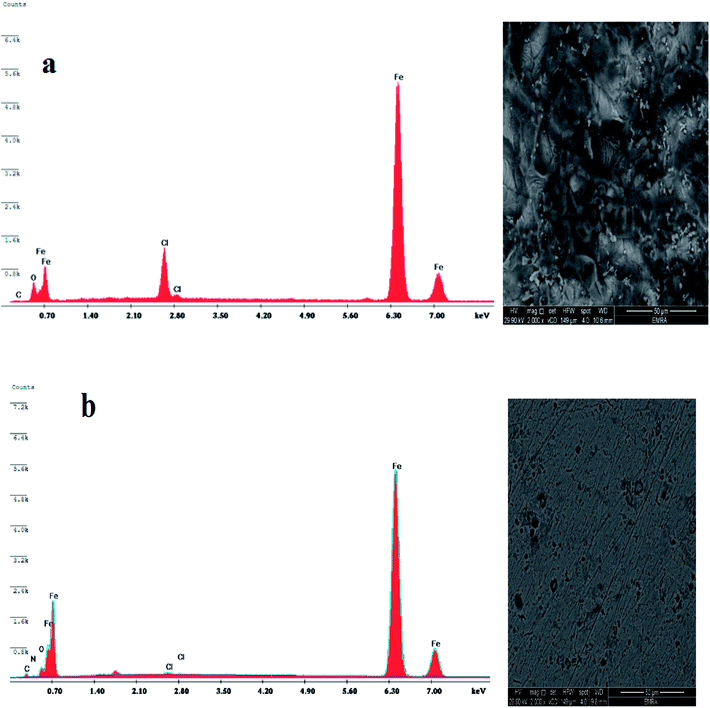 | ||
| Fig. 10 EDX & SEM for (a) sample after immersion in 1 M HCl without inhibitor (blank) and (b) sample after immersion in 1 M HCl solution containing 100 ppm of CSPTA-lauric inhibitor. | ||
Upon the addition of 100 ppm of CSPTA-lauric inhibitor, the EDX spectrum in Fig. 10(b) displayed additional signals, confirming the existence of C and N atoms found in the CSPTA-lauric inhibitor. Additionally, the O signal is developed owing to the oxygen atoms present in the inhibitor. Also, the Fe signals are significantly inhibited regarding the samples in Fig. 10(a) due to the creation of a protective inhibitor film. The SEM photo in Fig. 10(b) shows a clear diminishing in the corroded zones caused by adsorbing the molecules inhibiting the carbon steel surface. As a result, a defensive film was produced on the steel surface compared to the sample immersed in acidic medium without an inhibitor.
The SEM and EDX investigations proved the development of a corrosion-inhibitive film on the carbon steel surface, which therefore inhibited the Fe dissolution and hindered the hydrogen evolution resulting from corrosion.
3.6. Quantum chemical estimations
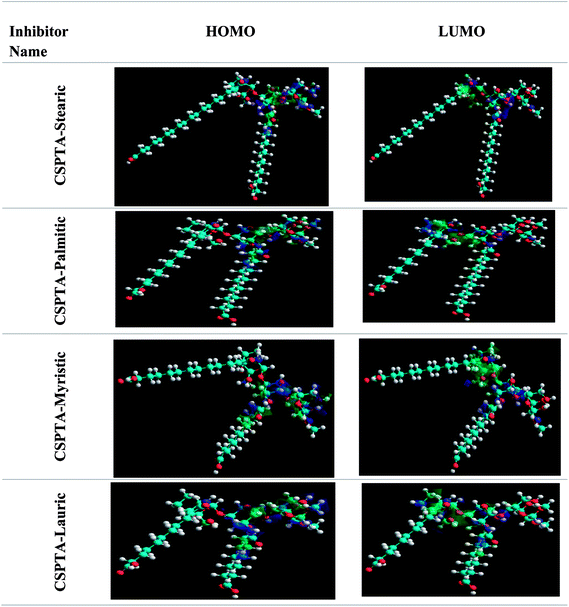
The chemical quantum approaches can be used to study the correlation relating to the organic molecular construction and the inhibition effect.69,70 Tables 6 and 7 show the most essential quantum variables. The results for the molecular frontier orbitals density motions for the PILs molecules are exposed in Fig. 11 and 12. The principle variables are the highest occupied molecular orbital energy (EHOMO) and the lowest unoccupied molecular orbital energy (ELUMO), which play remarkable roles in detecting the molecules adsorption centers, i.e., the higher the EHOMO values are, the easier it is to donate electrons from the inhibitor to the vacant metal d-orbitals. In addition, the capability to gain electrons is governed by the ELUMO values, i.e., the lower the ELUMO values are, the easier it is to add more negative charge via the molecules.| Compound | EHOMO (eV) | ELUMO (eV) | ΔE (eV) | μ (debye) | log![[thin space (1/6-em)]](https://www.rsc.org/images/entities/char_2009.gif) P P |
ΔN |
|---|---|---|---|---|---|---|
| I | −5.941 | 0.228 | 6.169 | 7.37 | 7.28 | 0.671 |
| II | −5.954 | 0.2146 | 6.1686 | 5.91 | 4.90 | 0.669 |
| III | −5.945 | 0.2197 | 6.1647 | 5.43 | 3.04 | 0.671 |
| IV | −5.985 | 0.178 | 6.163 | 5.21 | 1.73 | 0.664 |
| Inhibitor | Ionization potential, I (eV) | Electron affinity, A (eV) | Electronegativity (eV mol−1) | Global hardness, (eV mol−1) | Softness, σ = 1/ηinh (eV−1) |
|---|---|---|---|---|---|
| I | 5.941 | −0.228 | 2.8565 | 3.0845 | 0.324202 |
| II | 5.954 | −0.2146 | 2.8697 | 3.0843 | 0.324223 |
| III | 5.945 | −0.2197 | 2.86265 | 3.08235 | 0.324428 |
| IV | 5.985 | −0.178 | 2.9035 | 3.0815 | 0.324517 |
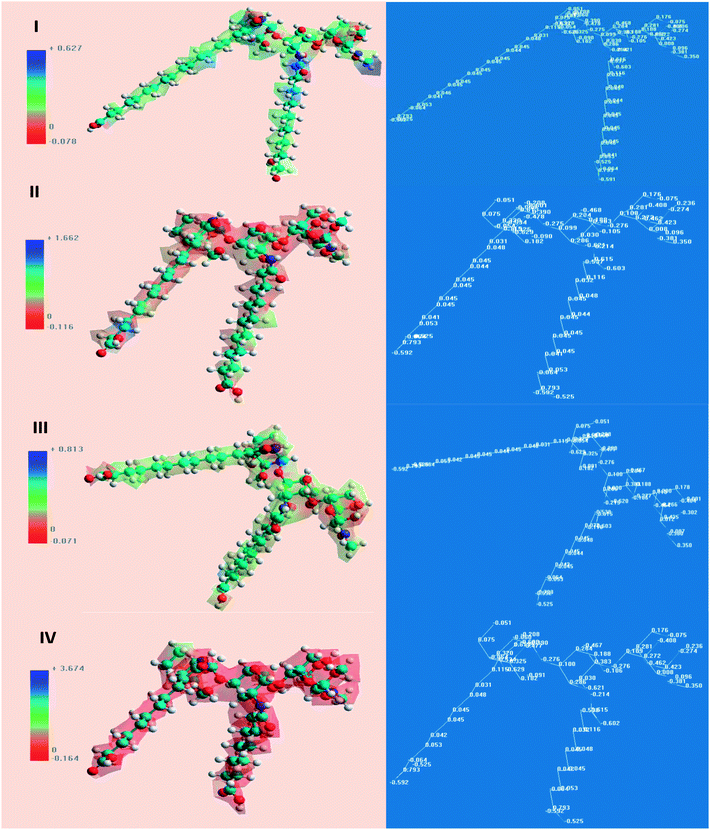 | ||
| Fig. 12 Molecular electrostatic potential map of: (I) CSPTA-stearic, (II) CSPTA-palmitic, (III) CSPTA-myristic, and (IV) CSPTA-lauric. | ||
The energy difference (ΔEL−H) is recognized as the stability key of any inhibitor. So, the higher the values of the inhibitor ΔE, the lower its efficiency as the ionization potential will increase and the energy needed for eliminating an electron from the filled outer orbital will increase.71 Values of low ionization potential represent that the energy needed to eliminate an electron from the occupied exterior orbital is low unlike the values of high dipole moment, which would improve the corrosion inhibition capability.72 This pointed out that the inhibition effectiveness grew in the order: CSPTA-lauric > CSPTA-myristic > CSPTA-palmitic > CSPTA-stearic, which is in complete agreement with the experimental work.
Both the absolute electronegativity (X) and global hardness (η) of the inhibitor molecule are governed by electron affinity (A) value and ionization potential (I) value in this manner:
| X = (1 + A)/2 | (8) |
| η = (1 − A)/2 | (9) |
Then I and A were evaluated from EHOMO to ELUMO in this manner:
| I = −EHOMO | (10) |
| A = −ELUMO | (11) |
The number of transferred electrons (ΔN) from the inhibitor molecules to the carbon steel was estimated using the subsequent equation:73,74
| ΔN = (xfe − xinh)/2(ηfe + ηinh) | (12) |
A positive number of electrons transferred (ΔN) as shown in Table 6 proves that the molecules work as electron donors, and the developed ΔN indicates an extensive readiness to react with atoms of the metal surface. As stated by Lukovits' study, if the ΔN value is less than 3.6, this indicates that the inhibition ability improves with the growing donation capability of electron of the inhibitor at the steel surface.70
From these calculations, it is predicted that the inhibitors act as the electron donor, and the iron surface behaves as the electron acceptor. Inhibitors worked at the metal surface steel by adsorbing and consequently developing an inhibitive adsorbed layer that reduces the corrosion. Besides, the produced inhibitors were adsorbed on the iron surface to form an anticorrosion adsorption inhibitive layer.
4. Conclusions
(1) Four PILs were prepared based on chitosan linked with four different fatty acids and examined as anticorrosion inhibitors through several techniques.(2) Corrosion of carbon steel was considered in 1 M HCl, a source for producing hydrogen.
(3) The addition of the prepared PILs reduced the hydrogen generation rate; besides, the rate was further reduced as the concentration of inhibitor increased.
(4) Electrochemical measurements exhibited that the synthesized PILs had enhanced anticorrosion protection for carbon steel surface in acidic corrosive media and that CSPTA-lauric was the most effective.
(5) The percentage inhibition efficiency increased with developing the inhibitors concentration in 1 M HCl, representing a drop in the corrosion rate of carbon steel. On the other hand, the percentage inhibition decreased with the increase in temperature.
(6) The values attained from hydrogen evolution, polarization, impedance, and gravimetric approaches were in a good matching trend.
(7) SEM and EDX analyses demonstrated that the inhibition was due to forming a defensive film of PILs inhibitors on the surface.
(8) CSPTA-lauric inhibitor had the highest inhibitive effectiveness owing to having the lowest (ΔE) energy gap values, and hence, it was the most proficient one for the donation of electrons.
(9) ILs suggest a possible chance for innovatory applications for green chemistry. A great development in this area is expected thanks to the significantly enhanced ecofriendly benefits of these compounds in parallel with traditional inhibitors.
Conflicts of interest
There are no conflicts to declare.Acknowledgements
This work had been reinforced by Suez Canal University (SCU) and the Egyptian Petroleum Research Institute (EPRI).References
- M. A. Deyab, J. Power Sources, 2015, 292, 66–71 CrossRef CAS.
- A. Mohsenzadeh, Y. Al-Wahaibi, R. Al-Hajri and B. Jibril, J. Pet. Sci. Eng., 2015, 133, 114–122 CrossRef CAS.
- H. Mąka, T. Spychaj and J. Adamus, RSC Adv., 2015, 5, 82813–82821 RSC.
- J. Saien and S. Hashemi, J. Pet. Sci. Eng., 2018, 160, 363–371 CrossRef CAS.
- B. Haddad, D. Mokhtar, M. Goussem, E. Belarbi, D. Villemin, S. Bresson, M. Rahmouni, N. R. Dhumal, H. J. Kim and J. Kiefer, J. Mol. Struct., 2017, 1134, 582–590 CrossRef CAS.
- A. S. Hanamertani, R. M. Pilus, A. K. Idris, S. Irawan and I. M. Tan, J. Pet. Sci. Eng., 2018, 162, 480–490 CrossRef CAS.
- T. Moumene, E. H. Belarbi, B. Haddad, D. Villemin, O. Abbas, B. Khelifa and S. Bresson, J. Mol. Struct., 2015, 1083, 179–186 CrossRef CAS.
- C. Wang, X. Hu, P. Guan, L. Qian, D. Wu and J. Li, Int. J. Polym. Anal. Charact., 2014, 19, 70–82 CrossRef CAS.
- S. L. Bacon, R. J. Ross, A. J. Daugulis and J. S. Parent, Green Chem., 2017, 19, 5203–5213 RSC.
- A. M. El-Shamy, K. Zakaria, M. A. Abbas and S. Zein El Abedin, J. Mol. Liq., 2015, 211, 363–369 CrossRef CAS.
- M. S. Morad, Corros. Sci., 2000, 42, 1307–1326 CrossRef CAS.
- M. A. Deyab, M. T. Zaky and M. I. Nessim, J. Mol. Liq., 2017, 229, 396–404 CrossRef CAS.
- R. Bodirlau, C.-A. Teaca and I. Spiridon, Int. J. Polym. Anal. Charact., 2010, 15, 460–469 CrossRef CAS.
- M. Scendo and J. Uznanska, Int. J. Corros., 2011, 2011, 1–13 Search PubMed.
- D. Yang, M. Zhang, J. Zheng and H. Castaneda, RSC Adv., 2015, 5, 95160–95170 RSC.
- M. Echeverría, C. M. Abreu, F. J. Deive, M. A. Sanromán and A. Rodríguez, RSC Adv., 2014, 4, 59587–59593 RSC.
- Q. Zhang and Y. Hua, Mater. Chem. Phys., 2010, 119, 57–64 CrossRef CAS.
- K. Khaled, Appl. Surf. Sci., 2004, 230, 307–318 CrossRef CAS.
- P. Bonhote, A.-P. Dias, N. Papageorgiou, K. Kalyanasundaram and M. Grätzel, Inorg. Chem., 1996, 35, 1168–1178 CrossRef CAS PubMed.
- Q. B. Zhang and Y. X. Hua, Electrochim. Acta, 2009, 54, 1881–1887 CrossRef CAS.
- X. Zhou, H. Yang and F. Wang, Electrochim. Acta, 2011, 56, 4268–4275 CrossRef CAS.
- X. Li, S. Deng and H. Fu, Corros. Sci., 2011, 53, 1529–1536 CrossRef CAS.
- M. Taghavikish, S. Subianto, N. K. Dutta, L. de Campo, J. P. Mata, C. Rehm and N. R. Choudhury, ACS Omega, 2016, 1, 29–40 CrossRef CAS.
- A. M. Atta, H. A. Al-Lohedan, M. M. S. Abdullah and S. M. ElSaeed, J. Ind. Eng. Chem., 2016, 33, 122–130 CrossRef CAS.
- E. S. H. El Tamany, S. M. Elsaeed, H. Ashour, E. G. Zaki and H. A. El Nagy, J. Mol. Struct., 2018, 1168, 106–114 CrossRef CAS.
- A. M. Fekry and R. R. Mohamed, Electrochim. Acta, 2010, 55, 1933–1939 CrossRef CAS.
- G. A. El-Mahdy, A. M. Atta, H. A. Al-Lohedan and A. O. Ezzat, Int. J. Electrochem. Sci., 2015, 10, 5812–5826 CAS.
- P. B. Raja, M. Fadaeinasab, A. K. Qureshi, A. A. Rahim, H. Osman, M. Litaudon and K. Awang, Ind. Eng. Chem. Res., 2013, 52, 10582–10593 CrossRef CAS.
- M. Sadeghi-Kiakhani and S. Safapour, J. Ind. Eng. Chem., 2016, 33, 170–177 CrossRef CAS.
- C. Choi, J.-P. Nam and J.-W. Nah, J. Ind. Eng. Chem., 2016, 33, 1–10 CrossRef CAS.
- Y. An, G. Jiang, Y. Ren, L. Zhang, Y. Qi and Q. Ge, J. Pet. Sci. Eng., 2015, 135, 253–260 CrossRef CAS.
- M. A. Elgadir, M. S. Uddin, S. Ferdosh, A. Adam, A. J. K. Chowdhury and M. Z. I. Sarker, J. Food Drug Anal., 2015, 23, 619–629 CrossRef CAS PubMed.
- N. E. Suyatma, A. Copinet, E. Legin-Copinet, F. Fricoteaux and V. Coma, J. Polym. Environ., 2011, 19, 166–171 CrossRef CAS.
- S. Pokhrel, P. N. Yadav and R. Adhikari, Nepal Journal of Science and Technology, 2016, 16, 99–104 CrossRef.
- S. A. Umoren and U. M. Eduok, Carbohydr. Polym., 2016, 140, 314–341 CrossRef CAS PubMed.
- R. A. A. Muzzarelli, M. Guerrieri, G. Goteri, C. Muzzarelli, T. Armeni, R. Ghiselli and M. Cornelissen, Biomaterials, 2005, 26, 5844–5854 CrossRef CAS PubMed.
- I. Aranaz, R. Harris and A. Heras, Curr. Org. Chem., 2010, 14, 308–330 CrossRef CAS.
- J. H. Hamman, Mar. Drugs, 2010, 8, 1305–1322 CrossRef CAS PubMed.
- S. K. Shukla, A. K. Mishra, O. A. Arotiba and B. B. Mamba, Int. J. Biol. Macromol., 2013, 59, 46–58 CrossRef CAS PubMed.
- R. A. A. Muzzarelli and C. Muzzarelli, in Polysaccharides I, ed. T. Heinze, Springer-Verlag, Berlin/Heidelberg, 2005, vol. 186, pp. 151–209 Search PubMed.
- S. Mima, M. Miya, R. Iwamoto and S. Yoshikawa, J. Appl. Polym. Sci., 1983, 28, 1909–1917 CrossRef CAS.
- H. Zhang, S. Wu, Y. Tao, L. Zang and Z. Su, J. Nanomater., 2010, 2010, 1–5 Search PubMed.
- A. Chinnappan, A. H. Jadhav, J. M. C. Puguan, R. Appiah-Ntiamoah and H. Kim, Energy, 2015, 79, 482–488 CrossRef CAS.
- I. B. Obot, S. A. Umoren and N. O. Obi-Egbedi, J. Mater. Environ. Sci., 2011, 2, 60–71 CAS.
- D. de Britto, L. A. Forato and O. B. G. Assis, Carbohydr. Polym., 2008, 74, 86–91 CrossRef CAS.
- X. Fei Liu, Y. Lin Guan, D. Zhi Yang, Z. Li and K. De Yao, J. Appl. Polym. Sci., 2001, 79, 1324–1335 CrossRef.
- Y.-I. Jeong, D.-G. Kim, M.-K. Jang and J.-W. Nah, Carbohydr. Res., 2008, 343, 282–289 CrossRef CAS PubMed.
- W. Huang and J. Zhao, Colloids Surf., A, 2006, 278, 246–251 CrossRef CAS.
- C. Cao, Corros. Sci., 1996, 38, 2073–2082 CrossRef CAS.
- M. A. Migahed, M. M. EL-Rabiei, H. Nady, A. Elgendy, E. G. Zaki, M. I. Abdou and E. S. Noamy, Journal of Bio- and Tribo-Corrosion, 2017, 3, 31 CrossRef.
- M. A. Migahed, A. Elgendy, M. M. EL-Rabiei, H. Nady and E. G. Zaki, J. Mol. Struct., 2018, 1159, 10–22 CrossRef CAS.
- B. Lin, R. Hu, C. Ye, Y. Li and C. Lin, Electrochim. Acta, 2010, 55, 6542–6545 CrossRef CAS.
- X.-H. Li, S.-D. Deng, H. Fu and G.-N. Mu, J. Appl. Electrochem., 2009, 39, 1125–1135 CrossRef CAS.
- M. Liang, H. Zhou, Q. Huang, S. Hu and W. Li, J. Appl. Electrochem., 2011, 41, 991–997 CrossRef CAS.
- X. Li, S. Deng, G. Mu, H. Fu and F. Yang, Corros. Sci., 2008, 50, 420–430 CrossRef CAS.
- V. M. Abbasov, H. M. Abd El-Lateef, L. I. Aliyeva, E. E. Qasimov, I. T. Ismayilov and M. M. Khalaf, Egypt. J. Pet., 2013, 22, 451–470 CrossRef.
- Q. Qu, L. Li, W. Bai, S. Jiang and Z. Ding, Corros. Sci., 2009, 51, 2423–2428 CrossRef CAS.
- F. G. Liu, M. Du, J. Zhang and M. Qiu, Corros. Sci., 2009, 51, 102–109 CrossRef CAS.
- K. Ramya, K. K. Anupama, K. M. Shainy and A. Joseph, Egypt. J. Pet., 2017, 26, 421–437 CrossRef.
- D. K. Yadav, B. Maiti and M. A. Quraishi, Corros. Sci., 2010, 52, 3586–3598 CrossRef CAS.
- M. Lebrini, F. Bentiss, N.-E. Chihib, C. Jama, J. P. Hornez and M. Lagrenée, Corros. Sci., 2008, 50, 2914–2918 CrossRef CAS.
- R. Solmaz, Corros. Sci., 2014, 81, 75–84 CrossRef CAS.
- S. Ramesh and S. Rajeswari, Electrochim. Acta, 2004, 49, 811–820 CrossRef CAS.
- M. Bouklah, B. Hammouti, M. Benkaddour and T. Benhadda, J. Appl. Electrochem., 2005, 35, 1095–1101 CrossRef CAS.
- A. A. Abd-Elaal, N. M. Elbasiony, S. M. Shaban and E. G. Zaki, J. Mol. Liq., 2018, 249, 304–317 CrossRef CAS.
- M. A. Migahed, E. G. Zaki and M. M. Shaban, RSC Adv., 2016, 6, 71384–71396 RSC.
- M. A. Hegazy, A. M. Hasan, M. M. Emara, M. F. Bakr and A. H. Youssef, Corros. Sci., 2012, 65, 67–76 CrossRef CAS.
- M. A. Migahed, M. M. EL-Rabiei, H. Nady, A. Elgendy, E. G. Zaki, M. I. Abdou and E. S. Noamy, Journal of Bio- and Tribo-Corrosion, 2017, 3, 31 CrossRef.
- D. F. V. Lewis, C. Ioannides and D. V. Parke, Xenobiotica, 1994, 24, 401–408 CrossRef CAS PubMed.
- M. A. Migahed, A. M. Al-Sabagh, E. A. Khamis and E. G. Zaki, J. Mol. Liq., 2015, 212, 360–371 CrossRef CAS.
- L. Saqalli, M. Galai, F. Benhiba, N. Gharda, N. Habbadi, R. Ghailane and M. Ebn, J. Mater. Environ. Sci., 2017, 8(7), 2455–2467 CAS.
- L. Adardour, H. Lgaz, R. Salghi, M. Larouj, S. Jodeh, M. Zougagh, O. Hamed and M. Taleb, Pharm. Lett., 2016, 8, 173–185 Search PubMed.
- I. Lukovits, E. Kálmán and F. Zucchi, Corrosion, 2001, 57, 3–8 CrossRef CAS.
- E. S. H. El Ashry, A. El Nemr and S. Ragab, J. Mol. Model., 2012, 18, 1173–1188 CrossRef PubMed.
Footnote |
| † Electronic supplementary information (ESI) available. See DOI: 10.1039/c8ra05444d |
| This journal is © The Royal Society of Chemistry 2018 |

