 Open Access Article
Tuning the porosity and surface characteristics of nanoporous titania using non-ionic surfactant reverse micelles†
Polyxeni Paschalidou and
Charis R. Theocharis *
*
Porous Solids Group, Department of Chemistry, University of Cyprus, P. O. Box 20537, 1678, Nicosia, Cyprus. E-mail: charis@ucy.ac.cy
First published on 23rd August 2018
Abstract
Nanoporous titania was prepared from non-ionic surfactant reverse micelles (e.g. Triton-X) and the effects of the chain length of the surfactants and calcination temperature of the precursor gels on the surface properties of the product (mesoporous titania) were investigated. The studies included sample characterization of the precursor gels from the titania samples characterized by UV-Vis, ATR-FTIR, XRD, TGA/DSC and the titania samples by N2-adsorption BET, XRD, FT-IR, UV-Vis diffuse reflectance and SEM measurements after calcination at 400 °C, 500 °C, 600 °C, 700 °C and 800 °C. According to the experimental results, generally increasing the length of the polar tail of Triton-X results in an increased specific surface area and volume, and an average pore diameter of the solids. Moreover, increasing the length of the polar tail is associated with a smaller crystallite size and higher thermal stability of the materials. Finally, a nucleation mechanism of the titania particles within the aqueous centre of the reversed micelles is proposed.
Introduction
Titania (TiO2) is widely used in many industrial applications (for example, heterogeneous catalysis, photocatalysis, adsorption, pigments) because of its electronic properties, stability and availability.1–4 Moreover, titania is expected to play a key role in a number of high-impact fields, such as energy production and clean technologies.5 In this context, the preparation of mesoporous TiO2 materials with a high surface area and controlled pore size is of particular interest.6There has been a large number of papers published describing several different synthetic methods for the synthesis of mesoporous TiO2 materials.7 These methods include hydrothermal processes,8–10 pyrolysis,11 thermal decomposition,12 alkaline precipitation,13,14 combustion,15 mechanochemical and electrochemical methods,16,17 sol–gel methods,18 gas-phase condensation,19 microwave and ultrasound techniques.20,21
Precipitation and sol–gel methods have been applied also in combination with colloidal systems (e.g. emulsions and microemulsions) or surfactants and polymers to better control the surface properties and purity of the prepared solids.22–25 The variety of emulsions, polymers and surfactants available allows the design of a large number of preparation pathways and the production of TiO2 materials with controlled textural and surface properties6,7,22,26. In addition, the use of surfactants and the formation of titania in micellar compartments favours the stabilization of nanosized TiO2 particles.23–25,27,28 Despite the fact that non-ionic surfactants have several advantages (e.g. weak repulsion interactions, easy removal) the number of studies related to titania preparation by means of Triton-X is limited.23,28–31 Triton-X has been used basically in the preparation of titania by pressurized fluid extraction and supercritical drying methods.4,6,7,32–35
Several studies have been published in which reverse micelles have been used in the synthesis of nanoporous materials. In this paper, we present the first systematic study of the synthesis of porous titanium dioxide with the use of electrically neutral amphiphilic molecules of the so-called Triton-X series forming reverse micelles. This allowed us to study the effect of the alkyl chain length on the synthesis of the inorganic product. We also studied the effects of the synthesis and post-synthesis conditions on the surface properties of the product. We were able to study the nucleation of titania particles within the aqueous core of the inverse micelles. We also studied the reaction of water in the core of the micelles and the alkoxide titanium precursor in the non-aqueous exterior of the micelles, requiring the migration of the alkoxide into the core, and through the exterior of the micelle.
Further, we studied the effect of the calcination temperature of the precursor gels on the surface properties of the titania solids produced. Moreover, the effect of cyclohexane treatment prior to calcination on the surface characteristics of titania was studied. Finally, a nucleation mechanism of the TiO2 particles within the aqueous centre of the reversed micelles is proposed.
Experimental
TiO2 solid samples were prepared using Ti(OiPr)4 as the precursor36,37 and Triton-X to form the non-ionic reverse micelle microemulsions. Specifically, three different mixtures of reversed micelles were prepared by mixing separately Triton X-100 (extra pure, Fisher Chemical), Triton X-114 (extra pure, Sigma-Aldrich) and Triton X-45 (extra pure, Sigma-Aldrich) and cyclohexane (99.98%, Fisher Chemical) at a concentration of 1.2 mol kg−1. Next, deionized water (Merck Millipore) was added at a molar ratio of 0.8. The mixture was stirred under a N2-atmosphere for 1 h to form the reversed micelles with the aqueous compartment in their centre. Then, Ti(OiPr)4 was added at a molar ratio of one ([Ti(OiPr)4]/[H2O] = 1) and the mixture was left for 48 h under ambient conditions to form the corresponding gels. Prior to calcination, the gels were stirred for 16 h with an excess of cyclohexane to remove the organic phase from the inorganic residual (TiO2 solids). Finally, aliquots of the TiO2 residuals were calcined at 400 °C, 500 °C, 600 °C, 700 °C and 800 °C for 2 h.The gels and the powders obtained upon calcination were characterized using a variety of techniques, such as UV-Vis absorption spectroscopy (Shimadzu, UV-2401PC), UV-Vis Reflection Spectroscopy (USB2000, Ocean Optics), ATR and FTIR spectroscopy (Shimadzu, FT-8900), X-ray diffraction (Shimadzu, XRD-6000), SEM (Vega TS5136LS-Tescan), TGA (Shimadzu TGA-50) and DSC (TA Universal Analysis 2010 Quantachrome DSC-Q100 model). Nitrogen adsorption/desorption isotherms were obtained using an ASAP-2010 Micromeritics apparatus and the specific surface areas were calculated from the adsorption data using the Brunauer–Emmett–Teller method, whilst the pore size distributions were estimated from the isotherms using both the DFT methods (a program supplied with the instrument) employing an ink-bottle-shaped pore model and the BJH method.
Results and discussion
Characterisation of the TiO2-Triton-X gels
At the beginning of the reaction, the two reagents are on the opposite sides of the micelles, with water in the core, and titanium isopropoxide dissolved in the solvent outside. The isopropoxide can diffuse through the chains of the surfactant towards the aqueous centre. There, it can either insert itself into the micelle with the O−⋯Ti4+ moiety towards the core, or can penetrate as a whole inside, either way resulting in exposure to water and subsequent reaction to form titania. As more titanium ions are introduced and hydrolyzed, small crystallites of the titania structure are formed eventually, disrupting the mechanical integrity of the micelle and causing it to disintegrate. This allows crystallites to assemble, grow in size and precipitate into a well-defined solid. Furthermore, the use of an organometallic precursor for the oxide enables better control of the hydrolysis and precipitation processes. The micelles provide a means of structure-directing action. Furthermore, there is no fast and uncontrolled precipitation taking place.The neutral surfactant Triton-X was used because the lack of charges meant that it was involved only in weak dispersive forces, allowing a higher extent of reactions to give titania. This also leads to the synthesis of more thermally stable solids, where after the precipitation of titania, the organic residues could be easily removed thermally. Finally, there is a scarcity of papers discussing the effect of different chain lengths.
A small amount of water was used in the synthesis, as this would give rise to a smaller micelle diameter.
A longer tail length may indeed result in a larger overall diameter, but would not influence the size of the aqueous core. On the other hand, a longer chain length will result in higher disorder of the chains and will interfere with the diffusion of the isopropoxide moieties towards the core, in order for hydrolysis to take place.
Water in the micelle core consists of free water molecules that are available for reaction with the titanium ions. There may be water molecules that are hydrogen-bonded to both the hydrophilic end of the surfactant molecules, as well as the titanium ions. These will stabilize the micelles, but would not interfere in the precipitation reaction. The only water present is that added during the micelle forming step.
Fig. 1 shows images of the TiO2-Triton-X gels corresponding to the three different types of Triton-X studied (Triton X-100, Triton X-114 and Triton X-45). The gels are clear, indicating the successful preparation of the TiO2 nanoparticles within the cavities of the reverse micelles.23 In contrast to the two other gels, which are almost colourless, the gel corresponding to Triton X-114 has an intense yellow colour, most probably related to the size of the formed TiO2 nanoparticles.
 | ||
| Fig. 1 Images of the three different TiO2-Triton-X gels, corresponding to (A) Triton X-100, (B) Triton X-114 and (C) Triton X-45. | ||
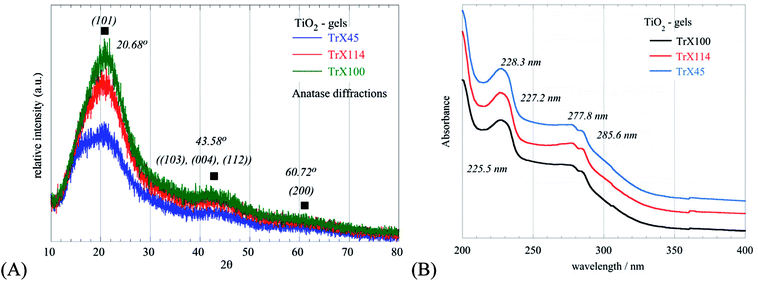
The XRD diffractograms obtained for the three different gels are shown in Fig. 2A and indicate the formation of nanosized TiO2 particles. The broad peaks at 2θ values of 20.68°, 43.58° and 60.72°, corresponding to the (101), ((103), (004), (112)) and (200) reflections, respectively, indicate the formation of anatase, which is the metastable form of titania.38,39 Moreover, based on the Debye–Scherrer equation the crystal size (LXRD) was evaluated40 and the corresponding data are summarized in Table 1. From these data, it is clear that smaller surfactant tail lengths are associated with smaller LXRD values and hence smaller TiO2 crystallites. This was corroborated also from the energy band gap values (Table 1) evaluated from the UV-Vis spectra of the TiO2-Triton-X gels shown in Fig. 2B. Specifically, with an increasing length of the surfactant tail, the UV peaks at 230 nm are shifted to lower wavelengths, associated with an increasing energy gap and decreasing crystallite size.41,42 The UV peaks around 278 nm and 285 nm are similar for all spectra and are ascribed to p-substituted phenyl group of the Triton-X surfactants.43
| Gel sample | 2θBragg (°) | Level | dBragg (Å) | FWHM (°) | LXRD (nm) | Peak TiO2 (nm) | Band gap TiO2 (eV) |
|---|---|---|---|---|---|---|---|
| TiO2-TrX-100 | 25.19 | (101) | 3.5324 | 1.71 | 4.99 | 225.5 | 5.5 |
| TiO2-TrX-114 | 25.57 | (101) | 3.4809 | 1.62 | 5.26 | 227.2 | 5.46 |
| TiO2-TrX-145 | 26.05 | (101) | 3.4179 | 0.81 | 10.52 | 228.3 | 5.43 |
Characterisation of the TiO2 solids
After cyclohexane treatment, aliquots of the TiO2-Triton X gels were calcined at 400 °C for 2 h to remove the organic matrix (TGA/DSC data included in Fig. 1S and Table 1S, ESI†) and the surface properties of the resulting TiO2 solids were determined by N2 isothermal adsorption/desorption. The corresponding isotherms and pore size distributions are presented in Fig. 3, and the associated data are summarized in Table 2.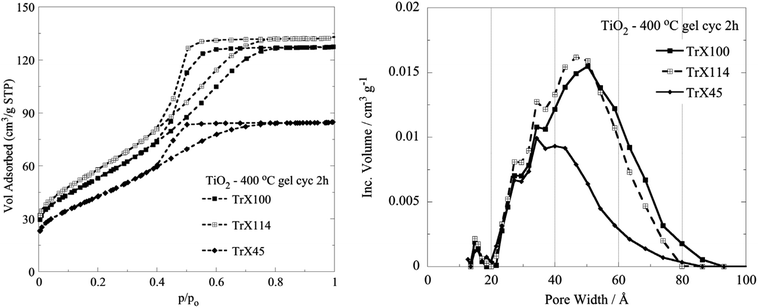 | ||
| Fig. 3 N2 adsorption/desorption isotherms and DFT pore size distributions of the titania solids obtained after calcination of the corresponding TiO2-Triton X gels at 400 °C for 2 h. | ||
| Sample (cyc) | Tail length (average EO units) | SpABET (m2 g−1) | VSp (cm3 g−1) | dBJH (nm) | dDFT (nm) |
|---|---|---|---|---|---|
TiO2 TrX-100![[thin space (1/6-em)]](https://www.rsc.org/images/entities/char_2009.gif) 400 °C 2 h 400 °C 2 h |
9–10 | 182.2 | 0.196 | 3.26 | 5.04 |
TiO2 TrX-114![[thin space (1/6-em)]](https://www.rsc.org/images/entities/char_2009.gif) 400 °C 2 h 400 °C 2 h |
7–8 | 199.3 | 0.201 | 3.14 | 4.67 |
| TiO2 TrX-45 400 °C 2 h | 4–5 | 146.3 | 0.124 | 2.92 | 3.4 |
In Fig. 3, the isotherms are seen to be of type IV with an H2 hysteresis loop, which are characteristic for variable diameter pores (ink bottle shaped), indicating the presence of mesopores according to the IUPAC classification.44,45 Moreover, the plateau for p/po > 0.7 indicates the formation of “real” mesopores formed by the aggregation of primary crystallites. From the data in Table 2, it is obvious that generally increasing the length of the surfactant tail results in an increased specific surface area, pore volume and pore diameter,46 suggesting that the surface characteristics of the solids can be tailored by choosing a surfactant with an appropriate tail length. The differences in the surface properties between the solid produced after calcination at 400 °C using the surfactant with the smallest tail (Triton X-45) and the surfactant with the longest tail (Triton X-100) were significant. However, although the tail length of Triton X-114 is slightly smaller than the tail length of Triton X-100, the solid produced from the Triton X-114 TiO2-gel after calcination at 400 °C presented the highest BET surface area, attributed most probably to specific interactions of the polar tail of Triton X-114 with the inorganic precursors. Regarding the pore size and volume of the TiO2 solid, it is clear from the data presented in Fig. 3 and summarized in Table 2 that both the pore size and volume decreased almost linearly with decreasing tail length, indicating the strong correlation between these parameters. In Table 2, we present the pore diameter data calculated both by the BJH and the DFT methods for comparison. The two methods gave values very close to each other.
Furthermore, the TiO2 solids were characterised by XRD and the corresponding data are presented graphically in Fig. 4 and summarized in Table 3. The diffractrograms corresponding to the three TiO2 solids are similar and show 11 peaks, which can be assigned to anatase, which has a tetragonal crystal structure and is the thermally metastable form of titania.40 However, based on the FWHM of the fundamental peak associated with the crystal surface (101), the crystallinity of the TiO2 particles formed depends on the Triton X surfactant used. According to the data summarized in Table 3, the TiO2 particles obtained from Triton X-100 were the most crystalline followed by the solids obtained from Triton X-45 and Triton X-114, which is in agreement with the corresponding surface data.
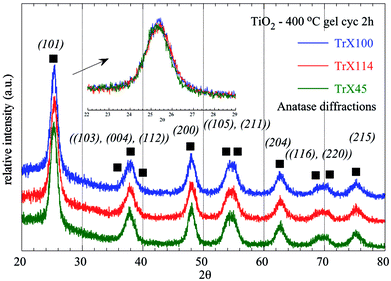 | ||
| Fig. 4 XRD diffractograms of titania solids obtained after calcination of the three different TiO2 Triton-X gels (Triton X-100, 114 and 45) at 400 °C for 2 h. | ||
| Sample (cyc) | SpABET (m2 g−1) | 2θBragg (°) | Level | dBragg (Å) | FWHM (°) | LXRD (nm) |
|---|---|---|---|---|---|---|
TiO2 TrX-100![[thin space (1/6-em)]](https://www.rsc.org/images/entities/char_2009.gif) 400 °C 2 h 400 °C 2 h |
182.2 | 25.37 | (101) | 3.508 | 1.349 | 6.3 |
TiO2 TrX-114![[thin space (1/6-em)]](https://www.rsc.org/images/entities/char_2009.gif) 400 °C 2 h 400 °C 2 h |
199.3 | 25.39 | (101) | 3.505 | 1.446 | 5.9 |
| TiO2 TrX-45 400 °C 2 h | 146.3 | 25.33 | (101) | 3.514 | 1.351 | 6.3 |
The FTIR spectra of the three different TiO2 solids obtained after calcination of the related gels are shown in Fig. 5. The peak at 1626 cm−1 corresponds to adsorbed water, whereas the sharp peak at 1391 cm−1 can be attributed to Ti–OH vibrations.47 The broad peak spanning the area 850–400 cm−1 in the FTIR spectra (Fig. 5), which corresponds to vibrations in the TiO2 lattice, is of particular interest. It is noticed that a significant peak-broadening with increasing the surfactant tail length is observed. This effect is due, presumably, to the particle size produced using different Triton X surfactants and is in agreement with the results obtained from the surface and XRD analyses. Furthermore, DRUV-Vis spectra of the TiO2 solids (Fig. 6) corroborate the effect of the surfactant tail length on the formed particle size. According to Fig. 6, there is a blue-shift of the TiO2 spectra with the decreasing particle size, which is attributed to the fact that smaller particles are associated with a larger energy gap and hence absorption occurs at higher energies.42,48
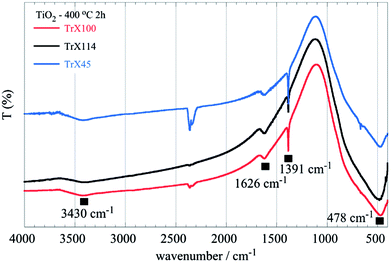 | ||
| Fig. 5 FTIR spectra of titania solids obtained after calcination of the three different TiO2 Triton-X gels (Triton X-100, 114 and 45) at 400 °C for 2 h. | ||
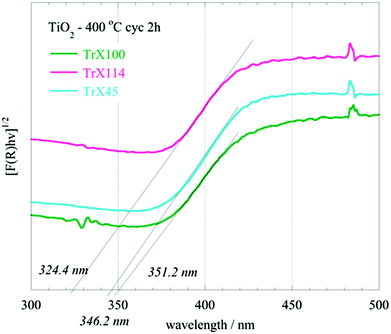 | ||
| Fig. 6 DRUV-Vis spectra of titania solids obtained after calcination of the three different TiO2 Triton-X gels (Triton X-100, 114 and 45) at 400 °C for 2 h. | ||
Temperature effect on the surface properties of the TiO2 solids
The N2 adsorption isotherms obtained for the three different TiO2 solids after calcination at 500 °C and 600 °C are presented along with the isotherms obtained after calcination at 400 °C in Fig. 7. | ||
| Fig. 7 N2 adsorption isotherms of titania solids obtained after calcination of the three different TiO2 Triton-X gels (Triton X-100, 114 and 45) at 400 °C, 500 °C and 600 °C for 2 h. | ||
From the isotherms (Fig. 7), it can be seen that the solids obtained from the calcination of the Triton X-100 gel present the highest thermal stability, followed by the oxide obtained from the calcination of the Triton X-114 and the Triton X-45 gels. It is of particular interest that even after calcination at higher temperatures, the TiO2 solid arising from the Triton X-100 gel presents the better surface characteristics (Table 2S, ESI†), which is due, as already mentioned, to the better interaction of the Triton X-100 polar tail with the inorganic TiO2 precursors.
Moreover, the diffractograms (Fig. 8) show that the transformation of anatase to rutile can be observed for the TiO2 solid obtained from the Triton X-100 gel only at 800 °C indicating the high thermal stability of the respective sample. In contrast, this transformation for the other TiO2 solids is observed from 700 °C. The peaks corresponding to the rutile phase appear at 2θ = 27.39°, 35.94°, 39.13°, 41.15°, 43.91°, 54.2°, 56.52°, 63.91°, 69.13° and 69.85°, corresponding to the (110), (101), (200), (111), (210), (211), (220), (002), (301) and (112) crystal planes.49,50
 | ||
| Fig. 8 XRD diffractograms of the TiO2 solids obtained from the three different Triton X gels and after calcination at various temperatures between 400 °C and 800 °C. | ||
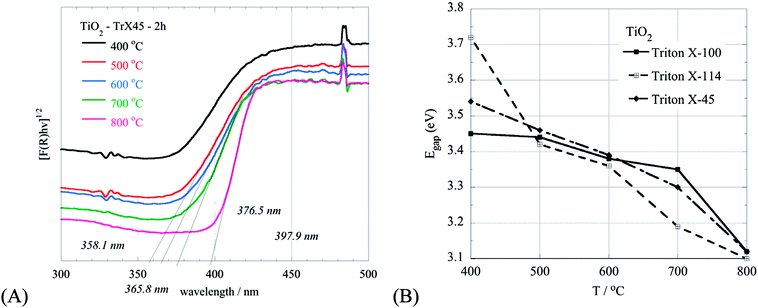
The effect of the calcination temperature on the characteristics of the TiO2 solids are supported also by the DRUV-Vis measurements of the samples, as shown in Fig. 9A for the TiO2 solid obtained from the Triton X-45 gel. Generally, with an increased temperature, the particle size increases and the energy gap decreases accordingly (Fig. 9B). However, in the case of the TiO2 solid obtained from the Triton X-45 gel, this does not follow because of the presence of both TiO2 phases (rutile and anatase) in the solid. Hence, the decline in the energy gap due to the increased particle size is compensated by the favoured formation of rutile in the solid at increased calcination temperatures.51 These results (XRD & DRUV-Vis) are in agreement with the presence of a flake morphology in the TiO2 nanoparticles in the SEM micrographs (Fig. 2S, ESI†), which is related to the rutile structure.52
Formation mechanism of TiO2 particles by means of Triton-X reversed micelles
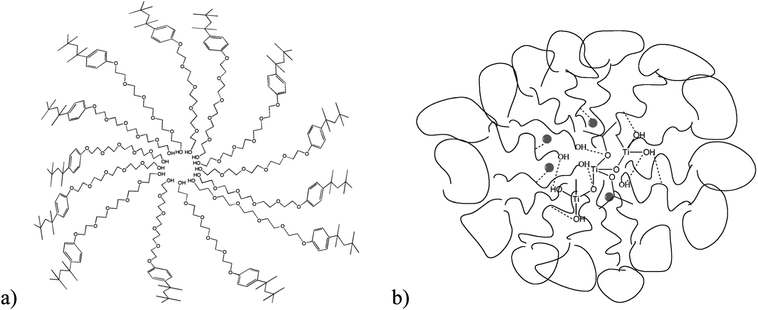
The reverse micelles studied here are formed when the polar tails of the Triton-X surfactants are oriented around the water droplets and the non-polar heads are oriented towards the organic phase.53 The diameter of water droplets formed depends on the chain length of the Triton-X surfactant used28 and it is obvious that surfactants with increased tail length form micelles with a higher diameter and inner-space diameter, as schematically shown in Fig. 10.When the TiO2 precursor compound Ti(OiPr)4 is added to the suspension and distributed within the inner-space of the micelles, which is filled with water (water droplets), hydrolysis and condensation of the precursor molecules start, as described by eqn (1) and (2).54
| Ti(OiPr)4 + 4H2O → Ti(OH)4 + 4iPrOH (hydrolysis) | (1) |
| Ti(OH)4 → TiO2·xH2O + (2 − x)H2O (condensation) | (2) |
The hydrolysis and condensation rate of the Ti(OiPr)4 within the micelles is largely controlled because both reactions can only occur within the aqueous centre of the micelles induced by the interactions of the polar tails with the isopropyl-moieties and the water molecules.22,34 Taking into account that the concentration of the reactants is similar in all three systems, it could be expected that in the case of Triton X-100, the inner-space is the largest and hence it is expected that fewer particles with an increased crystallinity would be formed. This is generally in agreement with the experimental results. However, in the case of Triton X-114, the particles formed present the smallest size, most probably due to stronger interactions of this surfactant with the precursor molecules, which affect the morphology and crystallinity of the formed solids.6
The advantages of using non-ionic reverse micelles in the synthesis of nanoporous titania include the use of the droplets as reaction vessels, the size of which can, to some extent, be regulated by the use of the surfactant employed. The use of reverse micelles provides a means of keeping apart the reagents for the synthesis of titanium oxide and for controlling the rate of reaction. Further, this helps control the properties of the porous product, and limits the extent of aggregation. Further, the use of sol medium for the synthesis leads to a homogeneous mixing of the titanium oxide precursors.
A comparison of different synthetic methods for the synthesis of mesoporous TiO2 materials is presented in Table 4.
| Method | Temperature condition (°C) | Surface area (m2 g−1) | Particle size (nm) | References |
|---|---|---|---|---|
| TiO2 TrX-100 cyc | 400 | 182.2 | 6.31 | — |
| TiO2 TrX-114 cyc | 400 | 199.3 | 5.89 | — |
| TiO2 TrX-45 cyc | 400 | 146.3 | 6.3 | — |
| Cyclohexane/Triton X-114/water/Ti(OC3H7)4 = 11/1/1/1 (volume ratio TrX-114/cyclohexane = 0.49) | 400 | 139 | 6.3 | Matějová et al., 2010 (ref. 55) |
| TiO2 film TiCl4/Triton X-100/water | ∼400 | 44.6 | 60 | Al-Omair et al., 2014 (ref. 56) |
| RM-TiO2: cyclohexane/Triton X-114/water/Ti(OC3H7)4 = 11/1/1/1 24 h gel | 400 | 48 | 12 | Rajalakshmi et al., 2012 (ref. 57) |
| Sol–gel: cyclohexane/Triton X-114/water/Ti(IV) n-butoxide = 11/1/1/1 (volume ratio TrX-114/cyclohexane = 0.49) | 400 | 106 | 6 | Kočí et al., 2009 (ref. 58) |
Conclusions
From the discussion above, we can reach the following conclusions. The use of different Triton-X surfactants with different tail lengths can significantly affect and accordingly adjust the surface properties of TiO2 solids. In general, it has been found that increasing the tail length results in larger titania particles with increased crystallinity and higher thermal stability. The matrix Triton-X stabilizes the anatase structure by hindering the phase transformation from anatase to rutile, which is started at T > 700 °C. In the case of a medial length of polar surfactant tail, i.e. in the case of Triton X-114, it rather seems that the certain length favours a better penetration and interaction with the precursors oligomers, resulting in the formation of solids with improved textural characteristics. The effects are corroborated by a large spectrum of porous solids characterisation methods, such as N2 adsorption, XRD, DRUV-Vis and FTIR. The Triton-X reverse microemulsions could be identified as ideal micro-reactors for the synthesis of solids with tuneable and defined porous and morphology.Conflicts of interest
There are no conflicts to declare.Acknowledgements
We thank Professor Ioannis Giapintzakis and Dr Elli Symeou and Dr Ioanna Savva for providing access to SEM facilities and assistance with measurements (Department of Mechanical & Manufacturing Engineering at University of Cyprus). Also, we thank Professor Ioannis Pashalidis for providing access to the UV-Vis absorption, ATR-FTIR and DRUV-Vis solid state facilities.References
- I. H. Chowdhury, P. Bose and M. K. Naskar, J. Alloys Compd., 2016, 668, 56–64 CrossRef.
- S. Patra, C. Andriamiadamanana, M. Tulodziecki, C. Davoisne, P. L. Taberna and F. Sauvage, Sci. Rep., 2016, 6, 1–7 CrossRef PubMed.
- N. M. Nursam, J. Z. Y. Tan, X. Wang, W. Li, F. Xia and R. A. Caruso, ChemistrySelect, 2016, 1, 4868–4878 CrossRef.
- J. L. Vivero-Escoto, Y. D. Chiang, K. C. W. Wu and Y. Yamauchi, Sci. Technol. Adv. Mater., 2012, 13, 1–9 CrossRef PubMed.
- X. Chen and S. S. Mao, Chem. Rev., 2007, 107, 2891–2959 CrossRef PubMed.
- A. Zielinska-Jurek, J. Reszczynska, E. Grabowska and A. Zaleska, Microemulsions - An Introduction to Properties and Applications, ed. R. Najjar, Rijeka, InTech., 2012, pp. 229–250 Search PubMed.
- S. M. Gupta and M. Tripathi, Cent. Eur. J. Chem., 2012, 10, 279–294 Search PubMed.
- A. Pucci and N. Pinna, Z. Naturforsch. B Chem. Sci., 2010, 65, 1015–1023 Search PubMed.
- J. Yu, L. Zhang, B. Cheng and Y. Su, J. Phys. Chem. C, 2007, 111, 10582–10589 CrossRef.
- J. Akilavasan, K. Wijeratne, H. Moutinho, M. Al-Jassim, A. R. M. Alamoud, R. M. G. Rajapakse and J. Bandara, J. Mater. Chem. A, 2013, 1, 5377–5385 RSC.
- W. N. Wang, I. W. Lenggoro, Y. Terashi, T. O. Kim and K. Okuyama, Mater. Sci. Eng., B, 2005, 123, 194–202 CrossRef.
- S. Chin, E. Park, M. Kim and J. Jurng, Powder Technol., 2010, 201, 171–176 CrossRef.
- H. E. Namin, H. Hashemipour and M. Ranjbar, Int. J. Mod. Phys. B, 2008, 22, 3210–3215 CrossRef.
- H. S. Hafez, Mater. Lett., 2009, 63, 1471–1474 CrossRef.
- C. Youping, S. Hongqi, J. Wanqin and X. Nanping, Chin. J. Chem. Eng., 2007, 15, 178–183 CrossRef.
- S. Yin, Q. Zhang, F. Saito and T. Sato, Chem. Lett., 2003, 32, 358–359 CrossRef.
- S. Rani, S. C. Roy, M. Paulose, O. K. Varghese, G. K. Mor, S. Kim, S. Yoriya, T. J. LaTempa and C. A. Grimes, Phys. Chem. Chem. Phys., 2010, 12, 2780–2800 RSC.
- S. Masson, P. Holliman, M. Kalaji and P. Kluson, J. Mater. Chem., 2009, 19, 3517–3522 RSC.
- L. Shi, C. Li, A. Chen, Y. Zhu and D. Fang, Mater. Chem. Phys., 2000, 66, 51–57 CrossRef.
- X. Wu, Q. Z. Jiang, Z. F. Ma, M. Fu and W. F. Shangguan, Solid State Commun., 2005, 136, 513–517 CrossRef.
- K. Yang, J. Zhu, J. Zhu, S. Huang, X. Zhu and G. Ma, Mater. Lett., 2003, 57, 4639–4642 CrossRef.
- B. K. Paul and S. P. Moulik, Curr. Sci., 2001, 80, 990–1001 Search PubMed.
- A. Bumajdad, J. Eastoe and A. Mathew, Adv. Colloid Interface Sci., 2009, 147–148, 56–66 CrossRef PubMed.
- J. Eastoe, M. J. Hollamby and L. Hudson, Adv. Colloid Interface Sci., 2006, 128–130, 5–15 CrossRef PubMed.
- N. Pal and A. Bhaumik, Adv. Colloid Interface Sci., 2013, 189, 21–41 CrossRef PubMed.
- L. H. Lee and W. C. Chen, Chem. Mater., 2001, 13, 1137–1142 CrossRef.
- M. A. Malik, M. Y. Wani and M. A. Hashim, Arabian J. Chem., 2012, 5, 397–417 CrossRef.
- S. N. Khadzhiev, K. M. Kadiev, G. P. Yampolskaya and M. K. Kadieva, Adv. Colloid Interface Sci., 2013, 197–198, 132–145 CrossRef PubMed.
- P. T. Tanev and T. J. Pinnavaia, Science, 1995, 267, 865–867 CrossRef PubMed.
- S. Jaiswal, R. Mondal, D. Paul and S. Mukherjee, Chem. Phys. Lett., 2016, 646, 18–24 CrossRef.
- M. Johnson, Mater. Methods, 2016, 3, 163 Search PubMed.
- O. Šolcová, L. Matějová, P. Klusoň, Z. Matěj, Z. Strýhal, J. Pavlík and T. Cajthaml, Sol-Gel Methods for Materials ProcessingSpringer Netherlands, 2008, pp. 441–446 Search PubMed.
- L. Matějová, Z. Matěj, R. Fajgar, T. Cajthaml and O. Šolcová, Mater. Res. Bull., 2012, 47, 3573–3579 CrossRef.
- E. Stathatos, P. Lianos, F. D. Monte, D. Levy and D. Tsiourvas, Langmuir, 1997, 13, 4295–4300 CrossRef.
- R. Inaba, T. Fukahori, M. Hamamoto and T. Ohno, J. Mol. Catal. A: Chem., 2006, 260, 247–254 CrossRef.
- S. Mahshid, M. S. Ghamsari, M. Askari, N. Afshar and S. Lahuti, Semicond. Phys., Quantum Electron. Optoelectron., 2006, 9, 65–68 Search PubMed.
- N. Uekawa, N. Endo, K. Ishii, T. Kojima and K. Kakegawa, J. Nanotechnol., 2012, 2012, 1–8 CrossRef.
- P. Kluson, P. Kacer, T. Cajthaml and M. Kalaji, Chem. Biochem. Eng., 2003, 17, 183–190 Search PubMed.
- A. L. Castro, M. R. Nunes, A. P. Carvalho, F. M. Costa and M. H. Florêncio, Solid State Sci., 2008, 10, 602–606 CrossRef.
- M. V. Swapna and K. R. Haridas, Chemist, 2015, 88, 1–6 Search PubMed.
- J. Dharma and A. Pisal, Perkin Elmer Application Notes, United Kingdom, 2009 Search PubMed.
- S. Bagheri, K. Shameli and S. B. A. Hamid, Journal of Chemistry, 2012, 2013, 1–5 CrossRef.
- D. Zhu and Z. A. Schelly, Langmuir, 1992, 8, 48–50 CrossRef.
- C. R. Theocharis, Multifunctional Mesoporous Inorganic Solids, Kluwer Academic Publishers, 1993, vol. 400, pp. 3–18 Search PubMed.
- K. S. W. Sing, Colloids Surf., A, 2001, 187–188, 3–9 CrossRef.
- E. P. Barrett, L. G. Joyner and P. P. Halenda, J. Am. Chem. Soc., 1951, 73, 373–380 CrossRef.
- N. A. Al-Omair, S. M. Reda and F. M. Al-Hajri, Adv. Mater. Phys. Chem., 2014, 4, 29–32 CrossRef.
- A. A. Belhekar, S. V. Awate and R. Anand, Catal. Commun., 2002, 3, 453–458 CrossRef.
- F. A. Deorsola and D. Vallauri, Powder Technol., 2009, 190, 304–309 CrossRef.
- T. Anukunprasert, C. Saiwan, E. D. Bartolomeo and E. Traversa, J. Electroceram., 2007, 18, 295–303 CrossRef.
- V. H. Castrejón-Sánchez, E. Camps and M. Camacho-López, Superficies Vacio, 2014, 27, 88–92 Search PubMed.
- M. Andersson, L. Österlund, S. Ljungström and A. Palmqvist, J. Phys. Chem. B, 2002, 106, 10674–10679 CrossRef.
- P. Kluson, P. Kacer, T. Cajthaml and M. Kalaji, J. Mater. Chem., 2001, 11, 644–651 RSC.
- M. E. Simonsen and E. G. Søgaard, J. Sol-Gel Sci. Technol., 2010, 53, 485–497 CrossRef.
- L. Matějová, T. Cajthaml, Z. Matěj, O. Benada, P. Klusoň and O. Šolcová, J. Supercrit. Fluids, 2010, 52, 215–221 CrossRef.
- N. A. Al-Omair, S. M. Reda and F. M. Al-Hajri, Adv. Mater. Phys. Chem., 2014, 4, 29–32 CrossRef.
- K. Rajalakshmi, V. Jeyalakshmi, K. R. Krishnamurthy and B. Viswanathan, Indian J. Chem., Sect. A: Inorg., Bio-inorg., Phys., Theor. Anal. Chem., 2012, 51, 411–419 Search PubMed.
- K. Kočí, L. Obalová, L. Matějová, D. Plachá, Z. Lacný, J. Jirkovský and O. Šolcová, Appl. Catal., B, 2009, 89, 494–502 CrossRef.
Footnote |
| † Electronic supplementary information (ESI) available: Textural properties of titania prepared in the presence of Triton-X. See DOI: 10.1039/c8ra05495a |
| This journal is © The Royal Society of Chemistry 2018 |

