 Open Access Article
Electrolyte and pH-sensitive amphiphilic alginate: synthesis, self-assembly and controlled release of acetamiprid†
Yiyuan Tang ,
Kai Chen,
Jiacheng Li
 *,
Yuhong Feng*,
Gaobo Yu,
Longzheng Wang,
Xinyu Zhao,
Yang Peng and
Quan Zhang
Key Laboratory of Advanced Materials of Tropical Island Resources, Ministry of Education, College of Materials and Chemical Engineering, Hainan University, 58 Renmin Road, Haikou 570228, Hainan Province, China. E-mail: hn136.631@163.com; lijiacheng@hainu.edu.cn; ljcfyh@263.net; Tel: +86-13976105128
First published on 18th September 2018
Abstract
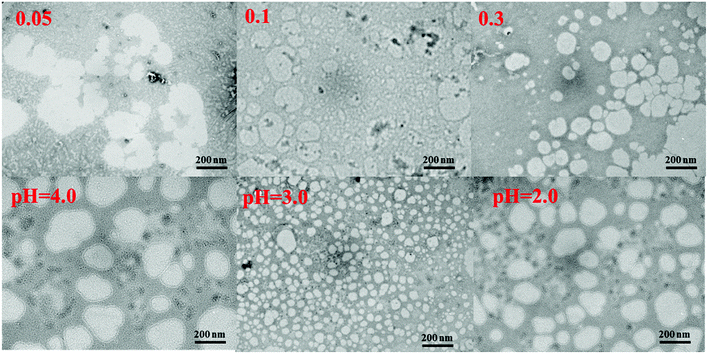
In this study, a pH-responsive amphiphilic alginate (Ugi-Alg) was synthesized via Ugi reaction without using a catalyst. The structure of Ugi-Alg was confirmed by FT-IR and 1H NMR spectroscopy. Amphiphilic alginate can form micelles in an aqueous medium due to it's amphiphilic nature.. The impacts of Na+ concentration and pH on the micelle size were characterized by dynamic light scattering (DLS) and transmission electron microscopy (TEM). The dynamic light scattering observations showed that micelle size increases with the decrease in Na+ concentration in aqueous solution. However, the micelle size decreases first and then increases as the pH value decreases from 5.3 to 2.0. Transmission electron microscopy confirmed that the mean size of micelles is 30–200 nm. In addition, a model hydrophobic pesticide (acetamiprid) was loaded in the micelles. The encapsulation efficiency and release behavior of micelles were studied, which could be controlled by Na+ concentration and pH. The results indicated that encapsulation efficiency of acetamiprid increases from 55% to 96% due to the increase in Na+ concentration from 0.01 M to 0.3 M. Moreover, with the decrease in pH from 5.3 to 2.0, encapsulation efficiency increases from 55% to 80%. Furthermore, the data of acetamiprid release kinetics could be well-fitted by the Weibull model.
1. Introduction
Pesticide use accounted for about 32 billion US$ by 2007,1 and is expected to increase 2.7 times by 2050.2 However, more than 90% of the applied conventional pesticides are either lost in the environment or never reach the target area required for pest control at the exact time and in precise quantities due to the nonspecific and periodic application of active agents.3 The sprayed pesticide flows away from the plants to nearby land or rivers with storm water. Therefore, higher concentrations of pesticides have been used to achieve the desire effect of pest control, which consequently led to severe environmental damage. Misuse of pesticides will not only increase the costs, but also cause environmental pollution, enhancement of pest resistance and biodiversity reduction.4 To overcome these drawbacks, increasing attention is being paid to the application of responsive polymer micelles in agriculture to reduce the usage of pesticides. Responsive polymer micelles have significant potential in improving the performance of pesticides by increasing their efficiency and safety and making them environmentally less harmful.5,6In recent years, site-specific delivery has been extensively studied in the realm of medicine, but less attention has been given to the application of these adaptive materials in agriculture.7 Phloem is the vascular tissue of plants, and plays the critical role of carrying nutrients and photosynthates. However, many plant pathogens can reside within the phloem (i.e., phloem-limited pathogens), which are parasitic and introduce deadly crop diseases (i.e., citrus Huanglong disease).8 Moreover, while most plant tissues exist in a slightly acidic environment, phloem maintains higher, slightly alkaline pH.9 Therefore, we can design polymeric micelles to meet the specific delivery needs of the phloem. These micelles must be (i) responsive to basic pH found in the phloem, (ii) small enough to enter the plant cell through cell wall junctions, and (iii) biodegradable to reduce the extent of accumulation over time. Additionally, these micelles would ideally be capable of encapsulating guest compounds, including hydrophobic and hydrophilic small molecules or drugs.10
Alginate as a polymer material can be extracted from brown algae and features biodegradability, biocompatibility, hydrophilicity, and non-immunogenicity. Therefore, alginate had been extensively investigated in the food industry, environmental engineering, drug delivery, and tissue engineering.11–14 However, the application of sodium alginate in hydrophobic drugs has been restricted, mainly due to its strong hydrophilicity. For example, as control release material, the capacity of sodium alginate is deficient, which easily leads to burst release of the encapsulated drug.15 Moreover, as a mucosal adhesion agent the adhesion force sodium alginate due to non-hydrophobic interactions is small.16 Alginate can be modified by hydrophobic groups via Ugi reactions to improve its performance.17 The modified alginate containing hydrophilic and hydrophobic blocks demonstrated self-assembly in aqueous solution to form micelles with a hydrophilic shell and a hydrophobic core.18 When the amphiphilic polymer is exposed to hydrophobic solvents, it can form the opposite orientation, with the hydrophobic parts on the outside and hydrophilic parts on the inside.19 Many external stimuli can change the disassembly or morphology of micellar aggregates.20 Amphiphilicity combined with pH-response of modified alginate makes it a more promising micellar carrier.
Herein, we synthesized amphiphilic alginate with reference to a previous study.21 The amphiphilic nature of alginate allows it to self-assemble into micelles, and was used to develop pH-responsive micelles for pesticide delivery.22 Acetamiprid, a model hydrophobic drug, was encapsulated in the micelles. The encapsulation stability and pH-triggered release behavior were evaluated. We aimed to develop a novel pH-responsive delivery system to meet the specific delivery needs of the phloem.
2. Materials and methods
2.1 Materials
Sodium alginate (NaAlg), formaldehyde, octylamine, hydrochloric acid, sodium hydroxide, ethanol, NaCl, and pyrene (analytical grade) were all purchased from Aladdin Chemical Reagent Co., Ltd. (Shanghai, China). Cyclohexyl isocyanide (analytical grade) was purchased from J & K Technology Co. Ltd (Beijing, China). In addition, molecular masses of NaAlg (Mw = 613![[thin space (1/6-em)]](https://www.rsc.org/images/entities/char_2009.gif) 308 and Mn = 394
308 and Mn = 394![[thin space (1/6-em)]](https://www.rsc.org/images/entities/char_2009.gif) 342) were assessed by gel permeation chromatography.
342) were assessed by gel permeation chromatography.
2.2 Synthesis and characterization of Ugi-Alg
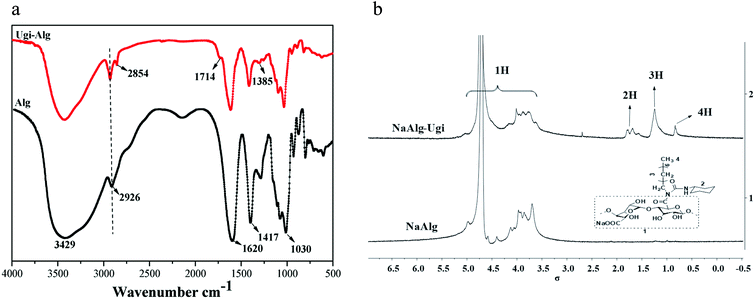
The synthesis of Ugi-Alg was performed based on a previous study,21 as shown in Scheme 1. In this reaction, formaldehyde and octylamine are dehydrated to form an imine. Then, the imine and cyclohexyl isocyanide reacts to form a nitrile sulfonium ion, and the carboxylic acid ion of the alginate acid attacks the carbon atom of the isonitrile to generate the intermediate. Finally, a Mumm rearrangement occurs with an acyl transferring into the bis-amide.23 The detailed processes are as follows. First, an unmodified alginate (2 g, 9.25 mmol) was dissolved in 80 mL of water at 35 °C. The solution was then gently stirred overnight to achieve homogeneity. Second, the pH of the solution was adjusted to 3.6 with the addition of 0.5 M HCl. Third, formaldehyde (0.05 g, 1.67 mmol), octylamine (0.17 g, 1.32 mmol), and cyclohexyl isocyanide (0.2 g, 1.83 mmol) were successively added to the solution. The solution was then stirred at 35 °C for 24 h. Finally, the reaction mixture was diluted to 0.7 wt%, purified by dialyzing it against distilled water for 3 days, and subsequently freeze-dried. The chemical structure of Ugi-Alg was confirmed by 1H NMR (D2O, 25 °C) using a 400 MHz Bruker nuclear magnetic resonance spectrometer. The FTIR spectra of the sample were recorded on a Tensor27 Fourier transform infrared spectrometer. The FTIR spectra and 1H NMR spectra are shown in Fig. 1. The thermogravimetric analysis (TGA) results of Ugi-Alg are shown in Fig. S1.†2.3 Preparation of micelles
Ugi-Alg solutions were prepared by dissolving 5 mg of Ugi-Alg in 10 mL deionized water. They were stirred by a magnetic stirrer for 24 h. Then, the pH (2–5.3) and NaCl concentrations (0.01–0.3 M) of the solutions were changed. Consequently, the micelle solutions were obtained.2.4 Characterization of Ugi-Alg micelles
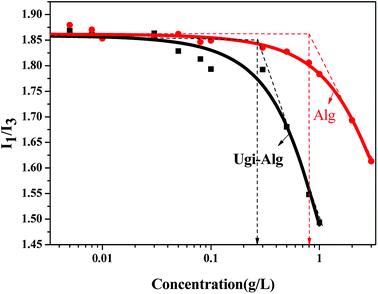
The critical micelle concentration (CMC) of Ugi-Alg in aqueous media was determined using a fluorescence spectrophotometer. Fluorescence spectrophotometry was performed on a Hitachi F7000 fluorescence spectrophotometer using pyrene as the fluorescence probe. The excitation wavelength was set to 335 nm and the slit width was 2.5 nm. The fluorescence emission spectra were recorded in the range of 335 nm to 600 nm. All tests were performed at 25 °C. A 10 μL aliquot of 1.0 × 10⁻³ M pyrene was prepared in ethanol solvent and then added into a test tube. Then, ethanol was removed with the aid of nitrogen blowing. Subsequently, 5 g L−1 Ugi-Alg was added into the test tube with solutions of varying Ugi-Alg concentrations (0.001 g L−1 to 3.0 g L−1). All sample solutions were shaken in a water bath overnight at room temperature to ensure that pyrene was completely entrapped in the hydrophobic micro-domains.The zeta potential and z-average diameters of the Ugi-Alg micelles were measured by DLS with a Zetasizer Nano ZS90 (Malvern, UK). Ugi-Alg (1.0 g L−1) was added into the test tube, and solutions of varying pH (2–5.3) and NaCl concentrations (0.01–0.3 M) were prepared. All sample solutions were shaken in a water bath overnight at room temperature. The analyzer adopts a He–Ne light source with 10 mW power, wavelength of 633 nm, scattering intensity measuring angle of 90°, and measuring temperature of 25 °C with an accuracy of ±0.1 °C.
The morphology of the Ugi-Alg micelles were observed using TEM (JEOL JEM-2010, Japan) at an acceleration voltage of 200 kV. A few drops of micelle solution were added on a carbon-coated copper grid. Negative staining was then performed by exposing the grid to 2 wt% tungsten–phosphoric acid solution, which was dried at room temperature. The average size of the micelles was calculated by Nano Measurer 1.2.
2.5 Preparation of acetamiprid-drug micelles
The preparation of acetamiprid/Ugi-Alg micelles is briefly described as follows. First, 5.0 g L−1 Ugi-Alg solutions was added to 1 mg mL−1 acetamiprid solutions (9![[thin space (1/6-em)]](https://www.rsc.org/images/entities/char_2009.gif) :
:![[thin space (1/6-em)]](https://www.rsc.org/images/entities/char_2009.gif) 1, v/v). Then, they were mixed by a magnetic stirrer for 24 h. Then, varying pH (2–5.3) and NaCl concentrations (0.01–0.3 M) of the solutions were prepared. Consequently, acetamiprid-drug micelles were obtained.
1, v/v). Then, they were mixed by a magnetic stirrer for 24 h. Then, varying pH (2–5.3) and NaCl concentrations (0.01–0.3 M) of the solutions were prepared. Consequently, acetamiprid-drug micelles were obtained.
To determine the encapsulation efficiency (EE), 2 mL supernatant of the acetamiprid-loaded micelle solution was centrifuged at a high speed (10![[thin space (1/6-em)]](https://www.rsc.org/images/entities/char_2009.gif) 000 rpm) for 20 min and washed three times with a small amount of deionized water to remove the free acetamiprid. The concentrations of acetamiprid in the decanted aqueous solution and three times-washed solutions were analyzed by Waters e2695 high performance liquid chromatography (HPLC). The chromatographic conditions were as follows: FID detector, HP Hypersil C18 column (250 mm × 4.6 mm × 0.005 mm), mobile phase: methanol/water/acetonitrile (15
000 rpm) for 20 min and washed three times with a small amount of deionized water to remove the free acetamiprid. The concentrations of acetamiprid in the decanted aqueous solution and three times-washed solutions were analyzed by Waters e2695 high performance liquid chromatography (HPLC). The chromatographic conditions were as follows: FID detector, HP Hypersil C18 column (250 mm × 4.6 mm × 0.005 mm), mobile phase: methanol/water/acetonitrile (15![[thin space (1/6-em)]](https://www.rsc.org/images/entities/char_2009.gif) :
:![[thin space (1/6-em)]](https://www.rsc.org/images/entities/char_2009.gif) 70
70![[thin space (1/6-em)]](https://www.rsc.org/images/entities/char_2009.gif) :
:![[thin space (1/6-em)]](https://www.rsc.org/images/entities/char_2009.gif) 15, v/v/v), flow rate: 1 mL min−1, column temperature: 40 °C. EE was calculated based on the following formula:
15, v/v/v), flow rate: 1 mL min−1, column temperature: 40 °C. EE was calculated based on the following formula:
 | (1) |
2.6 Controlled-release of the acetamiprid-loaded micelles
For the release experiment of acetamiprid from the micelles, 8 mL of the above micelles was put into a dialysis bag (cutoff molecular weight: 1000); then, the dialysis bag was introduced into a beaker containing 400 mL of distilled water. At predetermined time intervals (such as 10 min, 20 min, 30 min or 1 h, and 3 h), water was collected from the beaker and then, the dialysis bag was put into fresh 400 mL of distilled water. The acetamiprid concentration was determined by the abovementioned method. All studies were repeated two times and mean values were obtained.3. Results and discussion
3.1 Synthesis of Ugi-Alg micelles
Sodium alginate was hydrophobically modified via the Ugi reaction. The FT-IR spectra of Alg and Ugi-Alg are presented in Fig. 1(a). From the FT-IR spectrum of Alg (Fig. 1(a)), the broad and strong peak at 3429.15 cm−1 is assigned to O–H stretching vibrations. It can be observed that a small peak appearing at 2926.48 cm−1 is attributed to C–H stretching vibrations of the saccharide structure. The characteristic peaks at 1620 and 1417 cm−1 are assigned to asymmetric and symmetric stretching vibrations of carboxylic acid (COO−), respectively. After modification, the additional weak peaks observed at 2854 and 1385.14 cm−1 correspond to –CH2– and –CH3– bending vibrations of octyl and cyclohexyl, indicating the successful modification of NaAlg.21,23 The weak peak at 1714 cm−1 may correspond to the C![[double bond, length as m-dash]](https://www.rsc.org/images/entities/char_e001.gif) O stretching vibrations of N-acylurea.
O stretching vibrations of N-acylurea.
The 1H NMR spectra of NaAlg and Ugi-Alg are presented in Fig. 1(b). The proton peaks ranging from 5.0 to 3.5 ppm are ascribed to the H of native alginate chains, including δ (ppm) = 5.08 (C1H, G unit) and 4.68 (C1H, M unit). Comparing the 1H NMR spectrum of Alg with that of Ugi-Alg, some new proton peaks appear in the δ range from 2.0 to 0.5 ppm because of the presence of new functional groups linked to alginate. The proton assignments of the new functional groups are listed as follows: δ (ppm): 1.8–1.5 (t, 11H, C6H11 of cyclohexyl), 1.2 (s, 12H, (CH2)6 of octyl), 0.8 (s, 3H, CH3 of octyl). According to these results, the conclusion can be drawn that Ugi-Alg was successfully synthesized.21,24
3.2 Assessment of Ugi-Alg micelles
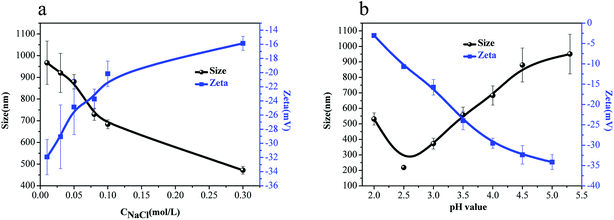
Fig. 3(b) shows the effect of solution pH on zeta potential and z-average diameters of the Ugi-Alg micelles. With the decrease in pH value from 5.3 to 2.5, the micelles size decreased from 950 ± 45 nm to 218 ± 33 nm. Ngai et al.30 reported that with the decrease in pH, an increasing number of anionic –COO− within the micelles were protonated to carboxylic groups (–COOH), resulting in a decrease in the internal electrostatic repulsion within the micelles. When the attractive forces due to hydrogen bonding or hydrophobic interactions overcomes the repulsion, the Ugi-Alg chains are curled, resulting in decreased micelles size. However, when the pH value decreased to 2.0, the micelles size increased, which may be because H+ shielded the charge on the micelles' surface. As a result, the attractive forces resulting from hydrogen bonding or hydrophobic interactions overcome the inter-micelle repulsion, resulting in aggregation between micelles. An illustration of the Ugi-Alg aggregation in aqueous solution of different NaCl concentrations and pH values is exhibited in Scheme 2. The phenomenon was illustrated for the zeta potential of micelles (Fig. 3(b)).
 | (2) |
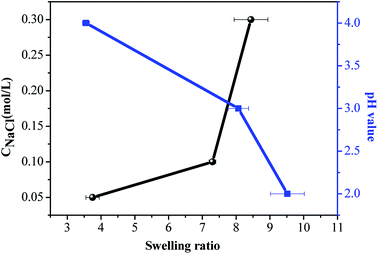
As shown in Fig. 5, with the increase in Na+ concentration, the swelling ratio increased, indicating that more the Na+ concentration, the stronger would be the hydrogen bonding and hydrophobic interactions which will overcome the repulsion and form smaller micelles. The swelling ratio with varying pH values had similar trends with varying Na+ concentration.
3.3 Controlled drug release of micelles
Acetamiprid was introduced for agricultural control of sucking-type insects on leafy vegetables, fruits and tea trees in the early 90s. However, acetamiprid has demonstrated high toxicity, causing potential risk to humans who are exposed to the contaminated environment.32 Therefore, in our study, for minimizing this risk, we encapsulated acetamiprid with the appropriate polymers. The benefits of micelles include improvement of long-time efficiency and a controlled release of acetamiprid in the phloem.The effects of different pH and Na+ concentrations in solution on the encapsulation efficiency of acetamiprid were evaluated, as shown in Table 1. For the 0.01 M NaCl solution, varying the pH value from 5.3 to 2.0 caused a significant increase in encapsulation efficiency of acetamiprid from 55% to 80%. Under the same pH solution, increasing the Na+ concentration from 0.01 M to 0.3 M resulted in the distinct increase in encapsulation efficiency of acetamiprid from 55% to 96%. The most likely reason for this is that with the decrease in pH or increase in Na+ concentration, the attractive forces due to hydrogen bonding or hydrophobic interactions overcome the repulsion and create a microenvironment, resulting in the significantly enhanced encapsulation efficiency of acetamiprid.33
| pH value | NaCl concentration (M) | Encapsulation efficiency (%) |
|---|---|---|
| 2.0 | 0.01 | 80% |
| 3.0 | 0.01 | 70% |
| 4.0 | 0.01 | 57% |
| 5.3 | 0.01 | 55% |
| 5.3 | 0.1 | 67% |
| 5.3 | 0.3 | 96% |
Release profiles of acetamiprid from micelles were studied, as shown in Fig. 6. In general, within the first 100 min, a rapid drug release process occurred; then, the release rate became slower and displayed prolonged behavior. Interestingly, cumulative release of acetamiprid reached 80% in pH = 5.3 solution at 100 min. The reason may be that non-encapsulated acetamiprid first releases quickly from the dialysis membrane. Then, the encapsulated acetamiprid releases slowly, due to which the release rate becomes slower and displays prolonged behavior. As shown in Fig. 6(a), with the increase in the pH from 2.0 to 5.3, the release rate also increased. However, the release rate decreased as the Na+ concentration increased. This is explained on the basis of the fact that because of the decrease in pH or increase in Na+ concentration, resulting in the increasing strength of hydrogen bonding and hydrophobic interaction, swelling rate of micelles decreases (Fig. 5), leading to slower release rate.
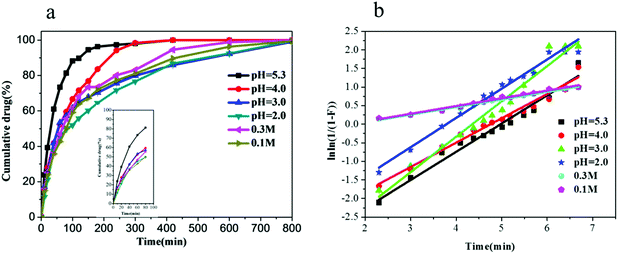 | ||
| Fig. 6 (a) Release profiles of acetamiprid in various pH values and Na+ solutions; (b) fitting curves of Weibull model in the various pH values and Na+ concentration solutions. | ||
To investigate the effect of pH and Na+ concentration on the mechanism of acetamiprid release from micelles, a classical model, known as the Weibull model31 was used:
ln(ln(1/(1 − F))) = b![[thin space (1/6-em)]](https://www.rsc.org/images/entities/char_2009.gif) ln ln![[thin space (1/6-em)]](https://www.rsc.org/images/entities/char_2009.gif) t + ln t + ln![[thin space (1/6-em)]](https://www.rsc.org/images/entities/char_2009.gif) a a
| (3) |
Papadopoulou et al.34 reported that values of b lower than 0.75 denote that the release follows Fickian diffusion either in Euclidian (0.69 < b < 0.75) or in fractal space (b < 0.69). Moreover, for Fickian diffusion the increase in b reflects the decrease in the medium disorder. Values of b in the range of 0.75–1.0 indicate that the release is suitable for a combined mechanism (Fickian diffusion and Case II transport). The specific case when b = 1 is compatible with first-order release, where the concentration gradient in the dissolution medium drives the rate of release. Finally, when b > 1, a complex mechanism governs the release process. In fact, the release rate initially increases nonlinearly up to the inflection point and then decreases asymptotically.
By applying least-squares method to release data, the fitting curves were obtained (Fig. 6(b)), and the values of R2, b and the mechanism were estimated (Table 2). As can be seen from Table 2, R2 of all samples was about 0.97, indicating that the samples are suitable for the Weibull model. For 0.01 M Na+ concentration, as the pH value is varied from 2.0 to 3.0 to 5.3, the value of b is 0.7615, 0.6554, and 0.7879, respectively, indicating that the mechanism of release changes from combined mechanism to Fickian and again to combined mechanism. When pH = 5.3, the values of b were found to vary from 0.2042 to 0.2088 when the Na+ concentration varied from 0.1 M to 0.3 M, respectively. This indicates that under such circumstances, the release of acetamiprid followed the Fickian mechanism.
| pH value | NaCl concentration (M) | Weibull model | ||
|---|---|---|---|---|
| R2 | B | Mechanism | ||
| 2.0 | 0.01 | 0.9723 | 0.7615 ± 0.1118 | Combined mechanism (Fickian and case II transport) |
| 3.0 | 0.01 | 0.9758 | 0.6554 ± 0.1087 | Fickian diffusional mechanism |
| 4.0 | 0.01 | 0.9640 | 0.9518 ± 0.0289 | Combined mechanism (Fickian and case II transport) |
| 5.3 | 0.01 | 0.9795 | 0.7879 ± 0.0838 | Combined mechanism (Fickian and case II transport) |
| 5.3 | 0.1 | 0.9894 | 0.2042 ± 0.0030 | Fickian diffusional mechanism |
| 5.3 | 0.3 | 0.9832 | 0.2088 ± 0.0030 | Fickian diffusional mechanism |
4. Conclusion
In this study, amphiphilic alginate (Ugi-Alg) was synthesized via the Ugi reaction without the aid of a catalyst and with inherent high atom economy and chemical yield. The structure of Ugi-Alg was confirmed by TGA, FT-IR and 1H NMR spectrometry analyses. A series of experimental analyses (fluorescence spectroscopy, DLS and TEM) indicated that Ugi-Alg can self-assemble in water. Moreover, the size of micelles first decreased and then increased as the pH decreased from 5.3 to 2.0. With the increase in Na+ concentration, the micelles size decreased. Interestingly, a high encapsulation efficiency of acetamiprid in the 0.3 M Na+ concentration and pH = 5.3 solution was achieved, reaching up 96.4%. The release behavior of acetamiprid from the micelles could be controlled by changing the Na+ concentration and pH solution. The mechanism of acetamiprid release was found to vary from combined to Fickian and again to combined mechanism when the pH varied from 2.0 to 5.3. When the Na+ concentration was varied from 0.1 to 0.3 M, all systems exhibited Fickian mechanism. Consequently, this research implied that our strategy would potentially be an effective method to suit the specific delivery needs of the phloem.Conflicts of interest
There are no conflicts to declare.Acknowledgements
We gratefully acknowledge the financial support from the Key Projects in the Hainan provincial Science & Technology Program (ZDYF2018061, ZDYF2018107), the National Natural Science Foundation of China (21566009, 21706045), and the Natural Science Foundation of Hainan Province (217021), and the Key Laboratory of Water Environment Pollution Treatment & Resource of Hainan Province.References
- S. Sharma, S. Singh, A. K. Ganguli and V. Shanmugam, Carbon, 2017, 115, 781–790 CrossRef.
- D. Tilman, J. Fargione, B. Wolff, C. D'Antonio, A. Dobson, R. Howarth, D. Schindler, W. H. Schlesinger, D. Simberloff and D. Swackhamer, Science, 2001, 292, 281–284 CrossRef PubMed.
- L. D. Cao, H. R. Zhang, C. Cao, J. K. Zhang, F. M. Li and Q. L. Huang, Nanomaterials, 2016, 6, 126 CrossRef PubMed.
- D. Tilman, K. G. Cassman, P. A. Matson, R. Naylor and S. Polasky, Nature, 2002, 418(6898), 671 CrossRef PubMed.
- C. Sun, K. Shu, W. Wang, Z. Ye, T. Liu and Y. Gao, Int. J. Pharm., 2014, 463, 108–114 CrossRef PubMed.
- R. Tasmin, Y. Shimasaki, M. Tsuyama, X. Qiu, F. Khalil and N. Okino, Environ. Sci. Pollut. Res., 2014, 21, 1064–1070 CrossRef PubMed.
- S. J. Sonawane, R. S. Kalhapure and T. Govender, Eur. J. Pharm. Sci., 2017, 99, 45–65 CrossRef PubMed.
- J. M. Bove and M. Garnier, Plant Sci., 2002, 163, 1083–1098 CrossRef.
- J. W. Torpey, E. A. Komives, J. Kehr and J. I. Schroeder, Plant J., 2008, 54, 249–259 CrossRef PubMed.
- M. R. Hill, E. J. MacKrell, C. P. Forsthoefel, S. P. Jensen, M. S. Chen, G. A. Moore, Z. L. He and B. S. Sumerlin, Biomacromolecules, 2015, 16, 1276–1282 CrossRef PubMed.
- G. Lawrie, I. Keen, B. Drew, A. Chandler-Temple, L. Rintoul and P. Fredericks, Biomacromolecules, 2007, 8, 2533–2541 CrossRef PubMed.
- Q. Li, C. G. Liu, Z. H. Huang and F. F. Xue, J. Agric. Food Chem., 2010, 59, 1962–1967 CrossRef PubMed.
- P. Gurikov, S. Raman, D. Weinrich, M. Fricke and I. Smirnova, RSC Adv., 2015, 11, 7812–7818 RSC.
- L. Yang, J. Guo, J. Wu and Y. Yang, RSC Adv., 2017, 7(80), 50626–50633 RSC.
- B. L. Yao, Q. Li, X. Ma and C. H. Ni, Chin. J. Spectrosc. Lab., 2009, 26, 119–121 Search PubMed.
- L. F. Zhang, S. L. Song, H. Liang and A. G. Ji, Chin. J. Biochem. Pharm., 2009, 30, 281–284 Search PubMed.
- L. N. Hassani, F. Hendra and K. Bouchemal, Auto-associative amphiphilic polysaccharides as drug delivery systems, Drug Discovery Today, 2012, 17(11–12), 608–614 CrossRef PubMed.
- S. Menon, R. Thekkayil, S. Varghese and S. Das, J. Polym. Sci., Part A: Polym. Chem., 2011, 49(23), 5063–5073 CrossRef.
- R. Trivedi and U. B. Kompella, Nanomedicine, 2010, 5, 485–505 CrossRef PubMed.
- J. Dong, Y. Wang, J. Zhang, H. Yang and G. Wang, Soft Matter, 2013, 9, 370–373 RSC.
- H. Q. Yan, X. Q. Chen, J. C. Li, Y. H. Feng, Z. F. Shi, X. H. Wang and Q. Lin, Carbohydr. Polym., 2016, 136, 757–763 CrossRef PubMed.
- S. Chen, F. Jiang, Z. Cao and G. Wang, Chem. Commun., 2015, 51, 12633–12636 RSC.
- M. S. Islam and M. R. Karim, Colloids Surf., A, 2010, 366, 135–140 CrossRef.
- K. Cho, X. Wang, Z. Chen and D. Shin, Clin. Cancer Res., 2008, 14, 1310–1316 CrossRef PubMed.
- B. Y. Ren, Y. M. Gao, L. Lu, X. X. Liu and Z. Tong, Carbohydr. Polym., 2006, 66, 266–273 CrossRef.
- W. L. Liu, W. Liu, A. Ye, S. F. Peng, F. Q. Wei, C. M. Liu and J. Z. Han, Food Chem., 2016, 196, 396–404 CrossRef PubMed.
- H. V. Sæther, H. K. Holme, G. Maurstad, O. Smidsrød and B. T. Stokke, Carbohydr. Polym., 2008, 74, 813–821 CrossRef.
- T. Schmelz, U. Lesmes, J. Weiss and D. J. McClements, Food Hydrocolloids, 2011, 25, 1181–1189 CrossRef.
- X. N. Shi, W. B. Wang and A. Q. Wang, Carbohydr. Polym., 2013, 94, 449–455 CrossRef PubMed.
- H. A. Ngai and S. H. Behrens, Macromolecules, 2006, 39, 8171–8177 CrossRef.
- J. S. Yang, Q. Q. Zhou and W. He, Carbohydr. Polym., 2013, 92, 223–227 CrossRef PubMed.
- R. Rapini, A. Cincinelli and G. Marrazza, Talanta, 2016, 161, 15–21 CrossRef PubMed.
- H. Wei, S. X. Cheng, X. Z. Zhang and R. X. Zhuo, Prog. Polym. Sci., 2009, 34, 893–910 CrossRef.
- V. Papadopoulou, K. Kosmidis, M. Vlachou and P. Macheras, Int. J. Pharm., 2006, 309, 44–50 CrossRef PubMed.
Footnote |
| † Electronic supplementary information (ESI) available. See DOI: 10.1039/c8ra05503c |
| This journal is © The Royal Society of Chemistry 2018 |


