 Open Access Article
A kinetic model for in situ coking denitrification of heavy oil with high nitrogen content based on starch using a structure-oriented lumping method
Zhongwen Hea,
Hui Xua,
Changlu Zhoua,
Zhong Xin *a,
Jichang Liub and
Benxian Shenb
aShanghai Key Laboratory of Multiphase Materials Chemical Engineering, School of Chemical Engineering, East China University of Science and Technology, Shanghai 200237, China. E-mail: xzh@ecust.edu.cn
bSchool of Chemical Engineering, East China University of Science and Technology, Shanghai 200237, China
First published on 21st September 2018
Abstract
In this study, in situ coking denitrification technology was utilized to simplify the entire process by adding an appropriate quantity of denitrification agents to the delayed-coking tower without any further follow-up denitrification process. The effect of starch as the denitrification agent in the in situ coking denitrification process was studied. The distribution of oil products was characterized by GC of simulated distillation. The results indicated that the nitrogen compounds present in heavy oil transformed to coke via in situ coking conversion by reacting with starch. A molecular-level process model for the coking process was developed. Product distribution on the complex reaction network could be described accurately by the model.
1 Introduction
The past decade has witnessed the deterioration of crude oil's quality with the increase in demand for the light-fuel products. Delayed coking technology is a very well-rounded process for vacuum residuum and processing in the refining industry, which occupies more than 30% capacity of the processing ability of world crude oil.1 The major product of delayed coking, coker gas oil (CGO), is an important feedstock that is widely used in high-value distillates. Therefore, CGO has attracted attention from oil refineries due to its increasing output and hardness to upgrade.2 However, nitrogen compounds present in the CGO need to be removed to produce clean fuels that meet the requirement of environmentally safe processing for environmental safety.3Various techniques have developed for the denitrification of petroleum products including complex extraction,4 absorption,5 organic or inorganic acid washing,6 and hydro-denitrification,7 which exhibit significant denitrification effects. In view of the high capital and operational costs of these techniques, in this study, in situ coking denitrification technology was utilized to simplify the entire process by adding an appropriate quantity of denitrification agent to the delayed-coking tower without any further follow-up denitrification process. The proportion of basic nitrogen compounds and total nitrogen compounds in product oil is significantly decreased. More specifically, product distribution and the corresponding molecular compositions were investigated in order to improve the quality of product oil. Moreover, rational optimization of the equipment and operating conditions were performed with the guidance of reaction kinetic models.
Lumping methods are commonly used to build a kinetic model according to the database.8–10 In 1992, Quann and Jaffe proposed the concept of structure-oriented lumping (SOL), which can describe the composition, reaction, and properties of a complex hydrocarbon mixture.11,12 A composition matrix was established to describe the structures and contents of the molecules, and reaction rules could be used to comply the reaction behaviour of the complex reaction based on this method. Additionally, the SOL method has been extended continually, which makes it suitable to build a kinetic model for complex systems.13–15
In this paper, the process conditions of in situ coking denitrification were optimized to achieve the best performance. A molecular level process model for in situ coking denitrification technology was developed to rationally control the product distribution by the SOL reaction kinetic model. Product distribution on the complex reaction network could be described accurately by the model, which is beneficial to reveal the effects of the denitrification agent on the coking process.
2 Experimental
2.1 Materials
The chemicals used were heavy oil with total nitrogen content of ∼5700 ppm and basic nitrogen content of ∼1900 ppm (China National Offshore Oil Corporation, China), benzene (99% purity, Shanghai Lingfeng Chemical Corp., China), acetic acid (99% purity, Shanghai Tianlian Chemical Technology Co., Ltd., China) and others (starch, perchloric acid, and acetic anhydride, 99% purity Sinopharm Chemical Reagent Co. Ltd, China). The purchased chemicals were used as received.2.2 In situ coking denitrification
Starch or its aqueous solution was used as the denitrification agent. In case of solutions, the mixture was heated at 75 °C for 1 h until a uniform solution was obtained. The denitrification agent was added into the system by mixing with 100 g heavy oils in an appropriate ratio. After pre-coking at 180 °C for a certain number of hours, the coking tank was maintained at a pressure of 0.2 MPa in nitrogen atmosphere. The coking process was operated at 500 °C for 6 h. After the solid impurities were filtered, the product was obtained as a yellow liquid with a yield of 50 ± 5%.2.3 Characterization
The basic nitrogen content of heavy oil was measured using a 2KY-4 Basic Nitrogen Tester (Jiangsu Keyuan Electronic Instrument Co., Ltd., China) according to the standard SH/T0162. The total nitrogen content was analysed using an Antek 9000 nitrogen/sulfur analyser (Antek, USA) based on the standards H/T 0704-2001 and SH/T 0657-2007. The components of the product oil after coking was analysed using a gas chromatograph spectrometer (GC-14C, Shimadzu, Japan). The char composition after the coking process was investigated using an elemental analyser (Vario EL III, Germany).3 Results and discussion
3.1 Effect of starch content on N-removal efficiency
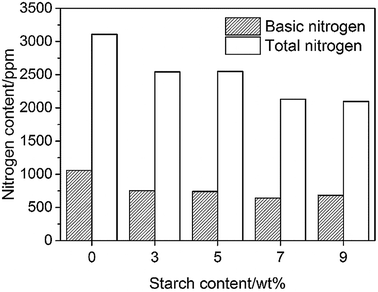
The effect of the starch content on the denitrification process is presented in Fig. 1. It is well known that nitrogen compounds, particularly basic nitrogen compounds, are easily absorbed in the acid active centre of the catalyst and decrease the activity of the catalyst in the catalytic cracking process. Thus, the product yield decreases with the increase in adsorption of the poisonous nitrogen compounds. Therefore, the nitrogen content of the feedstock must be lower than the bearing limit of the catalytic cracking units (basic nitrogen content ≤ 1000 ppm, total nitrogen content ≤ 3000 ppm); the lower the value, the better would be the performance.16 As shown in Fig. 1, the total nitrogen content and basic nitrogen content of heavy oil are about 3100 and 1000 ppm, respectively, after the coking process, approaching the permissible limit. In the case of the processes containing starch, both the total and basic nitrogen contents decrease significantly. The total N-removal efficiency increases with the increase in starch content before stabilizing at ∼32%. A similar tendency is also observed at the basic nitrogen content, which decreases with the increase in the starch content in the range of 3–7 wt% starch content. A slight increase in the basic nitrogen content is obtained when the starch addition is 9 wt%, indicating the saturation of active sites of the starch. The basic N-removal efficiency of ∼40% is the best performance obtained when starch is used as a denitrification agent directly. In the coking process, the structure of polysaccharide compounds (starch, cellulose) will change significantly by the pyrolysis reactions.17 Glucose is the main product at the first step during pyrolysis, which will further decompose to some monomers that undergo dehydration and fragmentation reactions, leading to the formation of chars. The intermediates produced in this process are believed to be the effective species to absorb nitrogen compounds, and will form the chars bundled with nitrogen compounds. Therefore, the nitrogen compounds are removed from the oil. Additionally, Pushkaraj et al. identified some acid species (e.g., 7.52 wt% formic acid and 0.07 wt% acetic acid) produced during pyrolysis of glucose,17 which have close affinity towards basic nitrogen compounds due to the effect of acid–base neutralization.3.2 Effect of water on denitrification process
Table 1 summarizes the effect of water addition on the N-removal efficiency of starch. It is clearly shown that both the total and basic N-removal efficiencies increase apparently by the incorporation of water compared with the system without water under the same operating condition. It was found that 35% basic N-removal efficiency was obtained for the system involving 5 wt% starch (in terms of oil) by adding water in oil with 1/5 ratio. In comparison, more than 7 wt% starch must be added into the system without water in order to obtain similar basic N-removal efficiency. Moreover, the nitrogen content can be further reduced by increasing the water content. The total and basic nitrogen contents decrease respectively to ∼1800 ppm and ∼660 ppm by adding water in oil with 2/5 ratio. Accordingly, water incorporation can effectively improve the N-removal efficiency and also reduce the cost of the materials. This may be attributed to the viscosity reducing effect of water since starch powder will easily stick to the bottom and contact insufficiently with the oil without water.4 More specifically, water will promote starch to coke by hydrothermal carbonization during the pre-coking process, which is similar to the process of pyrolysis.18 The active species formed in this process can easily bind with the nitrogen components in the heavy oil and produce the chars bundled with nitrogen compounds in the final coking process. In this way, more water is introduced into the system and higher N-removal efficiency will be obtained, which can be concluded from the data listed in Table 1. However, the performance is compromised and high energy consumption will be involved with excess addition of water. Therefore, the appropriate water to oil ratio was 1/5, which was chosen for further study.3.3 Effect of pre-coking time on denitrification
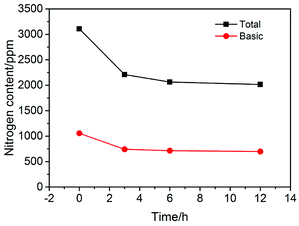
The plots in Fig. 2 show the nitrogen contents measured in the experiments at different pre-coking time. It can be seen that the content of nitrogen compounds decreases significantly after a certain period of pre-coking, which confirms the sufficient hydrothermal carbonization of starch. As we can see from Fig. 2, the N-removal efficiency did not change significantly for pre-coking times beyond 6 hours. In this regard, 6 hours is undoubtedly the appropriate and economical time period for pre-coking.3.4 Characterization of products after coking process
To better understand the effect of the denitrification agent on the coking process, gas chromatography (GC) and element analysis were performed to characterize the products after coking. The distillation range of oil after coking was measured and listed in Table 2. The distillation temperatures of the control and denitrification samples were nearly the same at the initial distillation until 50% oil distillation. The difference between the distillation temperatures of the two samples increased from 17 °C to 64 °C with the increase in the oil distillation. It seems that the denitrification agent used in this study could not only reduce the content of nitrogen compounds in the oil, but also improve the quality of product oil. The reason may be that some intermediates produced in the hydrothermal carbonization process can catalyse the cracking reaction of heavy oil, thus increasing the content of lighter components, which will be an advantage for the industrial application of the in situ coking denitrification technique.| Distillation temperature (°C) | Control | Denitrification |
|---|---|---|
| a The control sample was obtained by a coking method without adding any denitrification agent. The denitrification sample was obtained by the in situ coking process with the best denitrification agent used in our study (solution was made by mixing of 5 wt% starch (w.r.t. oil) and water/oil ratio of 1/5 under a 6 h pre-coking). | ||
| Initial boiling point | 61.9 | 62.9 |
| 10% | 72.9 | 75.5 |
| 30% | 139.0 | 131.9 |
| 50% | 197.2 | 179.4 |
| 70% | 264.8 | 228.3 |
| 90% | 385.9 | 321.8 |
Table 3 lists the major composition of char. The nitrogen content increases significantly by the incorporation of starch as a denitrification agent, indicating the nitrogen bundle effect of starch, which plays a key role in the in situ coking process.
| Sample | N (%) | C (%) | H (%) |
|---|---|---|---|
| a The control sample was obtained by a coking method without adding any denitrification agent. The denitrification sample was obtained by the in situ coking process with the best denitrification agent in our work (solution made by mix starch of 5 wt% ratio of oil and water/oil ratio of 1/5 in the solution under a 6 h precoking). | |||
| Control | 0.94 | 92.56 | 3.45 |
| Denitrification | 1.23 | 92.18 | 3.34 |
3.5 Developing a structure-oriented lumping model (SOL) of in situ coking denitrification
The lumping method is the most common method for building a kinetic model, which can obtain reliable results on predicting product distribution. In this section, the entire process of building a new kinetic model of in situ coking denitrification by a SOL method was illustrated.(1) Structure increments of heavy oil. A total of 22 structure increments were selected to depict the hydrocarbon and nonhydrocarbon molecule of heavy oil according to the properties of heavy oil and the theory of SOL, which are listed in Table 4.
(2) Selection of seed molecules. According to the characterization results of the molecules in the feed oil using multiple analytical methods,19 138 types of seed molecules were designed. The length of carbon chains was determined by the distillation range and molecular weight distribution of the feed.20
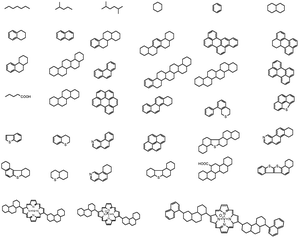
A total of 138 single-core seed molecules and multi-core seed molecules were selected as the seed molecules of the heavy oil, which are shown partially in Fig. 4. In particular, the homologous series can be obtained by increasing the length of carbon chains of these seed molecules, resulting in 7004 molecules.
Some molecules in heavy oil could be depicted by structure vectors as shown in Table 5.
The feed composition matrix comprised 7004 rows × 23 columns. The first 7004 rows × 22 columns represented 7004 molecules. The last column in the feed composition matrix was a column vector containing 7004 elements.
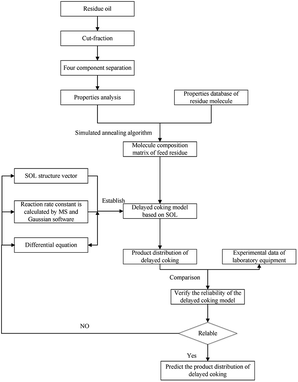
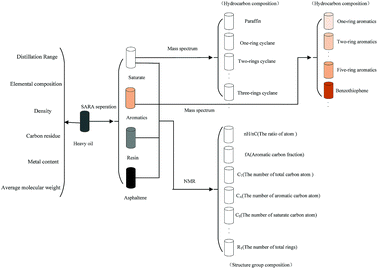
(3) Fraction cutting of heavy oil. A supercritical fluid extraction fractionator was used to cut the fraction of heavy oil, as shown in Fig. 5. Eight close cut fractions were obtained, which were investigated by a four component-analytical method to acquire the content of saturated fraction, aromatic fraction, resin and asphaltene as well as the distillation range, elemental and structural composition, carbon residue, and molecular weight distribution. The molecular average structural parameters of saturated and aromatic fractions were measured using a gas chromatograph-mass spectrometer (GC-MS, Agilent GC-2014, USA). Tables 6 and 7 list the composition of close cut fractions and the MS results of saturated fractions, respectively, when the yield was 60%.
| Close cut fractions | C (%) | H (%) | S (%) | N (mg kg−1) | Aryl C (mol%) | Yield (%) |
|---|---|---|---|---|---|---|
| 1 | 85.48 | 12.11 | 1.80 | 1864 | 10.51 | 20% |
| 2 | 85.51 | 11.95 | 1.68 | 1863 | 10.80 | 30% |
| 3 | 85.51 | 11.95 | 1.75 | 2383 | 11.43 | 40% |
| 4 | 85.44 | 11.83 | 1.63 | 2540 | 11.49 | 45% |
| 5 | 85.52 | 11.99 | 1.76 | 2397 | 11.68 | 50% |
| 6 | 85.70 | 11.92 | 1.71 | 2365 | 11.84 | 55% |
| 7 | 85.42 | 12.07 | 1.73 | 2319 | 12.59 | 60% |
| Hydrocarbon composition (%) | N-alkanes | Isoalkanes | 1-ring | 2-rings | 3-rings | 4-rings | 5-rings | 6-rings |
|---|---|---|---|---|---|---|---|---|
| Distillate oil | 12.54 | 19.06 | 18.9 | 25.4 | 7.9 | 13.3 | 2 | 0.9 |
Based on the properties and the average molecular structural parameter of each fraction, the initial contents of the 7004 molecules were set and optimized by a stimulated annealing algorithm to obtain the optimal contents. In the calculation, as the number of molecules in the feed matrix increases, the accuracy of the prediction of the model increases. When the number of molecules exceeds 7004, the improvement in accuracy of the prediction is not evident, but the calculation time increases significantly. Hence, 7004 molecules, which are obtained by increasing the length of carbon chains of these seed molecules, were selected as molecules of the feed. The molecular matrix of each fraction would be established by taking advantage of this information,21 and the sum of molecular matrix of the 8 cut fractions was the matrix of the heavy oil. Some virtual molecules and their contents are shown in Table 8, and the values of the properties and structural parameters between experiment and calculation are listed in Table 9. It can be seen that the proposed matrix describes the experimental data satisfactorily. The difference between the experimental value and the calculated value is lower than 9%. Hence, the matrix can be used to develop an in situ coking denitrification model based on a structure-oriented lumping method.
| Properties | Experimental value | Calculated value | Difference (%) |
|---|---|---|---|
| Carbon residue, wt% | 19.65 | 18.33 | −6.72 |
| Molecular weight, g mol−1 | 623 | 604 | −3.04 |
| C, wt% | 87.50 | 85.36 | −2.45 |
| H, wt% | 11.35 | 11.78 | 3.79 |
| S, wt% | 0.45 | 0.42 | −4.44 |
| N, wt% | 0.55 | 0.58 | 5.45 |
| Ni, wt% | 0.00102 | 0.00108 | 5.88 |
| V, wt% | 0.00120 | 0.00113 | −5.83 |
![[thin space (1/6-em)]](https://www.rsc.org/images/entities/char_2009.gif) |
|||
| Group composition | |||
| Saturate, wt% | 45.53 | 46.79 | 1.23 |
| Aromatics, wt% | 38.34 | 36.75 | −4.15 |
| Resin, wt% | 7.42 | 6.93 | −0.49 |
| Asphaltene, wt% | 8.56 | 9.24 | 7.94 |
![[thin space (1/6-em)]](https://www.rsc.org/images/entities/char_2009.gif) |
|||
| Structural composition | |||
| RA | 1.66 | 1.79 | 7.83 |
| RN | 4.72 | 4.31 | −8.69 |
| fA, wt% | 18.74 | 19.23 | 2.61 |
During the precoking process, the solution of denitrification agent (starch) was heated up to 180 °C and the temperature was maintained for 6 hours. The hydrothermal reaction of starch would take place under this condition. The starch would decompose and produce many small molecules with carbonyl, hydroxyl or carboxyl groups, such as dihydroxyacetone, glyceraldehyde, 5-hydroxymethyl furfural and other substances. Fig. 6 displays structures of the products obtained from the hydrothermal reaction of starch.
These molecules could actively react with nitrogen compounds in heavy oil during the coking process. More importantly, these nitrogen compounds would finally discharge as gas or form coke, resulting in the reduction of nitrogen content in the product oil. Some of the reactions between active molecules and nitrogen compounds are shown as follows:
(a) Reaction between glyceraldehyde and pyridine compounds (basic nitrogen compounds):
(b) Reaction between hydroxyaldehyde compounds or 5-hydroxymethyl furfural and aniline compounds (basic nitrogen compounds):
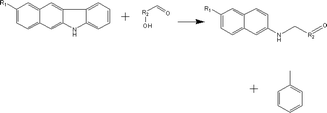
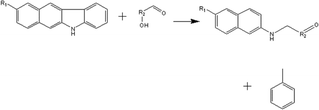
(c) Reaction between hydroxyaldehyde compounds and pyrrole or carbazole compounds (non-basic nitrogen compounds):
(1) Reaction rules of coking. (a) Cracking reaction of carbon chain:
Reactant selection rule: (A6 + N6 + N5 = 0) ∧ (IH = 1) ∧ (RO + KO = 0) ∧ (R ≥ 3).
Product 1 generation rule: R1 = 1, IH1 = 1, br1 = 0.
Product 2 generation rule: R2 = R − R1, IH2 = IH-1, br2 = (br ≥ 1) × (R ≥ 4).
(b) Cracking reaction of side chain:
Reactant selection rule: ((A6 > 0) ∨ (N6 > 0)) ∨ (N5 > 0) ∧ (R ≥ 10 + KO) ∧ (A6 < 10) ∧ (N6 < 10).
Product 1 generation rule: R1 = round (4 + (R–me–KO) × round (1)), br1 = 1, the rest increment is 0.
Product 2 generation rule: R2 = R − R1, br2 = 1, the rest increment is invariable.
(c) Dehydrogenation:
Reactant selection rule: ((A6 < 10) ∧ (N6 < 10)) ∧ ((N6 < 10) ∨ ((N4 > 0) ∧ (NS + NN − N3 − N1 = 0))) ∧ (IH ≥ −1).
Product 1 generation rule: IH1 = 1, the rest increment is 0.
Product 2 generation rule: IH2 = IH-1, the rest increment is invariable.
(d) Synthesis of diene
Reactant selection rule: (A61 + N61 + N51 = 0) ∧ (IH1 = −1).
Product 1 generation rule: (A62 + N62 + N52 = 0) ∧ (IH2 = 0).
Product 2 generation rule: N6 = 1, R = R1 + R2 − 6, IH = −1, br = 0, me = ((R1 = 5) + (R2 = 3)), the rest increment is the sum of the increment of reactant and product.
(2) Reaction rules of the reactions between starch and nitrogen compounds. (a) Reaction between glyceraldehyde and pyridine compounds (basic nitrogen compounds):
Reactant selection rule:
Reactant1: A61 + N61 + N51 = 0 ∧ ((R1 = 3 ∧ RO1 = 2) ∨ (R1 = 4 ∧ RO1 = 3)) ∧ IH1 = 0 ∧ KO1 = 1.
Reactant 2: A62 ≥ 1 ∧ A42 ≥ 0 ∧ N62 + N52 = 0 ∧ R2 ≥ 0 ∧ IH2 = 0 ∧ AN2 = 1.
Product generation rule: A6 = A62, A4 = A42, AN = AN2, RO = RO1, IH = 0, me = 0, the rest increment is the sum of the increment of reactant and product.
(b) Reaction between hydroxyaldehyde compounds and aniline compounds (basic nitrogen compounds):
Reactant selection rule:
Reactant 1: A61 + N61 + N51 = 0 ∧ R1 ≥ 2 ∧ br1 ≥ 0 ∧ IH1 = 1 ∧ KO1 = 1 ∧ RO1 = 1.
Reactant 2: A62 + A42 ≥ 1 ∧ N62 + N52 = 0 ∧ R2 ≥ 0 ∧ IH2 = 0 ∧ RN2 ≥ 1.
Product generation rule: A6 = A62, A4 = A42, IH = 0, KO = 0, RO = 1, the rest increment is the sum of the increment of reactant and product.
(c) Reaction between 5-hydroxymethyl furfural and aniline compounds (basic nitrogen compounds):
Reactant selection rule:
Reactant1: A61 = 0 ∧ N51 = 1 ∧ R1 = 2 ∧ IH1 = −2 ∧ NO1 = 1 ∧ KO1 = 1 ∧ RO1 = 1.
Reactant 2: A62 = 2 ∧ A42 ≥ 0 ∧ AA2 = 1 ∧ NN2 = 1.
Product generation rule:
Product 1: A6 = 1, A4 = 1, N5 = 1, AN = 1, IH = −2, NO = 1, RO = 1, R = R2, the rest increment is the sum of the increment of reactant and product.
Product 2: A6 = 1, R = 1, the rest increment is 0.
(d) Reaction between hydroxyaldehyde compounds and carbazole compounds (non-basic nitrogen compounds):
Reactant selection rule:
Reactant1: A61 + N61 + N51 = 0 ∧ R1 ≥ 2 ∧ RO1 = 1 ∧ KO1 = 1.
Reactant 2: A62 = 2 ∧ A42 ≥ 0 ∧ AA2 = 1 ∧ NN2 = 1.
Product generation rule:
Product 1: AA = 0, NN = 0, A6 = 1, A4 = A42, R = R2, NN = 1, KO = 1, RO = 0, the rest increment is the sum of the increment of reactant and product.
Product 2: A6 = 1, R = 1, the rest increment is 0.
(e) Reaction between hydroxyaldehyde compounds and pyrrole or carbazole compounds (non-basic nitrogen compounds):
Reactant selection rule:
Reactant 1: A61 + N61 + N51 = 0 ∧ R1 ≥ 2 ∧ RO1 = 1 ∧ KO1 = 1.
Reactant 2: A62 = 0 ∧ N52 = 1 ∧ NN2 = 1 ∧ IH2 = −2.
Product generation rule: R = R1 + R2 + 4; IH = −2; NN = 1, KO = 1, the rest increment is the sum of the increment of reactant and product.
Product 2: A6 = 1, R = 1, the rest increment is 0.
The sub-amino group in non-basic nitrogen compounds can be converted to the amino group at first, and this new basic nitrogen compound will react with the small molecules decomposed from glucose. Therefore, the intermediate step is neglected in the reaction rules, i.e., the non-basic nitrogen compound reacts directly with small molecules produced from glucose.
 | (1) |
In the equation, ΔE and ΔS of simple reactions were calculated by Materials Studio as a regression aggregate. The “lsqcurvefit” function and the Matlab optimization toolbox were used, and equations to calculate ΔS and ΔE could be obtained.22 The common function type is as follows:
| y = a1 × x1b1 + a2 × x2b2 +…+ a3 × x3b3 + c |
As for the numbers of the included elements in the equations, because of the relationship between activity and structure23 and because structure vectors were used to describe the molecular structure in the SOL method, the activity could be described by structure vectors.
Starch can react with basic nitrogen compounds and non-basic nitrogen compounds. The correlation of ΔS, ΔE and expressed by structure increments are as follows.
(1) Reaction between glyceraldehyde and pyridine compounds (basic nitrogen compounds):
| ΔE = −0.1948 × (A62 + A42)0.4013 + 0.0519 × R10.5092 + 0.0496 × R20.1948 + 0.5963 × (RO1 + KO1)0.3219 + 0.8321 × AN20.9423 + 0.4329 × NN20.3141 + 0.3145 × RN20.2133 |
(2) Reaction between hydroxyaldehyde compounds and aniline compounds (basic nitrogen compounds):
| ΔE = −0.2133 × (A62 + A42)0.4532 + 0.0628 × R10.5289 + 0.0345 × R20.1832 + 0.5672 × (RO1 + KO1)0.3134 + 0.9485 × AN20.8953 + 0.4132 × NN20.3267 + 0.4178 × RN20.3614 |
(3) Reaction between 5-hydroxymethyl furfural and aniline compounds (basic nitrogen compounds):
| ΔE = −0.2657 × (A62 + A42)0.3987 + 0.0513 × R10.4728 + 0.0198 × R20.1936 + 0.3893 × (RO1 + KO1)0.2896 + 0.8135 × AN20.9022 + 0.5396 × NN20.3654 + 0.3658 × RN20.4378 |
(4) Reaction between hydroxyaldehyde compounds and carbazole compounds (non-basic nitrogen compounds):
| ΔE = −0.3687 × (A62 + A42)0.5276 + 0.0579 × R10.4319 + 0.0531 × R20.1832 + 0.4729 × (RO1 + KO1)0.3087 + 0.9263 × AN20.8953 + 0.4132 × NN20.3267 + 0.4178 × RN20.3614 |
(5) Reaction between hydroxyaldehyde compounds and pyrrole or carbazole compounds (non-basic nitrogen compounds):
| ΔE = −0.2839 × (A62 + A42)0.4266 + 0.0579 × R10.4319 + 0.0586 × R20.1328 + 0.4729 × (RO1 + KO1)0.3087 + 0.9485 × AN0.89532 + 0.4132 × NN20.3267 + 0.4178 × RN20.3614 |
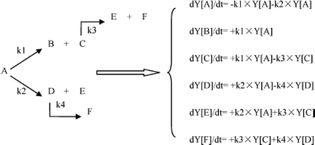
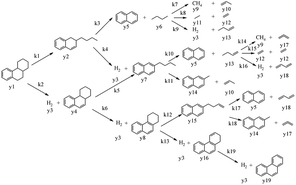
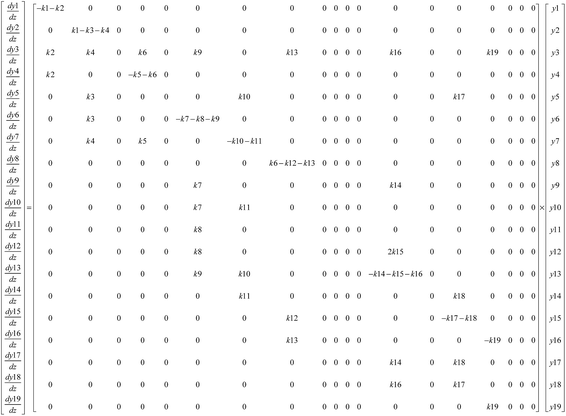
In this model, each reaction rule was formulated as a judgment sentence with Matlab. The matrix of raw materials, which is judged by reaction rules, can determine the reaction path of each molecule. Finally, we can construct an enormous reaction network. Each reaction in the network was described as a differential kinetic equation, and the reactions were operated by solving the equations. Fig. 7 illustrates the reaction network of octahydrophenanthrene during coking, including 19 reactions such as cracking, dehydrogenation, and ring-opening, which involves 19 molecules. The kinetic differential equations of octahydrophenanthrene in delayed coking are listed in Fig. 8.
Although the number of equations will be large with this method, differential equations can be entirely solved with a fourth-to-fifth-order Runge–Kutta algorithm in Matlab because all of the reactions are first-order reactions. The solutions represent the relative content distributions of these 138 seed molecules with time; thus, the product distribution can be predicted.
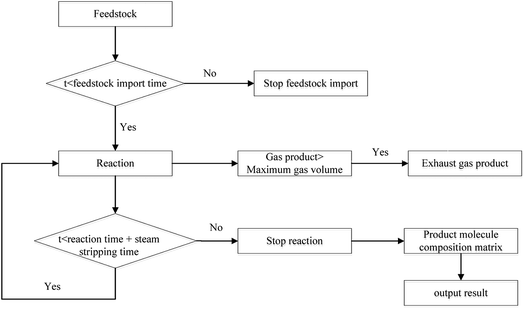
(1) At the beginning of the reaction, the reaction in 1st time period was calculated in order to obtain the distribution of products. The maximum amount of gas in the coking tower was calculated. If the amount of gas produced was greater than the maximum amount of gas, the material was discharged from the discharge port.
(2) After re-feeding, the wax in the tower was discharged and mixed with the raw material based on the cycle. The distribution of products in the next time period was calculated after the mixing process, and the excess gas was discharged.
(3) The above cycle was repeated until the cumulative reaction time was equal to the actual reaction time. Then, the feed was stopped. The distribution of products was calculated at a time interval of 1 s, and the excess gas was discharged.
(4) When the cumulative reaction and the stripping were completed, the molecular matrix of the entire reaction process, that is, the distribution of products of delayed coking, was obtained, and the calculation process is shown in Fig. 9.
The product was divided into various fractions based on the molecular matrix: the molecules below C4 were classified as coking gas; the molecules with boiling points less than 205 °C were classified as coking gasoline; the molecules with boiling points between 205 °C and 365 °C and atomic number below 24 belong to diesel; the molecules with boiling points higher than 450 °C and carbon content above 90% are coke; and others belong to the wax component.
![[thin space (1/6-em)]](https://www.rsc.org/images/entities/char_2009.gif) :
:![[thin space (1/6-em)]](https://www.rsc.org/images/entities/char_2009.gif) 5, the distribution of the products was calculated by the SOL model with the starch content in the denitrification agent ranging from 0 to 15%. In particular, the results are further compared with experimental data under the same condition, which is shown in Tables 10 and 11.
5, the distribution of the products was calculated by the SOL model with the starch content in the denitrification agent ranging from 0 to 15%. In particular, the results are further compared with experimental data under the same condition, which is shown in Tables 10 and 11.
| Content/% | Gasoline/% | Diesel/% | Wax oil/% | |
|---|---|---|---|---|
| a The distilled temperatures of gasoline, diesel and wax oil are <200 °C, 200–320 °C and >320 °C, respectively. | ||||
| Control | Calculation | 50.4 | 33.5 | 16.1 |
| Experiment | 50.9 | 32.6 | 16.5 | |
| Error | −0.99 | 2.69 | −2.48 | |
| 3 | Calculation | 54.1 | 31.8 | 14.1 |
| Experiment | 53.2 | 32.3 | 14.5 | |
| Error | 1.66 | −1.57 | −2.84 | |
| 5 | Calculation | 55.5 | 31.1 | 13.4 |
| Experiment | 54.3 | 32.0 | 13.7 | |
| Error | 2.16 | −2.89 | −2.23 | |
| 7 | Calculation | 56.4 | 32.3 | 11.3 |
| Experiment | 57.4 | 31.6 | 11.0 | |
| Error | −1.77 | 2.17 | 2.65 | |
| 9 | Calculation | 59.2 | 30.9 | 9.9 |
| Experiment | 58.6 | 31.3 | 10.1 | |
| Error | 0.10 | −1.29 | −2.02 | |
| 11 | Calculation | 60.5 | 30.0 | 9.5 |
| Experiment | 59.5 | 30.8 | 9.7 | |
| Error | 1.65 | −2.67 | −2.11 | |
| 13 | Calculation | 58.9 | 31.9 | 9.2 |
| Experiment | 59.4 | 31.1 | 9.5 | |
| Error | −0.85 | 2.51 | −2.17 | |
| 15 | Calculation | 58.6 | 31.6 | 9.8 |
| Experiment | 59.8 | 30.7 | 9.5 | |
| Error | −2.05 | 2.85 | 3.06 | |
| Content (%) | Yield of liquid (%) | Basic nitrogen removal efficiency (%) | Total nitrogen removal efficiency (%) | |
|---|---|---|---|---|
| Control | Calculation | 45.46 | 0 | 0 |
| Experiment | 47.02 | 0 | 0 | |
| Error | −3.43 | 0 | 0 | |
| 3 | Calculation | 46.33 | 28.15 | 27.04 |
| Experiment | 45.59 | 28.88 | 27.69 | |
| Error | 1.60 | −2.59 | −2.40 | |
| 5 | Calculation | 47.95 | 33.63 | 31.03 |
| Experiment | 47.70 | 34.66 | 32.22 | |
| Error | 0.52 | −3.06 | −3.83 | |
| 7 | Calculation | 48.89 | 41.14 | 37.87 |
| Experiment | 50.33 | 39.30 | 36.40 | |
| Error | −2.95 | 4.47 | 3.88 | |
| 9 | Calculation | 48.54 | 41.97 | 38.87 |
| Experiment | 48.32 | 41.38 | 38.18 | |
| Error | 0.45 | 1.41 | 1.78 | |
| 11 | Calculation | 50.10 | 42.03 | 38.92 |
| Experiment | 48.66 | 42.71 | 39.36 | |
| Error | 2.87 | −1.62 | −1.13 | |
| 13 | Calculation | 51.12 | 44.14 | 39.27 |
| Experiment | 50.44 | 43.66 | 40.39 | |
| Error | 1.33 | 1.09 | −2.85 | |
| 15 | Calculation | 52.34 | 46.23 | 41.71 |
| Experiment | 50.25 | 44.32 | 40.66 | |
| Error | 4.00 | 4.13 | 2.52 |
It can be seen from Tables 10 and 11 that the calculated yields and distribution of the products were in good agreement with the experimental results in the range of 0–15% starch content, where the relative error was less than 3% and 9%, respectively. This concludes that the SOL model established in this study can be used to predict the influence of starch content on the distribution of products and denitrification performance.
4 Conclusion
In conclusion, starch has been applied to in situ coking denitrification of heavy oil, which can significantly decrease the basic and total nitrogen content. The lowest contents of basic nitrogen and total nitrogen in the product oil are ∼40% and ∼30%, respectively. Water incorporation and optimal precoking time was beneficial for the coking process. A molecular level process model for in situ coking denitrification technology was developed to rationally control the product distribution by the SOL reaction kinetic model, which can be used to predict the influence of starch content on the distribution of products and denitrification performance. More importantly, nitrogen compounds in heavy oil are transformed to the chars via in situ directional conversion after the incorporation of starch, which is competitive without other independent denitrification processes (such as extraction tower, absorption and so on) involved besides coking compared with other denitrification techniques reported.Conflicts of interest
There are no conflicts to declare.Acknowledgements
This work was supported by the Program of Leading Talents (2013), the Fundamental Research Funds for the Central Universities (22A1818025), National Natural Science Foundation of China (21476082).Notes and references
- L. Zekun, W. Gang, S. Quan, X. Chunming and G. Jinsen, Ind. Eng. Chem. Res., 2011, 50, 4123 CrossRef.
- L. Zekun, W. Gang, L. Yindong, G. Jinsen, X. Chunming, L. Yongmei and W. Xiaoqin, Fuel Process. Technol., 2013, 115, 1 CrossRef.
- W. Qiang, W. Shihang, T. Xiujuan, Z. Tao, Z. Yasong, C. Keng and X. Chunming, Fuel Process. Technol., 2015, 129, 76 CrossRef.
- W. Hui, X. Congxia, Y. Shitao and L. Fusheng, Chem. Eng. J., 2014, 237, 286 CrossRef.
- A. Masoud, M. Xiaoliang and S. Chunshan, Energy Fuels, 2009, 23, 3940 CrossRef.
- W. Yanzhen, L. Ruili and L. Chenguang, Fuel Process. Technol., 2005, 86, 419 CrossRef.
- P. E. Boahene, K. Soni, A. K. Dalai and J. Adjaye, Appl. Catal., B, 2011, 101, 294 CrossRef.
- G. M. Bollas, A. A. Lappas, D. K. latridis and I. A. Vasalos, Catal. Today, 2007, 127, 31 CrossRef.
- G. Haohua, W. gang, X. Chunming and G. Jinsen, Energy Fuels, 2014, 28, 6554 CrossRef.
- C. Araujo-Monroy and F. López-Isunza, Ind. Eng. Chem. Res., 2006, 45, 120 CrossRef.
- R. J. Quann and S. B. Jaffe, Ind. Eng. Chem. Res., 1992, 31, 2483 CrossRef.
- R. J. Quann and S. B. Jaffe, Chem. Eng. Sci., 1996, 51, 1615 CrossRef.
- Y. Bolun, Z. Xiaowei, C. Chun, Y. Jun and W. longyan, Ind. Eng. Chem. Res., 2008, 47, 4648 CrossRef.
- T. Lida, W. Jiming, S. Benxian and L. Jichang, Energy Fuels, 2010, 24, 4380 CrossRef.
- S. B. Jaffe, H. Freund and W. N. Olmstead, Ind. Eng. Chem. Res., 2005, 44, 9840 CrossRef.
- B. Hou, Z. Cao, W. Chen and J. Han, Pet. Sci. Technol., 2007, 25, 1013 CrossRef.
- R. P. Pushkaraj, A. S. Justinus, C. B. Robert and H. S. Brent, J. Anal. Appl. Pyrolysis, 2009, 86, 323 CrossRef.
- F. Yan, Y. Jun, C. Jie, L. Hui and Z. Xianwei, Fuel, 2016, 180, 591 CrossRef.
- E. K. Kim, M. H. No and J. S. Koh, Mass Spectrom. Lett., 2011, 2, 41 CrossRef.
- J. Liu, H. Chen, Z. Pi, Y. Liu, H. Sun and B. Shen, Ind. Eng. Chem. Res., 2017, 56, 3568 CrossRef.
- R. Zhu, B. Shen, X. Chen and J. Liu, Energy Sources, Part A, 2013, 35, 2010 CrossRef.
- L. Tian, B. Shen and J. Liu, Energy Fuels, 2012, 26, 1715 CrossRef.
- L. P. Hammett, J. Am. Chem. Soc., 1937, 59, 96–103 CrossRef.
| This journal is © The Royal Society of Chemistry 2018 |

